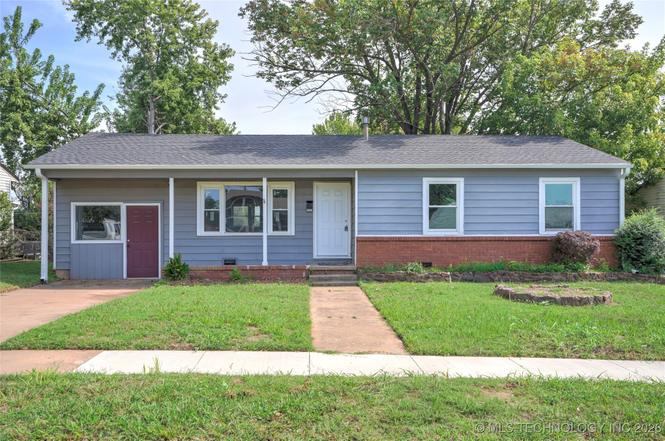
4855 S Maybelle Ave · Tulsa, OK
Flood risk 1/10 · Minimal
- FEMA flood zone
- X (unshaded)
- Chance of flooding over 30 yrs
- 0.0%
- Est. flood insurance / yr
- $507 – $1,088
Fire risk 5/10 · Moderate
- Est. fire insurance / yr
- $2,463 – $4,575
Heat risk 6/10 · Moderate
- Hot days now (above 111°F)
- 7 days/yr
- Hot days in 30 yrs
- 18 days/yr
Wind risk 3/10 · Minor
- Chance of severe wind over 30 yrs
- 4.0%
Air-quality risk 3/10 · Minor
- Unhealthy air days now
- 2 days/yr
- Unhealthy air days in 30 yrs
- 3 days/yr
Risk factors via First Street. Map © Google.
Why this score? — see what drove the C+ grade
The composite is a weighted blend of 9 inputs, each scored 0–100. Each bar is that input's sub-score; the figure is the points it added to the 100-point composite (weight × sub-score).
- Cash flow +23.2/30.0
- ARV discount +15.0/15.0
- DSCR +7.5/10.0
- 1% rule +5.8/10.0
- Livability +3.8/5.0
- Rent growth +2.7/5.0
- Condition / age +2.5/5.0
- Schools +0.8/10.0
- Appreciation +0.0/10.0
$139,900
🖨 Deal sheet 📄 Offer letter ✓ Due diligence
Listing remarks
This home is conveniently located just West of the River off of I-44. With close proximity to Hwy 75, I-44, Riverside & Peoria, you would have an easy commute no matter the direction. The spacious home features a large living, separate dining and a nice back yard with a large deck, making this the perfect home for any buyer. This home has a brand new roof and newly installed Luxury Vinyl Plank Flooring to the living room. Selling as-is
Key facts
- Large deck
- New roof
- 8,316 sq ft lot
Tags
Neighborhood map
What this means for you Summary
Snapshot
- This is a 3-bed/1.0-bath single-family listed at $140k.
Deal economics
- At list price, monthly cash flow is $254 ($3k/yr) — positive.
- The deal already cash-flows at list — no discount required.
- Meets the 1% rule at list price ($2k rent vs $140k).
- Recommended offer: $132k (6.0% below list) — sets the bar for market timing.
- Cap rate 8.5% vs local median 3.9% in Tulsa — top-decile yield for the area; either an underpriced asset or a hidden risk that comps aren't pricing in. Stress-test before assuming the spread holds.
Location & tenants
- Location reads 75/100 on livability (#13 in OK, #4,058 nationally) — a middle-class / working-renter tenant base. Strengths: amenities A+, commute A+, cost of living A+; Watch: schools F, crime F, employment D-.
- Tulsa (urban): math 7% / reading 12% proficiency, ranked #250 of 270 in OK (top 93%) — low school quality limits family demand, transient renter base, plan for 1-2y turnover; 76% free/reduced lunch — lower-income household profile, screen leases tightly.
- Market conditions: Rents flat; 99 active listings in the ZIP; 4 comparable units currently listed for rent nearby; rentals at typical pace (median 24d on market — plan ~3-4 weeks tenant-placement turnaround); 2,818 units permitted in Tulsa County in 2024 (518 in 5+ unit buildings).
- This rent runs 34% of the median local income ($54k/yr) — at the standard rent-burdened threshold; future hikes will face affordability resistance.
Forward outlook
- Local home prices are declining (-3.0%/yr); year-one equity from $967 of loan paydown is wiped out by about $4k of value loss. Plan a longer hold.
- Tulsa County population projected at +30% by 2050 — long-run rental-demand tailwind backs the buy-and-hold thesis.
Negotiation context
- It's been on market 70 days — a 6% lower offer ($132k) is reasonable based on typical stale-listing flexibility.
- 6 sale attempts since 35y ago; this cycle's ask has dropped $8k (5%) from the opening price — seller is motivated, your offer sets the floor, not the list.
Risks & watch-outs
- Watch-outs: built in 1956 — expect roof / HVAC / electrical / plumbing capex.
- Climate carrying-cost: moderate wildfire risk; extreme-heat days projected 7→18/yr by 2055 (HVAC capex compounding) — expect insurance premiums to compound above CPI over the hold.
Questions for the listing agent
- It's been on market 70 days. Have you received any prior offers? Is the seller open to a 6% concession, seller financing, or rate buy-down credit?
- Built in 1956 — when were the roof, HVAC, electrical panel, plumbing, and water heater last replaced?
- Why hasn't it sold? Are there any deal-killer items the seller is aware of (foundation, flood, title, zoning, code violations)?
- Is there a deadline driving the sale (1031 exchange, divorce, estate, relocation)? That informs how much negotiation room exists.
- Schools are F-rated, which usually means shorter tenancies and higher turnover. Who's the typical renter profile here, and what's been the actual vacancy rate?
- Crime grade is F in this area — have there been break-ins, vandalism, or insurance claims at this property in the last 3 years? What carrier currently insures it and at what premium?
- What's the average days-on-market for RENTAL listings here right now (not sales)? A rising rental-DOM trend means longer vacancies and softer asking-rent achievability than the comps imply.
- What's the recent tenant-quality profile in this submarket — average credit score on applications, eviction rate, late-payment / NSF rate, and stable-employment percentage? A property-management company in the area should have these aggregated.
- How much new for-sale + rental construction is in the pipeline within 1–3 miles? Heavy new supply typically softens prices + rents 12–24 months out; constrained supply supports both.
Investment metrics
- 1% rule
- 1.08% ✓
- Cap rate
- 8.47%
- Cash-on-cash
- 7.77%
- DSCR
- 1.35
- GRM
- 7.7
CMA / ARV
- ARV (on-the-fly)
- $225,760
- Comps found
- 8
Show comp detail 8 sales within ~0.75 mi
| Address | Dist | Beds/Ba | Sqft | Sold | Price | $/sf | Match |
|---|---|---|---|---|---|---|---|
| 4939 S Olympia Ave | 0.21mi | 3/2.0 | 1,650 (-1%) | 3mo | $225,000 | $136 | 83 |
| 1315 W 49th St | 0.33mi | 2/2.0 (-1) | 1,540 (-7%) | 0mo | $176,000 | $114 | 63 |
| 4946 S Olympia Ave | 0.23mi | 3/1.5 | 1,516 (-9%) | 14mo | $185,000 | $122 | 62 |
| 4747 S Santa Fe Ave | 0.37mi | 3/2.0 | 1,487 (-10%) | 3mo | $223,000 | $150 | 59 |
| 4745 S Santa Fe Ave | 0.37mi | 3/2.0 | 1,433 (-14%) | 19mo | $210,000 | $147 | 40 |
| 1905 W 49th St | 0.69mi | 3/2.0 | 1,433 (-14%) | 6mo | $165,000 | $115 | 36 |
| 4603 S Waco Ave | 0.72mi | 4/1.5 (+1) | 1,449 (-13%) | 6mo | $200,000 | $138 | 33 |
| 1919 W 47th St | 0.75mi | 4/2.0 (+1) | 1,504 (-9%) | 13mo | $179,000 | $119 | 30 |
Match score weights: distance 35% · size 25% · config 20% · recency 20%. Top-matched comps best support the ARV.
Projected returns pro-forma
-3.0% appreciation · 0.78% rent growth · sell at horizon
- IRR
- -6.9%
- Equity multiple
- 0.75×
- Total profit
- $-9,806
- Equity at exit
- $20,860
- IRR
- -0.3%
- Equity multiple
- 0.98×
- Total profit
- $-672
- Equity at exit
- $12,096
Cash invested: $39,172 (down + closing). Projections, not guarantees.
Landlord ↔ Tenant lean methodology
- Overall (STATE)
- 83 Strongly Landlord-Friendly
- State Oklahoma
- 83 Strongly Landlord-Friendly · R+20
- County
- — inherits STATE
- City
- — inherits STATE
ZIP-level market 74107
- Home prices YoY
- -15.3%
- Rents YoY
- 0.8%
- Active inventory
- 99
- Price-to-rent
- 7.7×
Monthly cashflow live
- Estimated rent
- $1,513 medium interval (Pro) →
- Mortgage (P&I)
- −$734
- Tax from tax record
- −$149 /mo · $1,792/yr
- Insurance
- −$58
- HOA
- −$0
- Vacancy / Maint / Mgmt
- −$318
- Net cashflow
- $254
Break-even live
UW: 25.0% down · 7.5% · 30yr · 1.5% tax · 5.0% vac · 8.0% maint · 8.0% mgmt
Financing live
Cash to close
- Down payment
- $34,975
- Closing costs
- $4,197
- Reserves months
- —
- Total cash needed
- —
Loan-product check · same deal, 3 products live
Conventional
25% down · 7.5% · 30yr
- Down + closing
- —
- Monthly P&I
- —
- Monthly cashflow
- —
- DSCR
- —
- Eligible?
- —
Personal DTI + credit; lowest rate.
DSCR
20% down · 8.5% · 30yr
- Down + closing
- —
- Monthly P&I
- —
- Monthly cashflow
- —
- DSCR
- —
- Eligible?
- —
No personal income docs; deal must DSCR.
Hard money
10% down · 12.0% · 12mo
- Down + closing
- —
- Monthly P&I
- —
- Monthly cashflow
- —
- DSCR
- —
- Eligible?
- —
Short-term bridge; refi at stabilization.
Rent comps 4 comps
| Address | Beds | Baths | Sqft | Rent | $/sqft | DOM | Units | Dist |
|---|---|---|---|---|---|---|---|---|
| 1913 W 50th St Tulsa, OK | 3.0 | 2.0 | 1082 | $1,195 | $1.10 | 23d | 1 | 0.72mi |
| 1936 W 40th St Tulsa, OK | 2.0 | 2.0 | 1286 | $2,150 | $1.67 | 21d | 1 | 1.13mi |
| 4328 S 27th West Ave Tulsa, OK | 3.0 | 1.5 | 1606 | $1,650 | $1.03 | 23d | 1 | 1.24mi |
| 1115 E 48th Pl Tulsa, OK | 3.0 | 1.5 | 1195 | $1,500 | $1.26 | 23d | 1 | 1.36mi |
Listing history 19 events
-
2026-04-14status Pending
-
2026-02-28price $139,900
-
2026-02-03$147,900 Active
-
2026-01-30historical
-
2025-12-05price $148,000
-
2025-10-16$159,900 Active
-
2025-10-10price $159,900
-
2025-10-10historical
-
2025-10-02price $164,900
-
2025-08-19status Active
-
2025-06-23status Pending
-
2025-04-09price $165,000
-
2024-10-11$180,000 Active
-
2019-10-28soldstatus $219,000
-
2011-08-01soldstatus $34,500
-
2011-07-18historical
-
2011-03-28$38,900
-
1992-01-17historical
-
1991-07-17$45,000
ⓘ Source: listings_history table (triggers on properties + properties_extension) + one-shot
backfill from property_details.listing_events for pre-trigger history.
Tax reassessment forecast OK · Resets to sale price
- Current annual tax
- $1,792 · $149/mo
- Projected year-2 tax
- $1,792 · $149/mo
- Expected delta
- $0/yr ($0/mo · 0.0%)
ⓘ Screening estimate from a state-policy table — verify with the county assessor before closing.
Climate risk First Street
- Flood 1/10 Low FEMA zone X (unshaded) · 0% chance over 30 yrs
- Wildfire 5/10 Major
- Heat 6/10 Major 7 d/yr ≥111°F today · 18 d/yr by 30 yrs out
- Wind 3/10 Moderate 4% chance of damaging wind over 30 yrs
- Air quality 3/10 Moderate 2 unhealthy d/yr today · 3 by 30 yrs out
Nearby sold comps map
Loading sold comps map…
Walkable amenities ~0.75 mi
Loading nearby amenities…
Taxation est. · year 1
- Rental income
- $18,153
- − Mortgage interest
- −$7,837
- − Property taxes
- −$1,792
- − Insurance
- −$700
- − Repairs & maintenance
- −$1,452
- − Management
- −$1,452
- − Depreciation
- −$4,070
- Taxable income
- $850
- Est. tax owed @ 24.0%
- −$204
- After-tax cash flow
- $2,841/yr
For passive investors: Depreciation is non-cash, so a rental often shows a tax loss while cash-flowing — sheltering income. Rental losses are passive: they offset passive income freely, and up to $25,000/yr can offset ordinary (W-2) income if you actively participate and your MAGI is under $100k (phasing out to $0 by $150k); unused losses carry forward. On sale, claimed depreciation is recaptured at up to 25%, and gains may owe capital-gains tax (a 1031 exchange can defer both). Figures are a year-1 estimate at your 24.0% rate — not tax advice; consult a CPA.
Schools (NCES district)
- District
- Tulsa
- NCES district ID
- 4030240
- Math proficiency
- 7% ▼ -9.00%
- Reading proficiency
- 12% ▼ -7.00%
- Median HH income
- $37,895
- Composite
- 8.04/100
- National rank
- #9919
- State rank
- #250 of 270 in OK
Livability — Tulsa
- Score
- 75/100
- State rank
- #13
- US rank
- #4058
Category grades
Schools grade is shown separately in the Schools card above.
Census & demographics
- Census place
- Tulsa, OK
- County
- Tulsa County · 640,811 people
- City population
- 389,418
- Metro
- Tulsa, OK
- Population (ZIP)
- 19,013
- Household income
- $53,505
- Rent vs Own
- Severe rent burden
- 667.0
Population outlook (Tulsa County) Hauer SSP2
- Today (2025)
- 723,846 people
- By 2030
- 766,033 · +5.8%
- By 2040
- 851,386 · +17.6%
- By 2050
- 938,389 · +29.6%
- By 2075
- 1,166,011 · +61.1%
- By 2100
- 1,350,277 · +86.5%
Race, ethnicity, and origin ACS 2023
- Neighborhood character
- Diverse neighborhood (Simpson 0.63)
- Race & ethnicity
- White 59% Two or more races 18% Hispanic / Latino 11% Black 8% Native American 6% Pacific Islander 2% Asian 1%
- Hispanic origin (detail)
- Mexican 8% Puerto Rican 1%
- Common ancestry
- Lithuanian 2% Slovak 2% Italian 1%
- Foreign-born
- 4% · Canada
- Languages at home
- 90% English-only · Spanish 7% Other Asian/Pacific 2%
Political lean MEDSL · Tulsa
- 2024 margin
- R (+15.2) · D 41.3% · R 56.5% · Other 2.2%
- 2008→2024 swing
- +9.2pp toward D · 2008: -24.5pp · 2024: -15.2pp
- All cycles
- 2024: R+15.2 2020: R+15.6 2016: R+22.9 2012: R+27.4 2008: R+24.5
Not yet ingested
- Civics
- —
Market trends
- HPI YoY
- ▼ -42.46%
- Current HPI
- 235.2296
- Rent YoY
- ▲ 0.78%
- Metro
- Tulsa, OK
- State GDP YoY
- ▲ 1.55%
- F500 in state
- 6
Industry mix (Fortune 500 HQ in OK)
| Industry | F500 HQs | Revenue |
|---|---|---|
| Energy | 3 | $48B |
|
||
Price history
+210.9% since first listed19 events — show timeline
- 2026-04-14 Pending — MLS Technology, Inc.
- 2026-02-28 Price Changed $139,900 MLS Technology, Inc.
- 2026-02-03 Listed $147,900 MLS Technology, Inc.
- 2026-01-30 Listing Removed — MLS Technology, Inc.
- 2025-12-05 Price Changed $148,000 MLS Technology, Inc.
- 2025-10-16 Listed $159,900 MLS Technology, Inc.
- 2025-10-10 Price Changed $159,900 MLS Technology, Inc.
- 2025-10-10 Listing Removed — MLS Technology, Inc.
- 2025-10-02 Price Changed $164,900 MLS Technology, Inc.
- 2025-08-19 Relisted — MLS Technology, Inc.
- 2025-06-23 Pending — MLS Technology, Inc.
- 2025-04-09 Price Changed $165,000 MLS Technology, Inc.
- 2024-10-11 Listed $180,000 MLS Technology, Inc.
- 2019-10-28 Sold (Public Records) $219,000 Public Records
- 2011-08-01 Sold (MLS) $34,500 MLS Technology, Inc.
- 2011-07-18 Listing Removed — MLS Technology, Inc.
- 2011-03-28 Listed $38,900 MLS Technology, Inc.
- 1992-01-17 Listing Removed — MLS Technology, Inc.
- 1991-07-17 Listed $45,000 MLS Technology, Inc.
Property tax history
+4.3%/yrLatest (2025): $1,792 · +8.7% YoY. Source: county tax records.
Cash-flow waterfall
monthlySold comps — $/sqft
last 12 mo · ≤1 miLoading sold comps…