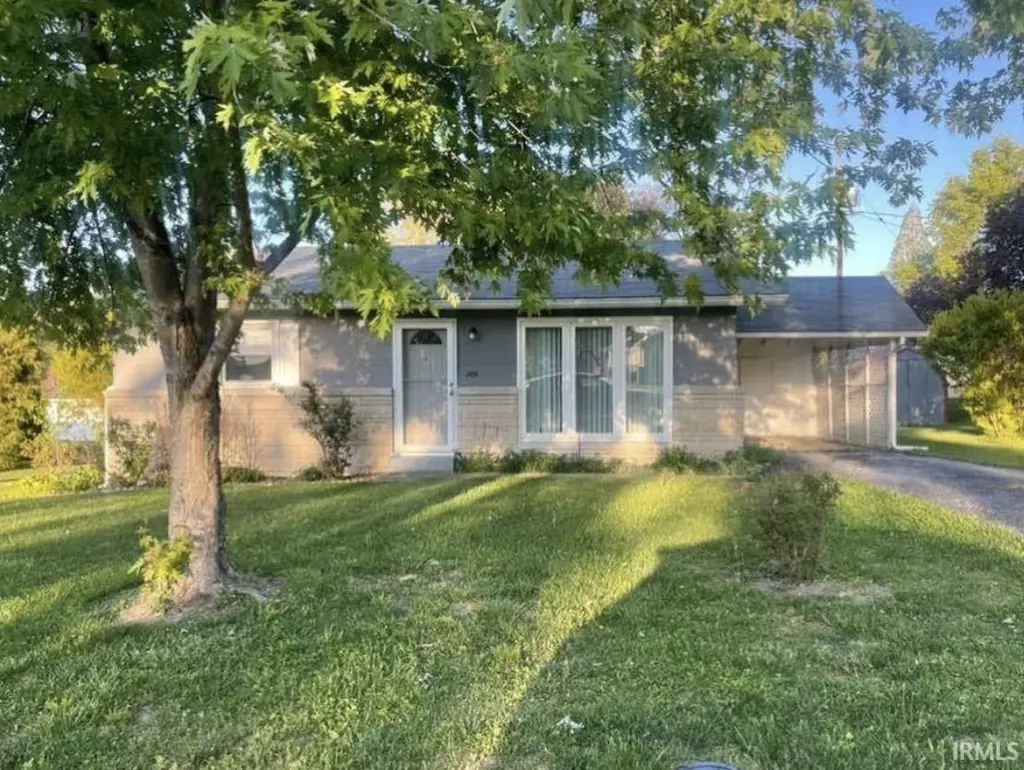
209 S Wallace St · Dale, IN
Flood risk 1/10 · Minimal
- FEMA flood zone
- X (unshaded)
- Chance of flooding over 30 yrs
- 0.0%
- Est. flood insurance / yr
- $507 – $1,088
Fire risk 1/10 · Minimal
- Est. fire insurance / yr
- $717 – $1,331
Heat risk 6/10 · Moderate
- Hot days now (above 106°F)
- 7 days/yr
- Hot days in 30 yrs
- 20 days/yr
Wind risk 2/10 · Minimal
- Chance of severe wind over 30 yrs
- 3.0%
Air-quality risk 3/10 · Minor
- Unhealthy air days now
- 2 days/yr
- Unhealthy air days in 30 yrs
- 5 days/yr
Risk factors via First Street. Map © Google.
Why this score? — see what drove the C- grade
The composite is a weighted blend of 9 inputs, each scored 0–100. Each bar is that input's sub-score; the figure is the points it added to the 100-point composite (weight × sub-score).
- Cash flow +15.8/30.0
- Appreciation +8.4/10.0
- ARV discount +7.5/15.0
- Schools +5.5/10.0
- DSCR +4.9/10.0
- 1% rule +3.8/10.0
- Livability +3.4/5.0
- Rent growth +2.5/5.0
- Condition / age +2.5/5.0
$150,000
🖨 Deal sheet 📄 Offer letter ✓ Due diligence
Listing remarks MLS
This charming ranch-style home is located in the peaceful town of Dale and is situated at 209 S Wallace. Boasting a cozy and inviting atmosphere, this home features two full bedrooms and one full bathroom, making it perfect for small families, couples, or individuals looking for a comfortable living space. Upon entering, you will immediately be impressed by the beautiful wood floors that adorn the home's interior, adding warmth and character to the space. Additionally, new carpeting has been recently installed, providing added comfort and style. The spacious kitchen offers ample room for preparing meals and all appliances included. Outside, you'll find a carport that provides convenient shelter for your vehicle, as well as a shed that offers additional storage space for tools, lawn equipment, or other items. The property also boasts a nice, level lot, perfect for outdoor activities or gardening. Overall, this cute ranch home is a must-see for anyone in the market for a comfortable and inviting living space in a quiet and peaceful location. Don't miss out on this fantastic opportunity!
Key facts
- 8,712 sq ft lot
- Built 1961
Neighborhood map
What this means for you Summary
Snapshot
- This is a 2-bed/1.0-bath single-family listed at $150k.
Deal economics
- At list price, monthly cash flow is $67 ($808/yr) — positive.
- The deal already cash-flows at list — no discount required.
- To meet the 1% rule (rent ≥ 1% of price), the offer needs to be $131k (12.5% below list).
- Recommended offer: $131k (12.5% below list) — sets the bar for 1% rule.
Location & tenants
- Location reads 68/100 on livability (#219 in IN) — a middle-class / working-renter tenant base. Strengths: crime A+, cost of living A+, housing A+; Watch: employment C-, health & safety C-, amenities F.
- North Spencer County School Corporation (rural): math 64% / reading 63% proficiency, ranked #12 of 301 in IN (top 4%) — acceptable for families but not a draw, mixed tenant base, ~2y average lease.
- Zoned schools: David Turnham Education Center (math 72% / reading 62%, grade B+, #55 of 994 statewide, top 6%, 300 students, 52% FRL); Heritage Hills Middle School (math 58% / reading 62%, grade B, #15 of 330 statewide, top 5%, 299 students, 34% FRL); Heritage Hills High School (math 52% / reading 77%, grade B-, #34 of 369 statewide, top 10%, 642 students, 34% FRL) — zoned schools average 40% FRL vs 23% district-wide (17 pts higher); higher-poverty schools than district average — tighter screening recommended.
- Market conditions: 11 active listings in the ZIP; 78 units permitted in Spencer County in 2024 (0 in 5+ unit buildings).
Forward outlook
- In year one you build about $11k of equity ($1k loan paydown + $10k appreciation (6.7% local appreciation)).
- Spencer County population projected at -16% by 2050 — secular population decline; favor cash flow + early exit over multi-decade hold.
- At projected returns (6.7% appreciation + 3.0% rent growth), your $42k cash investment doubles in ~4 years — after that, you're playing with house money.
- By year 4, paydown + projected appreciation supports a ~$38k cash-out refi (75% LTV) — recoverable capital for the next deal without selling this one.
Negotiation context
- Only 0 days on market — expect competitive offers; lowballing is unlikely to land.
- 3 sale attempts since 4y ago with the ask held roughly flat each time — persistent listings suggest the price (not the market) is what's stuck; bring a comps-based counter.
- Current owner paid $120k; 25% above their basis — modest negotiation headroom, anchor on the comps not their cost.
Risks & watch-outs
- Climate carrying-cost: extreme-heat days projected 7→20/yr by 2055 (HVAC capex compounding) — expect insurance premiums to compound above CPI over the hold.
Questions for the listing agent
- Built in 1961 — when were the roof, HVAC, electrical panel, plumbing, and water heater last replaced?
- Is there a deadline driving the sale (1031 exchange, divorce, estate, relocation)? That informs how much negotiation room exists.
- What's the average days-on-market for RENTAL listings here right now (not sales)? A rising rental-DOM trend means longer vacancies and softer asking-rent achievability than the comps imply.
- What's the recent tenant-quality profile in this submarket — average credit score on applications, eviction rate, late-payment / NSF rate, and stable-employment percentage? A property-management company in the area should have these aggregated.
- How much new for-sale + rental construction is in the pipeline within 1–3 miles? Heavy new supply typically softens prices + rents 12–24 months out; constrained supply supports both.
Investment metrics
- 1% rule
- 0.88% ✗
- Cap rate
- 6.83%
- Cash-on-cash
- 1.92%
- DSCR
- 1.09
- GRM
- 9.5
CMA / ARV
- ARV (on-the-fly)
- $97,536
- Comps found
- 1
Show comp detail 1 sale within ~0.75 mi
| Address | Dist | Beds/Ba | Sqft | Sold | Price | $/sf | Match |
|---|---|---|---|---|---|---|---|
| 101 S Washington St | 0.17mi | 2/1.0 | 876 (+14%) | 10mo | $111,000 | $127 | 60 |
Match score weights: distance 35% · size 25% · config 20% · recency 20%. Top-matched comps best support the ARV.
Projected returns pro-forma
6.74% appreciation · 3.0% rent growth · sell at horizon
- IRR
- 18.6%
- Equity multiple
- 2.29×
- Total profit
- $54,208
- Equity at exit
- $101,354
- IRR
- 17.9%
- Equity multiple
- 4.68×
- Total profit
- $154,600
- Equity at exit
- $190,223
Cash invested: $42,000 (down + closing). Projections, not guarantees.
Landlord ↔ Tenant lean methodology
- Overall (STATE)
- 90 Strongly Landlord-Friendly
- State Indiana
- 90 Strongly Landlord-Friendly · R+11
- County
- — inherits STATE
- City
- — inherits STATE
ZIP-level market 47523
- Home prices YoY
- 3.5%
- Active inventory
- 11
- Price-to-rent
- 9.5×
Monthly cashflow live
- Estimated rent
- $1,313 medium interval (Pro) →
- Mortgage (P&I)
- −$787
- Tax from tax record
- −$121 /mo · $1,449/yr
- Insurance
- −$62
- HOA
- −$0
- Vacancy / Maint / Mgmt
- −$276
- Net cashflow
- $67
Break-even live
UW: 25.0% down · 7.5% · 30yr · 1.5% tax · 5.0% vac · 8.0% maint · 8.0% mgmt
Financing live
Cash to close
- Down payment
- $37,500
- Closing costs
- $4,500
- Reserves months
- —
- Total cash needed
- —
Loan-product check · same deal, 3 products live
Conventional
25% down · 7.5% · 30yr
- Down + closing
- —
- Monthly P&I
- —
- Monthly cashflow
- —
- DSCR
- —
- Eligible?
- —
Personal DTI + credit; lowest rate.
DSCR
20% down · 8.5% · 30yr
- Down + closing
- —
- Monthly P&I
- —
- Monthly cashflow
- —
- DSCR
- —
- Eligible?
- —
No personal income docs; deal must DSCR.
Hard money
10% down · 12.0% · 12mo
- Down + closing
- —
- Monthly P&I
- —
- Monthly cashflow
- —
- DSCR
- —
- Eligible?
- —
Short-term bridge; refi at stabilization.
Listing history 2 events
-
2026-06-12remarks 185-char remark
-
2026-06-12$150,000 Pending
ⓘ Source: listings_history table (triggers on properties + properties_extension) + one-shot
backfill from property_details.listing_events for pre-trigger history.
Tax reassessment forecast IN · Partial reset (capped growth)
- Current annual tax
- $1,449 · $121/mo
- Projected year-2 tax
- $1,449 · $121/mo
- Expected delta
- $0/yr ($0/mo · 0.0%)
ⓘ Screening estimate from a state-policy table — verify with the county assessor before closing.
Climate risk First Street
- Flood 1/10 Low FEMA zone X (unshaded) · 0% chance over 30 yrs
- Wildfire 1/10 Low
- Heat 6/10 Major 7 d/yr ≥106°F today · 20 d/yr by 30 yrs out
- Wind 2/10 Low 3% chance of damaging wind over 30 yrs
- Air quality 3/10 Moderate 2 unhealthy d/yr today · 5 by 30 yrs out
Nearby sold comps map
Loading sold comps map…
Walkable amenities ~0.75 mi
Loading nearby amenities…
Taxation est. · year 1
- Rental income
- $15,754
- − Mortgage interest
- −$8,402
- − Property taxes
- −$1,449
- − Insurance
- −$750
- − Repairs & maintenance
- −$1,260
- − Management
- −$1,260
- − Depreciation
- −$4,364
- Taxable loss
- −$1,731
- Est. tax savings @ 24.0%
- +$416
- After-tax cash flow
- $1,223/yr
For passive investors: Depreciation is non-cash, so a rental often shows a tax loss while cash-flowing — sheltering income. Rental losses are passive: they offset passive income freely, and up to $25,000/yr can offset ordinary (W-2) income if you actively participate and your MAGI is under $100k (phasing out to $0 by $150k); unused losses carry forward. On sale, claimed depreciation is recaptured at up to 25%, and gains may owe capital-gains tax (a 1031 exchange can defer both). Figures are a year-1 estimate at your 24.0% rate — not tax advice; consult a CPA.
Schools (NCES district)
- District
- North Spencer County School Corporation
- NCES district ID
- 1808010
- Math proficiency
- 64% ▼ -7.00%
- Reading proficiency
- 63% ▼ -6.00%
- Median HH income
- $58,055
- Composite
- 54.76/100
- National rank
- #1318
- State rank
- #12 of 301 in IN
Livability — Dale
- Score
- 68/100
- State rank
- #219
- US rank
- #9557
Category grades
Schools grade is shown separately in the Schools card above.
Census & demographics
- Census place
- Dale, IN
- Population (ZIP)
- 3,518
Population outlook (Spencer County) Hauer SSP2
- Today (2025)
- 20,394 people
- By 2030
- 19,912 · -2.4%
- By 2040
- 18,592 · -8.8%
- By 2050
- 17,051 · -16.4%
- By 2075
- 14,010 · -31.3%
- By 2100
- 10,869 · -46.7%
Race, ethnicity, and origin ACS 2023
- Neighborhood character
- Predominantly White (87%)
- Race & ethnicity
- White 87% Hispanic / Latino 12% Two or more races 4%
- Hispanic origin (detail)
- Mexican 11%
- Common ancestry
- Lithuanian 1% Iranian 1% Romanian 1%
- Foreign-born
- 6% · Canada
- Languages at home
- 90% English-only · Spanish 10%
Political lean MEDSL · Spencer
- 2024 margin
- Solid R (+43.3) · D 27.4% · R 70.6% · Other 2.0%
- 2008→2024 swing
- -43.6pp toward R · 2008: 0.4pp · 2024: -43.3pp
- All cycles
- 2024: R+43.3 2020: R+38.5 2016: R+37.3 2012: R+15.3 2008: D+0.4
Not yet ingested
- Civics
- —
Market trends
- HPI YoY
- ▲ 6.74%
- Current HPI
- 200.352
- Rent YoY
- —
- Metro
- —
- State GDP YoY
- ▲ 2.90%
- F500 in state
- 18
Industry mix (Fortune 500 HQ in IN)
| Industry | F500 HQs | Revenue |
|---|---|---|
| Industrial Machinery | 2 | $37B |
|
||
| Healthcare | 1 | $177B |
|
||
| Pharmaceuticals | 1 | $45B |
|
||
| Metals / Steel | 1 | $18B |
|
||
| Agriculture | 1 | $17B |
|
||
| Packaging | 1 | $12B |
|
||
Price history
+43.0% since first listed8 events — show timeline
- 2026-06-09 Listed $150,000 IRMLS
- 2026-06-09 Delisted — IRMLS
- 2023-05-31 Sold (MLS) $120,000 IRMLS
- 2023-05-07 Pending — IRMLS
- 2023-05-03 Listed $115,000 IRMLS
- 2022-11-04 Sold (MLS) $100,000 IRMLS
- 2022-10-06 Pending — IRMLS
- 2022-09-29 Listed $104,900 IRMLS
Property tax history
+19.8%/yrLatest (2024): $1,449 · +9.7% YoY. Source: county tax records.
Cash-flow waterfall
monthlySold comps — $/sqft
last 12 mo · ≤1 miLoading sold comps…