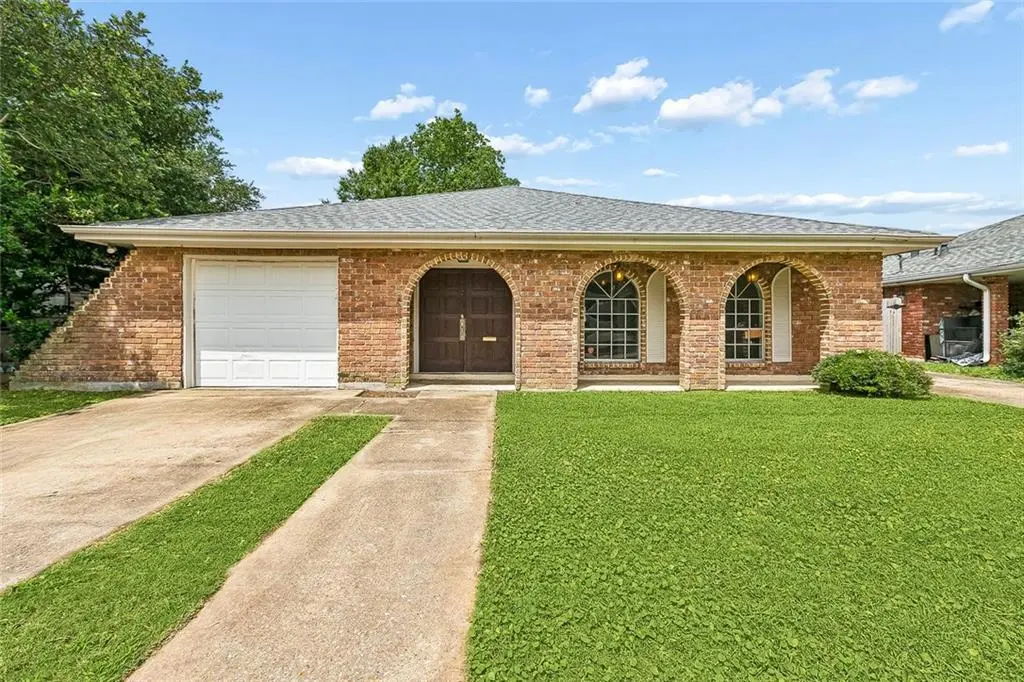
4512 Wilson Dr · Metairie, LA
Flood risk 8/10 · Major
- FEMA flood zone
- X
- Chance of flooding over 30 yrs
- 0.6%
- Est. flood insurance / yr
- $507 – $1,088
Fire risk 1/10 · Minimal
- Est. fire insurance / yr
- $1,269 – $2,357
Heat risk 10/10 · Severe
- Hot days now (above 108°F)
- 7 days/yr
- Hot days in 30 yrs
- 21 days/yr
Wind risk 10/10 · Severe
- Chance of severe wind over 30 yrs
- 99.0%
Air-quality risk 3/10 · Minor
- Unhealthy air days now
- 2 days/yr
- Unhealthy air days in 30 yrs
- 3 days/yr
Risk factors via First Street. Map © Google.
Why this score? — see what drove the D- grade
The composite is a weighted blend of 9 inputs, each scored 0–100. Each bar is that input's sub-score; the figure is the points it added to the 100-point composite (weight × sub-score).
- Cash flow +14.7/30.0
- DSCR +4.5/10.0
- Livability +4.4/5.0
- ARV discount +3.9/15.0
- 1% rule +3.7/10.0
- Rent growth +3.0/5.0
- Schools +2.5/10.0
- Condition / age +2.5/5.0
- Appreciation +0.0/10.0
$259,500
🖨 Deal sheet 📄 Offer letter ✓ Due diligence
Listing remarks MLS
<br><br> The sunroom features a wood-burning fireplace and overlooks the backyard pool area, creating a great flex space for relaxing, entertaining, or future customization. Outside, you'll find both a pool and grassy yard space, giving you the best of both worlds. <br><br> Additional features include two separate driveways, rear yard vehicle access, a covered carport, indoor laundry, and a one-car garage. Located in an X flood zone and just a short distance from a neighborhood playground. <br><br> This sturdy brick home is ready for its next owner to bring their vision and make it their dream home!
Key facts
- Gas cooktop
- Open floor plan
- Double front doors
Tags
Property features AI
Finance
- Other: In-ground pool
Exterior
- Parking: Driveway; Garage with garage door opener
- Utilities: Public water; Public sewer
- Home design: One-story; Average condition
- Construction: Brick construction; Shingle roof; Slab foundation; Built with average condition
- Exterior features: Concrete patio/porch; Fence; City lot; Rectangular lot; Lot dimensions approximately 60 x 106
Interior
- Kitchen: Cooktop; Oven; Dishwasher
- Bedrooms: Total rooms: 5
- Bathrooms: 2 full bathrooms
- Heating & cooling: Central heating; Central air conditioning
- Interior features: Attic; Pantry; Pull-down attic stairs; Wood-burning fireplace
- Laundry & utility: Washer hookup; Dryer hookup
Neighborhood map
What this means for you Summary
Snapshot
- This is a 3-bed/2.0-bath single-family listed at $260k.
Deal economics
- At list price, monthly cash flow is $2 ($20/yr) — positive.
- The deal already cash-flows at list — no discount required.
- To meet the 1% rule (rent ≥ 1% of price), the offer needs to be $226k (13.0% below list).
- Recommended offer: $226k (13.0% below list) — sets the bar for 1% rule.
- Cap rate 6.6% vs local median 3.6% in Metairie — top-decile yield for the area; either an underpriced asset or a hidden risk that comps aren't pricing in. Stress-test before assuming the spread holds.
Location & tenants
- Location reads 87/100 on livability (#1 in LA, #261 nationally) — a professional / high-income tenant draw. Strengths: commute A+, housing A+, health & safety A+.
- Jefferson Parish (suburban): math 24% / reading 34% proficiency, ranked #44 of 98 in LA (top 45%) — low school quality limits family demand, transient renter base, plan for 1-2y turnover; 70% free/reduced lunch — lower-income household profile, screen leases tightly.
- Market conditions: Rents rising (+2.1%/yr); 224 active listings in the ZIP; 32 comparable units currently listed for rent nearby; rentals at typical pace (median 24d on market — plan ~3-4 weeks tenant-placement turnaround); solid renter incomes; 518 units permitted in Jefferson Parish in 2024 (43 in 5+ unit buildings).
- This rent runs 36% of the median local income ($76k/yr) — at the standard rent-burdened threshold; future hikes will face affordability resistance.
Forward outlook
- Local home prices are declining (-3.0%/yr); year-one equity from $2k of loan paydown is wiped out by about $8k of value loss. Plan a longer hold.
Negotiation context
- Only 6 days on market — expect competitive offers; lowballing is unlikely to land.
- 5 sale attempts since 19y ago with the ask held roughly flat each time — persistent listings suggest the price (not the market) is what's stuck; bring a comps-based counter.
- Current owner paid $217k; 20% above their basis — modest negotiation headroom, anchor on the comps not their cost.
Risks & watch-outs
- Watch-outs: flood insurance adds $66/mo.
- Climate carrying-cost: severe flood risk; severe wind risk, 99% chance of damaging wind over 30y; extreme-heat days projected 7→21/yr by 2055 (HVAC capex compounding) — expect insurance premiums to compound above CPI over the hold.
Questions for the listing agent
- Built in 1973 — when were the roof, HVAC, electrical panel, plumbing, and water heater last replaced?
- What's the actual annual flood-insurance premium (NFIP or private), and is the property in a SFHA with mandatory coverage?
- Is there a deadline driving the sale (1031 exchange, divorce, estate, relocation)? That informs how much negotiation room exists.
- Schools are B-rated — typically a magnet for longer-tenancy family renters. What's the average tenant stay here, and is there a school-zone premium baked into asking?
- The area grade is low — what's the realistic commute time and amenity access for the typical tenant pool here? Any planned neighborhood developments (good or bad) we should know about?
- What's the average days-on-market for RENTAL listings here right now (not sales)? A rising rental-DOM trend means longer vacancies and softer asking-rent achievability than the comps imply.
- What's the recent tenant-quality profile in this submarket — average credit score on applications, eviction rate, late-payment / NSF rate, and stable-employment percentage? A property-management company in the area should have these aggregated.
- How much new for-sale + rental construction is in the pipeline within 1–3 miles? Heavy new supply typically softens prices + rents 12–24 months out; constrained supply supports both.
Investment metrics
- 1% rule
- 0.87% ✗
- Cap rate
- 6.61%
- Cash-on-cash
- 1.12%
- DSCR
- 1.05
- GRM
- 9.6
CMA / ARV
- ARV (on-the-fly)
- $240,384
- Comps found
- 12
Show comp detail 12 sales within ~0.75 mi
| Address | Dist | Beds/Ba | Sqft | Sold | Price | $/sf | Match |
|---|---|---|---|---|---|---|---|
| 4813 Academy Dr | 0.17mi | 3/2.5 | 1,990 (+6%) | 0mo | $186,000 | $93 | 80 |
| 4908 Pike Dr | 0.49mi | 3/2.0 | 1,931 (+3%) | 1mo | $247,500 | $128 | 71 |
| 4709 Senac Dr | 0.37mi | 3/2.0 | 1,720 (-8%) | 2mo | $220,000 | $128 | 67 |
| 4513 St Mary St | 0.68mi | 3/2.0 | 1,817 (-3%) | 1mo | $340,000 | $187 | 62 |
| 4917 Pike Dr | 0.48mi | 3/2.0 | 1,705 (-9%) | 3mo | $395,000 | $232 | 59 |
| 3812 Bissonet Dr | 0.66mi | 3/2.0 | 1,765 (-6%) | 0mo | $310,500 | $176 | 59 |
| 7013 Wilty St | 0.48mi | 4/2.0 (+1) | 2,036 (+8%) | 1mo | $255,000 | $125 | 58 |
| 6409 Glendale St | 0.34mi | 3/2.0 | 1,599 (-15%) | 3mo | $114,500 | $72 | 57 |
| 4512 Wade St | 0.36mi | 4/2.0 (+1) | 2,105 (+12%) | 2mo | $263,000 | $125 | 56 |
| 3505 Lake Trail Dr | 0.74mi | 3/2.0 | 1,788 (-5%) | 2mo | $360,000 | $201 | 56 |
| 3312 Lake Trail Dr | 0.70mi | 3/2.0 | 1,760 (-6%) | 2mo | $270,000 | $153 | 56 |
| 7101 Ithaca St | 0.58mi | 3/2.0 | 1,670 (-11%) | 1mo | $143,100 | $86 | 54 |
Match score weights: distance 35% · size 25% · config 20% · recency 20%. Top-matched comps best support the ARV.
Projected returns pro-forma
-3.0% appreciation · 2.15% rent growth · sell at horizon
- IRR
- -17.2%
- Equity multiple
- 0.40×
- Total profit
- $-43,833
- Equity at exit
- $38,692
- IRR
- -10.8%
- Equity multiple
- 0.37×
- Total profit
- $-45,647
- Equity at exit
- $22,437
Cash invested: $72,660 (down + closing). Projections, not guarantees.
Landlord ↔ Tenant lean methodology
- Overall (STATE)
- 90 Strongly Landlord-Friendly
- State Louisiana
- 90 Strongly Landlord-Friendly · R+12
- County
- — inherits STATE
- City
- — inherits STATE
ZIP-level market 70003
- Rents YoY
- 2.1%
- Active inventory
- 224
- Price-to-rent
- 9.6×
Monthly cashflow live
- Estimated rent
- $2,258 high interval (Pro) →
- Mortgage (P&I)
- −$1,361
- Tax from tax record
- −$247 /mo · $2,958/yr
- Insurance
- −$108
- Flood insurance flood zone
- −$66 /mo · $798/yr
- HOA
- −$0
- Vacancy / Maint / Mgmt
- −$474
- Net cashflow
- $2
Break-even live
UW: 25.0% down · 7.5% · 30yr · 1.5% tax · 5.0% vac · 8.0% maint · 8.0% mgmt
Financing live
Cash to close
- Down payment
- $64,875
- Closing costs
- $7,785
- Reserves months
- —
- Total cash needed
- —
Loan-product check · same deal, 3 products live
Conventional
25% down · 7.5% · 30yr
- Down + closing
- —
- Monthly P&I
- —
- Monthly cashflow
- —
- DSCR
- —
- Eligible?
- —
Personal DTI + credit; lowest rate.
DSCR
20% down · 8.5% · 30yr
- Down + closing
- —
- Monthly P&I
- —
- Monthly cashflow
- —
- DSCR
- —
- Eligible?
- —
No personal income docs; deal must DSCR.
Hard money
10% down · 12.0% · 12mo
- Down + closing
- —
- Monthly P&I
- —
- Monthly cashflow
- —
- DSCR
- —
- Eligible?
- —
Short-term bridge; refi at stabilization.
Rent comps 32 comps
| Address | Beds | Baths | Sqft | Rent | $/sqft | DOM | Units | Dist |
|---|---|---|---|---|---|---|---|---|
| 4837 Academy Dr Metairie, LA | 3.0 | 2.0 | 1834 | $3,000 | $1.64 | 23d | 1 | 0.23mi |
| 4312 Tartan Dr Metairie, LA | 4.0 | 2.0 | 1500 | $2,150 | $1.43 | 23d | 1 | 0.28mi |
| 4908 Purdue Dr Metairie, LA | 4.0 | 2.0 | 1846 | $1,995 | $1.08 | 4d | 1 | 0.29mi |
| 6301 Wilty St Metairie, LA | 3.0 | 2.0 | 1340 | $2,000 | $1.49 | 3d | 1 | 0.30mi |
| 6508 Wilty St Metairie, LA | 3.0 | 2.0 | 1300 | $2,000 | $1.54 | 23d | 1 | 0.33mi |
| 6501 Ithaca St Metairie, LA | 3.0 | 2.0 | 2400 | $2,900 | $1.21 | 44d | 1 | 0.43mi |
| 7116 Wilty St Metairie, LA | 3.0 | 2.0 | 1722 | $2,300 | $1.34 | 4d | 1 | 0.56mi |
| 4112 Henican Pl Metairie, LA | 3.0 | 2.0 | 1750 | $2,000 | $1.14 | 23d | 1 | 0.61mi |
| 6217 Leslie St Metairie, LA | 3.0 | 1.0 | 1300 | $1,800 | $1.38 | 44d | 1 | 0.66mi |
| 4409 Saint Martin St Metairie, LA | 3.0 | 2.0 | 1576 | $2,100 | $1.33 | 44d | 1 | 0.69mi |
| 3600 Lake Trail Dr Kenner, LA | 4.0 | 2.5 | 2600 | $2,800 | $1.08 | 4d | 1 | 0.74mi |
| 2 Schill Ave Kenner, LA | 4.0 | 2.0 | 2026 | $2,500 | $1.23 | 4d | 1 | 0.75mi |
| 3908 Page Dr Metairie, LA | 3.0 | 1.5 | 1470 | $1,850 | $1.26 | 44d | 1 | 0.80mi |
| 3224 Massachusetts Ave Kenner, LA | 4.0 | 2.0 | 2070 | $2,750 | $1.33 | 1d | 1 | 0.81mi |
| 4416 Barnett St Unit B Metairie, LA | 3.0 | 3.5 | 1700 | $2,000 | $1.18 | 21d | 1 | 0.83mi |
| 5104 W Esplanade Ave Metairie, LA | 3.0 | 2.0 | 1455 | $1,675 | $1.15 | 44d | 1 | 0.84mi |
| 4404 Barnett St Unit C Metairie, LA | 3.0 | 3.5 | 1700 | $2,100 | $1.24 | 23d | 1 | 0.84mi |
| 13 Emile Ave Kenner, LA | 3.0 | 3.0 | 2100 | $2,300 | $1.10 | 23d | 1 | 0.90mi |
| 6801 Veterans Blvd Metairie, LA | 1.0–3.0 | 1.0–2.0 | 985 | $1,701 | $1.73 | 1d | 27 | 1.03mi |
| 4401 Sonfield St Unit C Metairie, LA | 4.0 | 3.0 | 1300 | $1,800 | $1.38 | 44d | 1 | 1.14mi |
| 4401 Sonfield St Unit D Metairie, LA | 3.0 | 3.0 | 1300 | $1,500 | $1.15 | 44d | 1 | 1.14mi |
| 4422 Lake Vista Dr Metairie, LA | 2.0 | 2.5 | 2500 | $2,900 | $1.16 | 23d | 1 | 1.15mi |
| 61 Emile Ave Kenner, LA | 3.0 | 2.0 | 1450 | $1,900 | $1.31 | 44d | 1 | 1.18mi |
| 5029 Loveland St Metairie, LA | 3.0 | 2.0 | 2100 | $2,500 | $1.19 | 4d | 1 | 1.23mi |
| 3245 Iowa Ave Kenner, LA | 4.0 | 2.0 | 1800 | $2,300 | $1.28 | 21d | 1 | 1.24mi |
| 3101 Kansas Ave Kenner, LA | 3.0 | 2.0 | 1500 | $2,000 | $1.33 | 14d | 1 | 1.28mi |
| 53 Antigua Dr Unit D Kenner, LA | 2.0 | 1.5 | 1325 | $1,500 | $1.13 | 23d | 1 | 1.28mi |
| 3816 Lemon St Metairie, LA | 3.0 | 2.0 | 2200 | $2,500 | $1.14 | 23d | 1 | 1.35mi |
| 4401 Laudun St Metairie, LA | 4.0 | 2.5 | 2077 | $2,500 | $1.20 | 4d | 1 | 1.37mi |
| 4400 Lefkoe St Metairie, LA | 3.0 | 2.0 | 1822 | $2,200 | $1.21 | 14d | 1 | 1.45mi |
| 2921 Indiana Ave Unit 3 Kenner, LA | 2.0 | 1.5 | 1300 | $1,395 | $1.07 | 3d | 1 | 1.45mi |
| 4318 Lime St Metairie, LA | 3.0 | 2.5 | 1766 | $1,700 | $0.96 | 23d | 1 | 1.47mi |
Listing history 8 events
-
2026-05-20$259,500 Active
Show marketing remark (606 chars)
<br><br> The sunroom features a wood-burning fireplace and overlooks the backyard pool area, creating a great flex space for relaxing, entertaining, or future customization. Outside, you'll find both a pool and grassy yard space, giving you the best of both worlds. <br><br> Additional features include two separate driveways, rear yard vehicle access, a covered carport, indoor laundry, and a one-car garage. Located in an X flood zone and just a short distance from a neighborhood playground. <br><br> This sturdy brick home is ready for its next owner to bring their vision and make it their dream home!
-
2026-05-20$259,500 Active 606-char remark
Show marketing remark (606 chars)
<br><br> The sunroom features a wood-burning fireplace and overlooks the backyard pool area, creating a great flex space for relaxing, entertaining, or future customization. Outside, you'll find both a pool and grassy yard space, giving you the best of both worlds. <br><br> Additional features include two separate driveways, rear yard vehicle access, a covered carport, indoor laundry, and a one-car garage. Located in an X flood zone and just a short distance from a neighborhood playground. <br><br> This sturdy brick home is ready for its next owner to bring their vision and make it their dream home!
-
2025-03-15$365,000 Active
-
2007-06-25soldstatus $217,000
-
2007-06-20soldstatus $217,000
-
2007-04-30$239,500
-
2007-04-30$239,500
-
1987-05-01soldstatus $102,000
ⓘ Source: listings_history table (triggers on properties + properties_extension) + one-shot
backfill from property_details.listing_events for pre-trigger history.
Tax reassessment forecast LA · Resets to sale price
- Current annual tax
- $2,958 · $247/mo
- Projected year-2 tax
- $2,958 · $247/mo
- Expected delta
- $0/yr ($0/mo · 0.0%)
ⓘ Screening estimate from a state-policy table — verify with the county assessor before closing.
Climate risk First Street
- Flood 8/10 Severe FEMA zone X · 60% chance over 30 yrs
- Wildfire 1/10 Low
- Heat 10/10 Extreme 7 d/yr ≥108°F today · 21 d/yr by 30 yrs out
- Wind 10/10 Extreme 99% chance of damaging wind over 30 yrs
- Air quality 3/10 Moderate 2 unhealthy d/yr today · 3 by 30 yrs out
Nearby sold comps map
Loading sold comps map…
Walkable amenities ~0.75 mi
Loading nearby amenities…
Taxation est. · year 1
- Rental income
- $27,093
- − Mortgage interest
- −$14,536
- − Property taxes
- −$2,958
- − Insurance
- −$2,095
- − Repairs & maintenance
- −$2,167
- − Management
- −$2,167
- − Depreciation
- −$7,549
- Taxable loss
- −$4,380
- Est. tax savings @ 24.0%
- +$1,051
- After-tax cash flow
- $1,071/yr
For passive investors: Depreciation is non-cash, so a rental often shows a tax loss while cash-flowing — sheltering income. Rental losses are passive: they offset passive income freely, and up to $25,000/yr can offset ordinary (W-2) income if you actively participate and your MAGI is under $100k (phasing out to $0 by $150k); unused losses carry forward. On sale, claimed depreciation is recaptured at up to 25%, and gains may owe capital-gains tax (a 1031 exchange can defer both). Figures are a year-1 estimate at your 24.0% rate — not tax advice; consult a CPA.
Schools (NCES district)
- District
- Jefferson Parish
- NCES district ID
- 2200840
- Math proficiency
- 24% ▼ -36.00%
- Reading proficiency
- 34% ▼ -30.00%
- Median HH income
- $48,421
- Composite
- 25.19/100
- National rank
- #7511
- State rank
- #44 of 98 in LA
Livability — Metairie
- Score
- 87/100
- State rank
- #1
- US rank
- #261
Category grades
Schools grade is shown separately in the Schools card above.
Census & demographics
- Census place
- Metairie, LA
- County
- Jefferson Parish · 426,999 people
- City population
- 137,978
- Metro
- New Orleans-Metairie, LA
- Population (ZIP)
- 39,344
- Household income
- $76,261
- Rent vs Own
- Severe rent burden
- 710.0
Population outlook (Jefferson County) Hauer SSP2
- Today (2025)
- 451,696 people
- By 2030
- 455,451 · +0.8%
- By 2040
- 458,308 · +1.5%
- By 2050
- 461,031 · +2.1%
- By 2075
- 476,351 · +5.5%
- By 2100
- 499,377 · +10.6%
Race, ethnicity, and origin ACS 2023
- Neighborhood character
- Predominantly White (65%)
- Race & ethnicity
- White 65% Hispanic / Latino 19% Two or more races 12% Black 8% Asian 5%
- Hispanic origin (detail)
- Mexican 3% Cuban 1%
- Common ancestry
- Lithuanian 12% Scotch-Irish 1% Slovak 1%
- Foreign-born
- 14% · Canada, Vietnam, China
- Languages at home
- 81% English-only · Spanish 12% Other Indo-European 3% Arabic 1%
Political lean MEDSL · Jefferson
- 2024 margin
- R (+12.9) · D 42.5% · R 55.5% · Other 2.1%
- 2008→2024 swing
- +13.6pp toward D · 2008: -26.6pp · 2024: -12.9pp
- All cycles
- 2024: R+12.9 2020: R+11.1 2016: R+14.8 2012: R+18.4 2008: R+26.6
Not yet ingested
- Civics
- —
Market trends
- HPI YoY
- ▼ -252.03%
- Current HPI
- 138.5632
- Rent YoY
- ▲ 2.15%
- Metro
- New Orleans-Metairie, LA
- State GDP YoY
- ▲ 3.29%
- F500 in state
- 10
Industry mix (Fortune 500 HQ in LA)
| Industry | F500 HQs | Revenue |
|---|---|---|
| Telecommunications | 2 | $23B |
|
||
| Utilities | 1 | $12B |
|
||
| Wholesale / Distribution | 1 | $5B |
|
||
| Advertising | 1 | $2B |
|
||
Price history
+154.4% since first listed8 events — show timeline
- 2026-05-20 Listed $259,500 AcadianaMLS
- 2026-05-20 Listed $259,500 GSREIN
- 2025-03-15 Listed $365,000 AcadianaMLS
- 2007-06-25 Sold (Public Records) $217,000 Public Records
- 2007-06-20 Sold (MLS) $217,000 GSREIN
- 2007-04-30 Listed $239,500 GSREIN
- 2007-04-30 Listed $239,500 AcadianaMLS
- 1987-05-01 Sold (Public Records) $102,000 Public Records
Property tax history
+1.7%/yrLatest (2025): $2,958 · +0.2% YoY. Source: county tax records.
Cash-flow waterfall
monthlySold comps — $/sqft
last 12 mo · ≤1 miLoading sold comps…