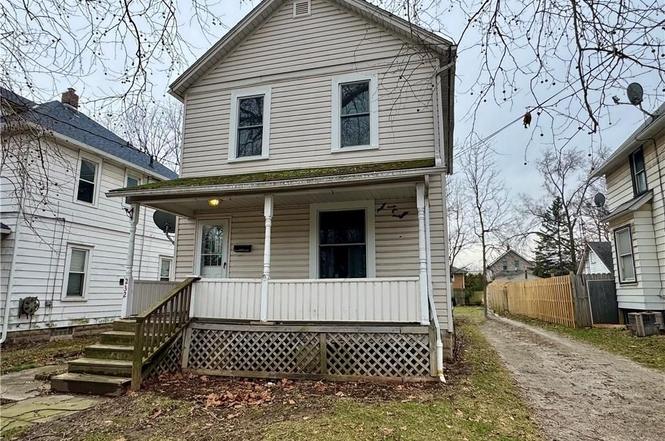
232 W River Rd N · Elyria, OH
Flood risk 1/10 · Minimal
- FEMA flood zone
- X (unshaded)
- Chance of flooding over 30 yrs
- 0.0%
- Est. flood insurance / yr
- $473 – $860
Fire risk 1/10 · Minimal
- Est. fire insurance / yr
- $713 – $1,323
Heat risk 3/10 · Minor
- Hot days now (above 98°F)
- 7 days/yr
- Hot days in 30 yrs
- 16 days/yr
Wind risk 1/10 · Minimal
- Chance of severe wind over 30 yrs
- —
Air-quality risk 3/10 · Minor
- Unhealthy air days now
- 2 days/yr
- Unhealthy air days in 30 yrs
- 4 days/yr
Risk factors via First Street. Map © Google.
Why this score? — see what drove the D- grade
The composite is a weighted blend of 9 inputs, each scored 0–100. Each bar is that input's sub-score; the figure is the points it added to the 100-point composite (weight × sub-score).
- Cash flow +15.7/30.0
- DSCR +4.8/10.0
- 1% rule +4.2/10.0
- Rent growth +4.2/5.0
- Livability +3.8/5.0
- Condition / age +2.5/5.0
- Schools +2.4/10.0
- ARV discount +1.3/15.0
- Appreciation +0.0/10.0
$120,000
🖨 Deal sheet (PDF) 📄 Offer letter ✓ Due diligence
Listing remarks MLS
Lovely home! Move-in condition! Hardwood in living and dining rooms; vinyl in kitchen. Second level has newer carpet. Backyard with deck and utility shed. Great front porch to relax on! Come and see your new home! New roof 2008; new hot water heater 2009.
Key facts
- Updated panel
- Updated baths
- Large front porch
Tags
Neighborhood map
What this means for you Summary
Snapshot
- This is a 3-bed/1.5-bath single-family listed at $120k.
Deal economics
- At list price, monthly cash flow is $53 ($638/yr) — positive.
- The deal already cash-flows at list — no discount required.
- To meet the 1% rule (rent ≥ 1% of price), the offer needs to be $111k (7.7% below list).
- Recommended offer: $106k (12.0% below list) — sets the bar for market timing.
- Cap rate 6.8% vs local median 4.0% in Elyria — top-decile yield for the area; either an underpriced asset or a hidden risk that comps aren't pricing in. Stress-test before assuming the spread holds.
Location & tenants
- Location reads 75/100 on livability (#243 in OH, #3,869 nationally) — a middle-class / working-renter tenant base. Strengths: cost of living A+, housing A+, health & safety A; Watch: employment D, commute F.
- Elyria City Schools (urban): math 21% / reading 37% proficiency, ranked #586 of 656 in OH (top 89%) — low school quality limits family demand, transient renter base, plan for 1-2y turnover.
- Zoned schools: Hamilton Elementary School (math 8% / reading 17%, grade F, #1,434 of 1,584 statewide, top 92%, 421 students, 90% FRL); Eastern Heights Middle School (math 15% / reading 29%, grade F, #602 of 654 statewide, top 93%, 579 students, 100% FRL); Elyria High School (math 20% / reading 47%, grade F, #598 of 781 statewide, top 77%, 1,639 students, 62% FRL) — zoned schools average 84% FRL vs 58% district-wide (26 pts higher); higher-poverty schools than district average — tighter screening recommended.
- Market conditions: Rents rising fast (+6.7%/yr); 359 active listings in the ZIP; 8 comparable units currently listed for rent nearby; rentals at typical pace (median 19d on market — plan ~3-4 weeks tenant-placement turnaround); 1,098 units permitted in Lorain County in 2024 (20 in 5+ unit buildings).
Forward outlook
- Local home prices are declining (-3.0%/yr); year-one equity from $830 of loan paydown is wiped out by about $4k of value loss. Plan a longer hold.
Negotiation context
- It's been on market 146 days — a 12% lower offer ($106k) is reasonable based on typical stale-listing flexibility.
- 6 sale attempts since 24y ago; this cycle's ask has dropped $15k (11%) from the opening price — seller is motivated, your offer sets the floor, not the list.
- Current owner paid $18k; list at $120k implies a 561% gain — meaningful room to come down on a strong offer.
Risks & watch-outs
- Watch-outs: built in 1900 — expect roof / HVAC / electrical / plumbing capex.
Questions for the listing agent
- It's been on market 146 days. Have you received any prior offers? Is the seller open to a 12% concession, seller financing, or rate buy-down credit?
- Built in 1900 — when were the roof, HVAC, electrical panel, plumbing, and water heater last replaced?
- Why hasn't it sold? Are there any deal-killer items the seller is aware of (foundation, flood, title, zoning, code violations)?
- Is there a deadline driving the sale (1031 exchange, divorce, estate, relocation)? That informs how much negotiation room exists.
- The area grade is low — what's the realistic commute time and amenity access for the typical tenant pool here? Any planned neighborhood developments (good or bad) we should know about?
- What's the average days-on-market for RENTAL listings here right now (not sales)? A rising rental-DOM trend means longer vacancies and softer asking-rent achievability than the comps imply.
- What's the recent tenant-quality profile in this submarket — average credit score on applications, eviction rate, late-payment / NSF rate, and stable-employment percentage? A property-management company in the area should have these aggregated.
- How much new for-sale + rental construction is in the pipeline within 1–3 miles? Heavy new supply typically softens prices + rents 12–24 months out; constrained supply supports both.
Investment metrics
- 1% rule
- 0.92% ✗
- Cap rate
- 6.82%
- Cash-on-cash
- 1.90%
- DSCR
- 1.08
- GRM
- 9.0
CMA / ARV
- ARV (on-the-fly)
- $105,400
- Comps found
- 12
Show comp detail 12 sales within ~0.75 mi
| Address | Dist | Beds/Ba | Sqft | Sold | Price | $/sf | Match |
|---|---|---|---|---|---|---|---|
| 447 W River Rd | 0.35mi | 3/1.0 | 1,241 (+0%) | 17mo | $105,000 | $85 | 67 |
| 3 Henkle Ct | 0.16mi | 3/1.0 | 1,188 (-4%) | 20mo | $41,000 | $35 | 67 |
| 6112 Gateway Blvd S | 0.11mi | 3/1.0 | 1,056 (-15%) | 7mo | $118,000 | $112 | 62 |
| 227 7th St | 0.74mi | 3/1.0 | 1,202 (-3%) | 10mo | $71,500 | $59 | 50 |
| 469 11th St | 0.73mi | 3/1.0 | 1,210 (-2%) | 15mo | $147,000 | $121 | 48 |
| 327 8th St | 0.66mi | 3/1.0 | 1,155 (-7%) | 12mo | $65,000 | $56 | 46 |
| 160 Erie St | 0.61mi | 3/1.5 | 1,413 (+14%) | 4mo | $56,000 | $40 | 46 |
| 343 Furnace St | 0.66mi | 3/1.0 | 1,400 (+13%) | 1mo | $45,000 | $32 | 45 |
| 119 Floral Ct | 0.46mi | 3/1.0 | 1,120 (-10%) | 21mo | $79,900 | $71 | 43 |
| 810 Riverside Dr | 0.57mi | 3/1.0 | 1,341 (+8%) | 18mo | $150,000 | $112 | 43 |
| 480 10th St | 0.68mi | 3/1.0 | 1,087 (-12%) | 9mo | $129,900 | $120 | 38 |
| 322 8th St | 0.69mi | 3/2.0 | 1,328 (+7%) | 23mo | $152,000 | $114 | 35 |
Match score weights: distance 35% · size 25% · config 20% · recency 20%. Top-matched comps best support the ARV.
Projected returns pro-forma
-3.0% appreciation · 6.74% rent growth · sell at horizon
- IRR
- -9.2%
- Equity multiple
- 0.65×
- Total profit
- $-11,724
- Equity at exit
- $17,892
- IRR
- 4.7%
- Equity multiple
- 1.40×
- Total profit
- $13,366
- Equity at exit
- $10,375
Cash invested: $33,600 (down + closing). Projections, not guarantees.
Landlord ↔ Tenant lean methodology
- Overall (STATE)
- 73 Landlord-Friendly
- State Ohio
- 73 Landlord-Friendly · R+6
- County
- — inherits STATE
- City
- — inherits STATE
ZIP-level market 44035
- Rents YoY
- 6.7%
- Active inventory
- 359
- Price-to-rent
- 9.0×
Monthly cashflow live
- Estimated rent
- $1,108 high interval (Pro) →
- Mortgage (P&I)
- −$629
- Tax from tax record
- −$143 /mo · $1,711/yr
- Insurance
- −$50
- HOA
- −$0
- Vacancy / Maint / Mgmt
- −$233
- Net cashflow
- $53
Break-even live
Sensitivity live
| Price | -10% $121 | -5% $87 | +0% $53 | +5% $19 | +10% $-15 |
|---|---|---|---|---|---|
| Rent | -10% $-34 | -5% $9 | +0% $53 | +5% $97 | +10% $141 |
| Rate | -1.0pp $114 | -0.5pp $84 | base $53 | +0.5pp $22 | +1.0pp $-10 |
UW: 25.0% down · 7.5% · 30yr · 1.5% tax · 5.0% vac · 8.0% maint · 8.0% mgmt
Financing live
Cash to close
- Down payment
- $30,000
- Closing costs
- $3,600
- Reserves months
- —
- Total cash needed
- —
Loan-product check · same deal, 3 products live
Conventional
25% down · 7.5% · 30yr
- Down + closing
- —
- Monthly P&I
- —
- Monthly cashflow
- —
- DSCR
- —
- Eligible?
- —
Personal DTI + credit; lowest rate.
DSCR
20% down · 8.5% · 30yr
- Down + closing
- —
- Monthly P&I
- —
- Monthly cashflow
- —
- DSCR
- —
- Eligible?
- —
No personal income docs; deal must DSCR.
Hard money
10% down · 12.0% · 12mo
- Down + closing
- —
- Monthly P&I
- —
- Monthly cashflow
- —
- DSCR
- —
- Eligible?
- —
Short-term bridge; refi at stabilization.
Rent comps 8 comps
| Address | Beds | Baths | Sqft | Rent | $/sqft | DOM | Units | Dist |
|---|---|---|---|---|---|---|---|---|
| 116 Water St Elyria, OH | 2.0 | 1.0 | 888 | $1,100 | $1.24 | 25d | 1 | 0.14mi |
| 334 Washington Ave Unit 102F Elyria, OH | 2.0 | 1.0 | 750 | $895 | $1.19 | 23d | 1 | 0.65mi |
| 518 Lake Ave Unit 100 Rush Elyria, OH | 3.0 | 1.0 | 1248 | $1,099 | $0.88 | 6d | 1 | 0.66mi |
| 100 Rush St Elyria, OH | 3.0 | 1.0 | 1248 | $1,099 | $0.88 | 9d | 1 | 0.67mi |
| 138 Mendel Ct #1 Elyria, OH | 2.0 | 1.0 | 700 | $750 | $1.07 | 16d | 1 | 0.72mi |
| 421 Foster Ave Elyria, OH | 1.0–2.0 | 1.0 | 700 | $899 | $1.28 | 3d | 1 | 0.89mi |
| 1309 Middle Ave Elyria, OH | 2.0 | 1.0 | 1000 | $795 | $0.80 | 45d | 1 | 1.04mi |
| 944 Walnut St Elyria, OH | 2.0 | 1.0 | 1064 | $1,200 | $1.13 | 19d | 1 | 1.14mi |
Listing history 29 events
-
2026-06-21days on market $120,000 Active 146 DOM
-
2026-06-18days on market $120,000 Active 143 DOM
-
2026-06-17days on market $120,000 Active 142 DOM
-
2026-06-16days on market $120,000 Active 141 DOM
-
2026-06-15days on market $120,000 Active 140 DOM
-
2026-06-13days on market $120,000 Active 138 DOM
-
2026-06-13days on market $120,000 Active 137 DOM
-
2026-06-09days on market $120,000 Active 134 DOM
-
2026-06-08days on market $120,000 Active 133 DOM
-
2026-06-07days on market $120,000 Active 132 DOM
-
2026-06-03days on market $120,000 Active 128 DOM
-
2026-06-02days on market $120,000 Active 127 DOM
-
2026-06-01days on market $120,000 Active 126 DOM
-
2026-05-31days on market $120,000 Active 125 DOM
-
2026-05-23status Active
-
2026-05-15status Pending
-
2026-04-22price $120,000
-
2026-01-16$135,000 Active
-
2011-03-04soldstatus $18,150 259-char remark
Show marketing remark (259 chars)
Lovely home! Move-in condition! Hardwood in living and dining rooms; vinyl in kitchen. Second level has newer carpet. Backyard with deck and utility shed. Great front porch to relax on! Come and see your new home! New roof 2008; new hot water heater 2009.
-
2010-08-17$25,000 259-char remark
Show marketing remark (259 chars)
Lovely home! Move-in condition! Hardwood in living and dining rooms; vinyl in kitchen. Second level has newer carpet. Backyard with deck and utility shed. Great front porch to relax on! Come and see your new home! New roof 2008; new hot water heater 2009.
-
2005-10-28historical
-
2005-04-28$84,900
-
2004-01-27soldstatus $76,500
-
2004-01-27soldstatus $76,500
-
2003-10-22historical
-
2003-04-22$76,500
-
2003-03-09historical
-
2002-09-09$89,500
-
1987-12-15soldstatus $26,500
ⓘ Source: listings_history table (triggers on properties + properties_extension) + one-shot
backfill from property_details.listing_events for pre-trigger history.
Tax reassessment forecast OH · Partial reset (capped growth)
- Current annual tax
- $1,711 · $143/mo
- Projected year-2 tax
- $1,791 · $149/mo
- Expected delta
- +$81/yr (+$7/mo · 4.7%)
ⓘ Screening estimate from a state-policy table — verify with the county assessor before closing.
Climate risk First Street
- Flood 1/10 Low FEMA zone X (unshaded) · 0% chance over 30 yrs
- Wildfire 1/10 Low
- Heat 3/10 Moderate 7 d/yr ≥98°F today · 16 d/yr by 30 yrs out
- Wind 1/10 Low
- Air quality 3/10 Moderate 2 unhealthy d/yr today · 4 by 30 yrs out
Nearby sold comps map
Loading sold comps map…
Walkable amenities ~0.75 mi
Loading nearby amenities…
Taxation est. · year 1
- Rental income
- $13,291
- − Mortgage interest
- −$6,722
- − Property taxes
- −$1,711
- − Insurance
- −$600
- − Repairs & maintenance
- −$1,063
- − Management
- −$1,063
- − Depreciation
- −$3,491
- Taxable loss
- −$1,359
- Est. tax savings @ 24.0%
- +$326
- After-tax cash flow
- $964/yr
For passive investors: Depreciation is non-cash, so a rental often shows a tax loss while cash-flowing — sheltering income. Rental losses are passive: they offset passive income freely, and up to $25,000/yr can offset ordinary (W-2) income if you actively participate and your MAGI is under $100k (phasing out to $0 by $150k); unused losses carry forward. On sale, claimed depreciation is recaptured at up to 25%, and gains may owe capital-gains tax (a 1031 exchange can defer both). Figures are a year-1 estimate at your 24.0% rate — not tax advice; consult a CPA.
Schools (NCES district)
- District
- Elyria City Schools
- NCES district ID
- 3904394
- Math proficiency
- 21% ▼ -25.00%
- Reading proficiency
- 37% ▼ -15.00%
- Median HH income
- $40,992
- Composite
- 24.45/100
- National rank
- #7670
- State rank
- #586 of 656 in OH
Livability — Elyria
- Score
- 75/100
- State rank
- #243
- US rank
- #3869
Category grades
Schools grade is shown separately in the Schools card above.
Census & demographics
- Census place
- Elyria, OH
- County
- Lorain County · 219,437 people
- City population
- 62,179
- Metro
- Cleveland-Elyria, OH
- Population (ZIP)
- 62,179
- Household income
- $56,408
- Rent vs Own
- Severe rent burden
- 2229.0
Population outlook (Lorain County) Hauer SSP2
- Today (2025)
- 314,924 people
- By 2030
- 317,546 · +0.8%
- By 2040
- 317,962 · +1.0%
- By 2050
- 312,872 · -0.7%
- By 2075
- 301,806 · -4.2%
- By 2100
- 278,271 · -11.6%
Race, ethnicity, and origin ACS 2023
- Neighborhood character
- Predominantly White (70%)
- Race & ethnicity
- White 70% Two or more races 12% Black 11% Hispanic / Latino 10% Asian 1%
- Hispanic origin (detail)
- Mexican 2% Puerto Rican 6%
- Common ancestry
- Romanian 5% Slovak 2% Lithuanian 2%
- Foreign-born
- 2% · China, Canada
- Languages at home
- 94% English-only · Spanish 4% Chinese 1%
Political lean MEDSL · Lorain
- 2024 margin
- Lean R (+5.7) · D 46.7% · R 52.4%
- 2008→2024 swing
- -23.6pp toward R · 2008: 17.9pp · 2024: -5.7pp
- All cycles
- 2024: R+5.7 2020: R+2.5 2016: R+0.3 2012: D+14.4 2008: D+17.9
Not yet ingested
- Civics
- —
Market trends
- HPI YoY
- ▼ -139.09%
- Current HPI
- 199.7354
- Rent YoY
- ▲ 6.74%
- Metro
- Cleveland-Elyria, OH
- State GDP YoY
- ▲ 1.98%
- F500 in state
- 48
Industry mix (Fortune 500 HQ in OH)
| Industry | F500 HQs | Revenue |
|---|---|---|
| Insurance | 3 | $145B |
|
||
| Industrial Machinery | 3 | $49B |
|
||
| Financial Services | 3 | $24B |
|
||
| Consumer Goods | 2 | $93B |
|
||
| Aerospace / Defense | 2 | $47B |
|
||
| Utilities | 2 | $33B |
|
||
Price history
+352.8% since first listed15 events — show timeline
- 2026-05-23 Relisted — MLSNOW
- 2026-05-15 Pending — MLSNOW
- 2026-04-22 Price Changed $120,000 MLSNOW
- 2026-01-16 Listed $135,000 MLSNOW
- 2011-03-04 Sold (MLS) $18,150 MLSNOW
- 2010-08-17 Listed $25,000 MLSNOW
- 2005-10-28 Listing Removed — MLSNOW
- 2005-04-28 Listed $84,900 MLSNOW
- 2004-01-27 Sold (Public Records) $76,500 Public Records
- 2004-01-27 Sold (MLS) $76,500 MLSNOW
- 2003-10-22 Listing Removed — MLSNOW
- 2003-04-22 Listed $76,500 MLSNOW
- 2003-03-09 Listing Removed — MLSNOW
- 2002-09-09 Listed $89,500 MLSNOW
- 1987-12-15 Sold (Public Records) $26,500 Public Records
Property tax history
+14.7%/yrLatest (2025): $1,711 · +2.0% YoY. Source: county tax records.
Cash-flow waterfall
monthlySold comps — $/sqft
last 12 mo · ≤1 miLoading sold comps…