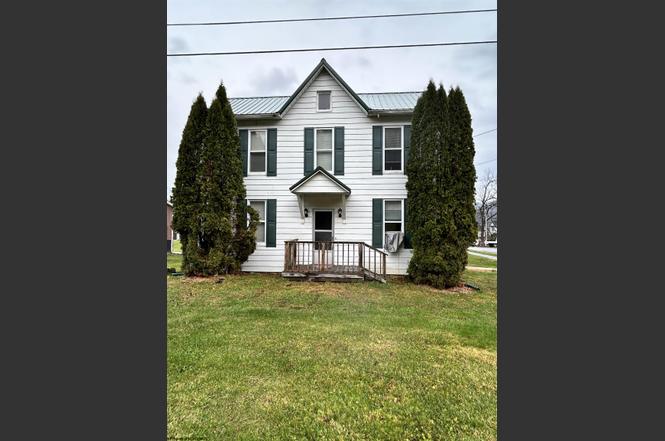
201 Third St · Parsons, WV
Flood risk 1/10 · Minimal
- FEMA flood zone
- X (unshaded)
- Chance of flooding over 30 yrs
- 0.0%
- Est. flood insurance / yr
- $473 – $860
Fire risk 2/10 · Minimal
- Est. fire insurance / yr
- $787 – $1,461
Heat risk 4/10 · Minor
- Hot days now (above 91°F)
- 8 days/yr
- Hot days in 30 yrs
- 22 days/yr
Wind risk 2/10 · Minimal
- Chance of severe wind over 30 yrs
- —
Air-quality risk 1/10 · Minimal
- Unhealthy air days now
- 0 days/yr
- Unhealthy air days in 30 yrs
- 0 days/yr
Risk factors via First Street. Map © Google.
Why this score? — see what drove the D grade
The composite is a weighted blend of 9 inputs, each scored 0–100. Each bar is that input's sub-score; the figure is the points it added to the 100-point composite (weight × sub-score).
- Cash flow +13.0/30.0
- ARV discount +8.8/15.0
- Appreciation +4.2/10.0
- DSCR +3.9/10.0
- Livability +3.8/5.0
- 1% rule +2.9/10.0
- Rent growth +2.5/5.0
- Condition / age +2.5/5.0
- Schools +2.3/10.0
$155,000
🖨 Deal sheet 📄 Offer letter ✓ Due diligence
Listing remarks
This spacious home sits on a large, level corner lot out of the flood plain. Close to all in-town amenities. This home features hardwood floors, numerous porches including a second level balcony off the primary bedroom, and recent updates to the bathroom areas. Living and entertaining areas include a living room, den, and dining room with a centrally located kitchen. Plenty of closets provide ample storage. An attic with permanent stairs provides plenty of extra storage space or additional living space with a little work. Also features a basement with interior and exterior access. Mature trees and shrubs provide a private outdoor area. Low maintenance exterior with aluminum siding and a met
Key facts
- Second level balcony
- Numerous porches
- Ample storage
Tags
Property features AI
Exterior
- Parking: On-street parking
- Utilities: Public water; Public sewer
- Home design: Single family residence (detached); 3 stories
- Construction: Aluminum siding; Block construction; Brick construction; Metal siding; Wood siding; Metal roof
- Exterior features: Corner lot; Level lot
Interior
- Kitchen: Dishwasher; Microwave; Range
- Flooring: Laminate; Vinyl; Wood
- Bathrooms: 1 full bathroom; 1 half bathroom
- Heating & cooling: Central heating (natural gas); Ceiling fans; Window cooling units
- Interior features: Balcony; Porch; Walk-out basement access; 9 total rooms
Neighborhood map
What this means for you Summary
Snapshot
- This is a 3-bed/1.5-bath single-family listed at $155k.
Deal economics
- At list price, monthly cash flow is $-9 ($-104/yr) — negative.
- To cash-flow at today's rent, offer at most $153k (1.0% below list).
- To meet the 1% rule (rent ≥ 1% of price), the offer needs to be $122k (21.3% below list).
- Recommended offer: $122k (21.3% below list) — sets the bar for 1% rule.
Location & tenants
- Location reads 75/100 on livability (#25 in WV, #3,852 nationally) — a middle-class / working-renter tenant base. Strengths: crime A+, cost of living A+, housing A+; Watch: commute D, amenities F, employment F.
- Tucker County Schools (rural): math 20% / reading 36% proficiency, ranked #40 of 55 in WV (top 73%) — low school quality limits family demand, transient renter base, plan for 1-2y turnover.
- Zoned schools: Tucker Valley Elementary Middle School (math 17% / reading 32%, grade F, #287 of 377 statewide, top 85%, 463 students, 0% FRL); Tucker County High School (math 17% / reading 52%, grade F, #42 of 110 statewide, top 47%, 293 students, 0% FRL) — zoned schools average 0% FRL vs 47% district-wide (47 pts lower); this property's tenant base skews higher-income than the district average.
- Market conditions: 20 active listings in the ZIP; 3 units permitted in Tucker County in 2024 (0 in 5+ unit buildings).
Forward outlook
- Local home prices are declining (-1.5%/yr); year-one equity from $1k of loan paydown is wiped out by about $2k of value loss. Plan a longer hold.
- Tucker County population projected at -18% by 2050 — secular population decline; favor cash flow + early exit over multi-decade hold.
Negotiation context
- It's been on market 205 days — a 12% lower offer ($136k) is reasonable based on typical stale-listing flexibility.
Risks & watch-outs
- Watch-outs: built in 1920 — expect roof / HVAC / electrical / plumbing capex.
Questions for the listing agent
- What do current leases actually rent for vs. the listed asking? Can we see a recent rent roll and the last 12 months of T-12 income?
- It's been on market 205 days. Have you received any prior offers? Is the seller open to a 21% concession, seller financing, or rate buy-down credit?
- Built in 1920 — when were the roof, HVAC, electrical panel, plumbing, and water heater last replaced?
- Why hasn't it sold? Are there any deal-killer items the seller is aware of (foundation, flood, title, zoning, code violations)?
- Is there a deadline driving the sale (1031 exchange, divorce, estate, relocation)? That informs how much negotiation room exists.
- Schools are F-rated, which usually means shorter tenancies and higher turnover. Who's the typical renter profile here, and what's been the actual vacancy rate?
- The area grade is low — what's the realistic commute time and amenity access for the typical tenant pool here? Any planned neighborhood developments (good or bad) we should know about?
- What's the average days-on-market for RENTAL listings here right now (not sales)? A rising rental-DOM trend means longer vacancies and softer asking-rent achievability than the comps imply.
- What's the recent tenant-quality profile in this submarket — average credit score on applications, eviction rate, late-payment / NSF rate, and stable-employment percentage? A property-management company in the area should have these aggregated.
- How much new for-sale + rental construction is in the pipeline within 1–3 miles? Heavy new supply typically softens prices + rents 12–24 months out; constrained supply supports both.
Investment metrics
- 1% rule
- 0.79% ✗
- Cap rate
- 6.23%
- Cash-on-cash
- -0.24%
- DSCR
- 0.99
- GRM
- 10.6
CMA / ARV
- ARV (on-the-fly)
- $159,588
- Comps found
- 3
Show comp detail 3 sales within ~0.75 mi
| Address | Dist | Beds/Ba | Sqft | Sold | Price | $/sf | Match |
|---|---|---|---|---|---|---|---|
| 510 Main St | 0.22mi | 4/2.0 (+1) | 1,665 (-3%) | 21mo | $220,000 | $132 | 61 |
| 209 Pennsylvania Ave | 0.58mi | 3/2.0 | 1,592 (-7%) | 3mo | $135,000 | $85 | 57 |
| 500 Jameson Ave | 0.65mi | 3/1.0 | 1,608 (-6%) | 19mo | $150,000 | $93 | 41 |
Match score weights: distance 35% · size 25% · config 20% · recency 20%. Top-matched comps best support the ARV.
Projected returns pro-forma
-1.51% appreciation · 3.0% rent growth · sell at horizon
- IRR
- -8.8%
- Equity multiple
- 0.64×
- Total profit
- $-15,796
- Equity at exit
- $33,658
- IRR
- -1.5%
- Equity multiple
- 0.87×
- Total profit
- $-5,568
- Equity at exit
- $32,233
Cash invested: $43,400 (down + closing). Projections, not guarantees.
Landlord ↔ Tenant lean methodology
- Overall (STATE)
- 83 Strongly Landlord-Friendly
- State West Virginia
- 83 Strongly Landlord-Friendly · R+22
- County
- — inherits STATE
- City
- — inherits STATE
ZIP-level market 26287
- Home prices YoY
- -0.9%
- Active inventory
- 20
- Price-to-rent
- 10.6×
Monthly cashflow live
- Estimated rent
- $1,219 medium interval (Pro) →
- Mortgage (P&I)
- −$813
- Tax from tax record
- −$94 /mo · $1,134/yr
- Insurance
- −$65
- HOA
- −$0
- Vacancy / Maint / Mgmt
- −$256
- Net cashflow
- $-9
Break-even live
UW: 25.0% down · 7.5% · 30yr · 1.5% tax · 5.0% vac · 8.0% maint · 8.0% mgmt
Financing live
Cash to close
- Down payment
- $38,750
- Closing costs
- $4,650
- Reserves months
- —
- Total cash needed
- —
Loan-product check · same deal, 3 products live
Conventional
25% down · 7.5% · 30yr
- Down + closing
- —
- Monthly P&I
- —
- Monthly cashflow
- —
- DSCR
- —
- Eligible?
- —
Personal DTI + credit; lowest rate.
DSCR
20% down · 8.5% · 30yr
- Down + closing
- —
- Monthly P&I
- —
- Monthly cashflow
- —
- DSCR
- —
- Eligible?
- —
No personal income docs; deal must DSCR.
Hard money
10% down · 12.0% · 12mo
- Down + closing
- —
- Monthly P&I
- —
- Monthly cashflow
- —
- DSCR
- —
- Eligible?
- —
Short-term bridge; refi at stabilization.
Listing history 17 events
-
2026-06-18days on market $155,000 Active 205 DOM
-
2026-06-17days on market $155,000 Active 204 DOM
-
2026-06-16days on market $155,000 Active 203 DOM
-
2026-06-15days on market $155,000 Active 202 DOM
-
2026-06-15days on market $155,000 Active 201 DOM
-
2026-06-13days on market $155,000 Active 200 DOM
-
2026-06-12days on market $155,000 Active 199 DOM
-
2026-06-09days on market $155,000 Active 196 DOM
-
2026-06-08days on market $155,000 Active 195 DOM
-
2026-06-08days on market $155,000 Active 194 DOM
-
2026-06-07days on market $155,000 Active 193 DOM
-
2026-06-04days on market $155,000 Active 191 DOM
-
2026-06-03days on market $155,000 Active 190 DOM
-
2026-06-02days on market $155,000 Active 189 DOM
-
2026-06-01days on market $155,000 Active 188 DOM
-
2026-05-31days on market $155,000 Active 187 DOM
-
2025-11-26$155,000 Active
ⓘ Source: listings_history table (triggers on properties + properties_extension) + one-shot
backfill from property_details.listing_events for pre-trigger history.
Tax reassessment forecast WV · Resets to sale price
- Current annual tax
- $1,134 · $94/mo
- Projected year-2 tax
- $1,134 · $94/mo
- Expected delta
- $0/yr ($0/mo · 0.0%)
ⓘ Screening estimate from a state-policy table — verify with the county assessor before closing.
Climate risk First Street
- Flood 1/10 Low FEMA zone X (unshaded) · 0% chance over 30 yrs
- Wildfire 2/10 Low
- Heat 4/10 Moderate 8 d/yr ≥91°F today · 22 d/yr by 30 yrs out
- Wind 2/10 Low
- Air quality 1/10 Low 0 unhealthy d/yr today · 0 by 30 yrs out
Nearby sold comps map
Loading sold comps map…
Walkable amenities ~0.75 mi
Loading nearby amenities…
Taxation est. · year 1
- Rental income
- $14,632
- − Mortgage interest
- −$8,682
- − Property taxes
- −$1,134
- − Insurance
- −$775
- − Repairs & maintenance
- −$1,171
- − Management
- −$1,171
- − Depreciation
- −$4,509
- Taxable loss
- −$2,810
- Est. tax savings @ 24.0%
- +$674
- After-tax cash flow
- $571/yr
For passive investors: Depreciation is non-cash, so a rental often shows a tax loss while cash-flowing — sheltering income. Rental losses are passive: they offset passive income freely, and up to $25,000/yr can offset ordinary (W-2) income if you actively participate and your MAGI is under $100k (phasing out to $0 by $150k); unused losses carry forward. On sale, claimed depreciation is recaptured at up to 25%, and gains may owe capital-gains tax (a 1031 exchange can defer both). Figures are a year-1 estimate at your 24.0% rate — not tax advice; consult a CPA.
Schools (NCES district)
- District
- Tucker County Schools
- NCES district ID
- 5401410
- Math proficiency
- 20% ▼ -11.00%
- Reading proficiency
- 36% ▼ -6.00%
- Median HH income
- $38,697
- Composite
- 23.4/100
- National rank
- #7900
- State rank
- #40 of 55 in WV
Livability — Parsons
- Score
- 75/100
- State rank
- #25
- US rank
- #3852
Category grades
Schools grade is shown separately in the Schools card above.
Census & demographics
- Census place
- Parsons, WV
- Population (ZIP)
- 2,967
Population outlook (Tucker County) Hauer SSP2
- Today (2025)
- 6,675 people
- By 2030
- 6,467 · -3.1%
- By 2040
- 5,973 · -10.5%
- By 2050
- 5,460 · -18.2%
- By 2075
- 4,283 · -35.8%
- By 2100
- 3,171 · -52.5%
Race, ethnicity, and origin ACS 2023
- Neighborhood character
- Predominantly White (96%)
- Race & ethnicity
- White 96% Two or more races 4%
- Common ancestry
- Italian 5% Slovak 4% Romanian 2%
- Foreign-born
- 0% · Canada
- Languages at home
- 99% English-only · Spanish 1%
Political lean MEDSL · Tucker
- 2024 margin
- Solid R (+48.9) · D 24.5% · R 73.4% · Other 2.1%
- 2008→2024 swing
- -25.1pp toward R · 2008: -23.8pp · 2024: -48.9pp
- All cycles
- 2024: R+48.9 2020: R+49.5 2016: R+52.2 2012: R+41.2 2008: R+23.8
Not yet ingested
- Civics
- —
Market trends
- HPI YoY
- ▼ -1.51%
- Current HPI
- 169.5461
- Rent YoY
- —
- Metro
- —
- State GDP YoY
- —
- F500 in state
- 0
Price history
1 event — show timeline
- 2025-11-26 Listed $155,000 NCWVREIN
Property tax history
+18.9%/yrLatest (2025): $1,134 · +11.2% YoY. Source: county tax records.
Cash-flow waterfall
monthlySold comps — $/sqft
last 12 mo · ≤1 miLoading sold comps…