1127 Highlands Cir · Alford, FL
Flood risk 1/10 · Minimal
- FEMA flood zone
- X (unshaded)
- Chance of flooding over 30 yrs
- 0.0%
- Est. flood insurance / yr
- $507 – $1,088
Fire risk 6/10 · Moderate
- Est. fire insurance / yr
- $947 – $1,759
Heat risk 8/10 · Major
- Hot days now (above 106°F)
- 7 days/yr
- Hot days in 30 yrs
- 20 days/yr
Wind risk 9/10 · Severe
- Chance of severe wind over 30 yrs
- 99.0%
Air-quality risk 1/10 · Minimal
- Unhealthy air days now
- 0 days/yr
- Unhealthy air days in 30 yrs
- 0 days/yr
Risk factors via First Street. Map © Google.
Why this score? — see what drove the B grade
The composite is a weighted blend of 9 inputs, each scored 0–100. Each bar is that input's sub-score; the figure is the points it added to the 100-point composite (weight × sub-score).
- Cash flow +30.0/30.0
- 1% rule +10.0/10.0
- DSCR +10.0/10.0
- ARV discount +7.5/15.0
- Schools +4.2/10.0
- Appreciation +4.0/10.0
- Livability +3.0/5.0
- Rent growth +2.5/5.0
- Condition / age +2.5/5.0
$70,000
🖨 Deal sheet 📄 Offer letter ✓ Due diligence
Listing remarks
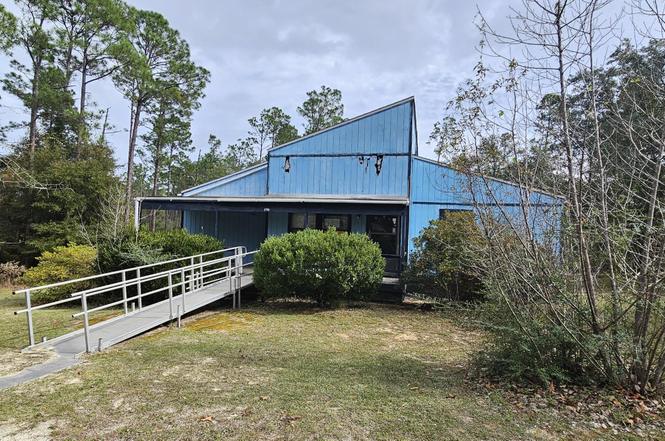
Discover the potential in this charming ''Diamond in the Rough'' located in Alford, Florida, just north of Panama City, Florida. This 3-bedroom, 2-bath home sits on a spacious 1-acre lot, offering plenty of room to create your ideal retreat. Enjoy peaceful mornings on the covered front porch, surrounded by nature and the sounds of local wildlife. Nestled on a quiet street within Compass Lake in the Hills, this property provides both privacy and convenience. Located just a short drive from Panama City Beach--home to the ''World's Most Beautiful Beaches''--and with easy access to the Interstate 10 corridor, commuting and travel are a breeze. Whether you're looking for a full-time residence, a
Key facts
- Covered front porch
- 1.04 acre lot
- Community pool
Tags
Property features AI
Finance
- HOA & community: Community amenities: barbecue, basketball court, boat facilities, conference/meeting room, fishing, playground, park, pool, tennis courts; short-term rentals allowed
Exterior
- Parking: Unpaved parking
- Utilities: Electricity available
- Home design: Single-story home; Irregular lot shape; Zoned for single-family; county allows horses
- Construction: Wood siding with wood frame construction; Composition/shingle roof
- Exterior features: Deck; Covered patio; Paved lot; Community pool; Community gazebo
Interior
- Kitchen: Electric water heater
- Bedrooms: Multiple bedrooms including a primary bedroom
- Bathrooms: 2 full bathrooms
- Heating & cooling: Central heating (electric); Central air conditioning; Ceiling fans
- Interior features: Front porch; Back deck; Covered patio
- Laundry & utility: Electricity available
Neighborhood map
What this means for you Summary
Snapshot
- This is a 2-bed/2.0-bath single-family listed at $70k.
Deal economics
- At list price, monthly cash flow is $336 ($4k/yr) — positive.
- The deal already cash-flows at list — no discount required.
- Meets the 1% rule at list price ($1k rent vs $70k).
- Recommended offer: $62k (12.0% below list) — sets the bar for market timing.
- Cap rate 12.0% vs local median 2.8% in Alford — top-decile yield for the area; either an underpriced asset or a hidden risk that comps aren't pricing in. Stress-test before assuming the spread holds.
Location & tenants
- Location reads 59/100 on livability (#819 in FL) — a working-class tenant base; expect higher turnover. Strengths: cost of living A+, housing A+; Watch: crime D, health & safety D, schools F.
- Jackson (rural): math 47% / reading 54% proficiency, ranked #39 of 73 in FL (top 53%) — acceptable for families but not a draw, mixed tenant base, ~2y average lease.
- Market conditions: 172 active listings in the ZIP; 153 units permitted in Jackson County in 2024 (40 in 5+ unit buildings).
Forward outlook
- Local home prices are declining (-2.0%/yr); year-one equity from $484 of loan paydown is wiped out by about $1k of value loss. Plan a longer hold.
- Jackson County population projected at -18% by 2050 — secular population decline; favor cash flow + early exit over multi-decade hold.
- At projected returns (-2.0% appreciation + 3.0% rent growth), your $20k cash investment doubles in ~6 years — after that, you're playing with house money.
Negotiation context
- It's been on market 163 days — a 12% lower offer ($62k) is reasonable based on typical stale-listing flexibility.
- 2 sale attempts; this cycle's ask has dropped $64k (48%) from the opening price — seller is motivated, your offer sets the floor, not the list.
Risks & watch-outs
- Climate carrying-cost: severe wind risk, 99% chance of damaging wind over 30y; major wildfire risk; extreme-heat days projected 7→20/yr by 2055 (HVAC capex compounding) — expect insurance premiums to compound above CPI over the hold.
Questions for the listing agent
- It's been on market 163 days. Have you received any prior offers? Is the seller open to a 12% concession, seller financing, or rate buy-down credit?
- Why hasn't it sold? Are there any deal-killer items the seller is aware of (foundation, flood, title, zoning, code violations)?
- Is there a deadline driving the sale (1031 exchange, divorce, estate, relocation)? That informs how much negotiation room exists.
- Schools are F-rated, which usually means shorter tenancies and higher turnover. Who's the typical renter profile here, and what's been the actual vacancy rate?
- Crime grade is D in this area — have there been break-ins, vandalism, or insurance claims at this property in the last 3 years? What carrier currently insures it and at what premium?
- What's the average days-on-market for RENTAL listings here right now (not sales)? A rising rental-DOM trend means longer vacancies and softer asking-rent achievability than the comps imply.
- What's the recent tenant-quality profile in this submarket — average credit score on applications, eviction rate, late-payment / NSF rate, and stable-employment percentage? A property-management company in the area should have these aggregated.
- How much new for-sale + rental construction is in the pipeline within 1–3 miles? Heavy new supply typically softens prices + rents 12–24 months out; constrained supply supports both.
Investment metrics
- 1% rule
- 1.55% ✓
- Cap rate
- 12.04%
- Cash-on-cash
- 20.54%
- DSCR
- 1.91
- GRM
- 5.4
CMA / ARV
- ARV (on-the-fly)
- $244,160
- Comps found
- 1
Show comp detail 1 sale within ~0.75 mi
| Address | Dist | Beds/Ba | Sqft | Sold | Price | $/sf | Match |
|---|---|---|---|---|---|---|---|
| 948 Fayette Dr | 0.20mi | 3/2.0 (+1) | 1,628 (+7%) | 16mo | $259,900 | $160 | 61 |
Match score weights: distance 35% · size 25% · config 20% · recency 20%. Top-matched comps best support the ARV.
Projected returns pro-forma
-2.02% appreciation · 3.0% rent growth · sell at horizon
- IRR
- 15.5%
- Equity multiple
- 1.66×
- Total profit
- $12,974
- Equity at exit
- $13,532
- IRR
- 22.7%
- Equity multiple
- 3.12×
- Total profit
- $41,564
- Equity at exit
- $11,505
Cash invested: $19,600 (down + closing). Projections, not guarantees.
Landlord ↔ Tenant lean methodology
- Overall (STATE)
- 87 Strongly Landlord-Friendly
- State Florida
- 87 Strongly Landlord-Friendly · R+3
- County
- — inherits STATE
- City
- — inherits STATE
ZIP-level market 32420
- Home prices YoY
- -1.2%
- Active inventory
- 172
- Price-to-rent
- 5.4×
Monthly cashflow live
- Estimated rent
- $1,084 medium interval (Pro) →
- Mortgage (P&I)
- −$367
- Tax from tax record
- −$124 /mo · $1,494/yr
- Insurance
- −$29
- HOA
- −$0
- Vacancy / Maint / Mgmt
- −$228
- Net cashflow
- $336
Break-even live
UW: 25.0% down · 7.5% · 30yr · 1.5% tax · 5.0% vac · 8.0% maint · 8.0% mgmt
Financing live
Cash to close
- Down payment
- $17,500
- Closing costs
- $2,100
- Reserves months
- —
- Total cash needed
- —
Loan-product check · same deal, 3 products live
Conventional
25% down · 7.5% · 30yr
- Down + closing
- —
- Monthly P&I
- —
- Monthly cashflow
- —
- DSCR
- —
- Eligible?
- —
Personal DTI + credit; lowest rate.
DSCR
20% down · 8.5% · 30yr
- Down + closing
- —
- Monthly P&I
- —
- Monthly cashflow
- —
- DSCR
- —
- Eligible?
- —
No personal income docs; deal must DSCR.
Hard money
10% down · 12.0% · 12mo
- Down + closing
- —
- Monthly P&I
- —
- Monthly cashflow
- —
- DSCR
- —
- Eligible?
- —
Short-term bridge; refi at stabilization.
Listing history 10 events
-
2026-06-04statusdays on market $70,000 Pending 163 DOM
-
2026-06-02days on market $70,000 Active 162 DOM
-
2026-06-01days on market $70,000 Active 161 DOM
-
2026-05-31days on market $70,000 Active 160 DOM
-
2026-05-31days on market $70,000 Active 159 DOM
-
2026-05-19status Active
-
2026-05-15status Pending
-
2026-05-01price $70,000
-
2025-12-18$134,000 Active
-
1987-02-01soldstatus $70,000
ⓘ Source: listings_history table (triggers on properties + properties_extension) + one-shot
backfill from property_details.listing_events for pre-trigger history.
Tax reassessment forecast FL · Resets to sale price
- Current annual tax
- $1,494 · $124/mo
- Projected year-2 tax
- $1,494 · $124/mo
- Expected delta
- $0/yr ($0/mo · 0.0%)
ⓘ Screening estimate from a state-policy table — verify with the county assessor before closing.
Climate risk First Street
- Flood 1/10 Low FEMA zone X (unshaded) · 0% chance over 30 yrs
- Wildfire 6/10 Major
- Heat 8/10 Severe 7 d/yr ≥106°F today · 20 d/yr by 30 yrs out
- Wind 9/10 Extreme 99% chance of damaging wind over 30 yrs
- Air quality 1/10 Low 0 unhealthy d/yr today · 0 by 30 yrs out
Nearby sold comps map
Loading sold comps map…
Walkable amenities ~0.75 mi
Loading nearby amenities…
Taxation est. · year 1
- Rental income
- $13,006
- − Mortgage interest
- −$3,921
- − Property taxes
- −$1,494
- − Insurance
- −$350
- − Repairs & maintenance
- −$1,040
- − Management
- −$1,040
- − Depreciation
- −$2,036
- Taxable income
- $3,124
- Est. tax owed @ 24.0%
- −$750
- After-tax cash flow
- $3,276/yr
For passive investors: Depreciation is non-cash, so a rental often shows a tax loss while cash-flowing — sheltering income. Rental losses are passive: they offset passive income freely, and up to $25,000/yr can offset ordinary (W-2) income if you actively participate and your MAGI is under $100k (phasing out to $0 by $150k); unused losses carry forward. On sale, claimed depreciation is recaptured at up to 25%, and gains may owe capital-gains tax (a 1031 exchange can defer both). Figures are a year-1 estimate at your 24.0% rate — not tax advice; consult a CPA.
Schools (NCES district)
- District
- Jackson
- NCES district ID
- 1200960
- Math proficiency
- 47% ▼ -9.00%
- Reading proficiency
- 54% ▼ -3.00%
- Median HH income
- $36,824
- Composite
- 41.92/100
- National rank
- #3358
- State rank
- #39 of 73 in FL
Livability — Alford
- Score
- 59/100
- State rank
- #819
- US rank
- #20017
Category grades
Schools grade is shown separately in the Schools card above.
Census & demographics
- Population (ZIP)
- 2,232
Population outlook (Jackson County) Hauer SSP2
- Today (2025)
- 46,095 people
- By 2030
- 44,432 · -3.6%
- By 2040
- 41,077 · -10.9%
- By 2050
- 37,587 · -18.5%
- By 2075
- 28,921 · -37.3%
- By 2100
- 19,332 · -58.1%
Race, ethnicity, and origin ACS 2023
- Neighborhood character
- Predominantly White (91%)
- Race & ethnicity
- White 91% Two or more races 5% Hispanic / Latino 5%
- Common ancestry
- Romanian 4% Lithuanian 1% Serbian 1%
- Foreign-born
- 2% · Canada
- Languages at home
- 99% English-only · Spanish 1%
Political lean MEDSL · Jackson
- 2024 margin
- Solid R (+46.1) · D 26.7% · R 72.7%
- 2008→2024 swing
- -18.0pp toward R · 2008: -28.0pp · 2024: -46.1pp
- All cycles
- 2024: R+46.1 2020: R+38.9 2016: R+37.4 2012: R+29.0 2008: R+28.0
Not yet ingested
- Civics
- —
Market trends
- HPI YoY
- ▼ -2.02%
- Current HPI
- 172.464
- Rent YoY
- —
- Metro
- —
- State GDP YoY
- ▲ 3.28%
- F500 in state
- 36
Industry mix (Fortune 500 HQ in FL)
| Industry | F500 HQs | Revenue |
|---|---|---|
| Industrial Technology | 2 | $29B |
|
||
| Insurance | 2 | $17B |
|
||
| Retail | 1 | $60B |
|
||
| Technology Distribution | 1 | $58B |
|
||
| Homebuilding | 1 | $35B |
|
||
| Technology Manufacturing | 1 | $35B |
|
||
Price history
+0.0% since first listed5 events — show timeline
- 2026-05-19 Relisted — CPARMLS
- 2026-05-15 Pending — CPARMLS
- 2026-05-01 Price Changed $70,000 CPARMLS
- 2025-12-18 Listed $134,000 CPARMLS
- 1987-02-01 Sold (Public Records) $70,000 Public Records
Property tax history
+10.2%/yrLatest (2025): $1,494 · +4.8% YoY. Source: county tax records.
Cash-flow waterfall
monthlySold comps — $/sqft
last 12 mo · ≤1 miLoading sold comps…