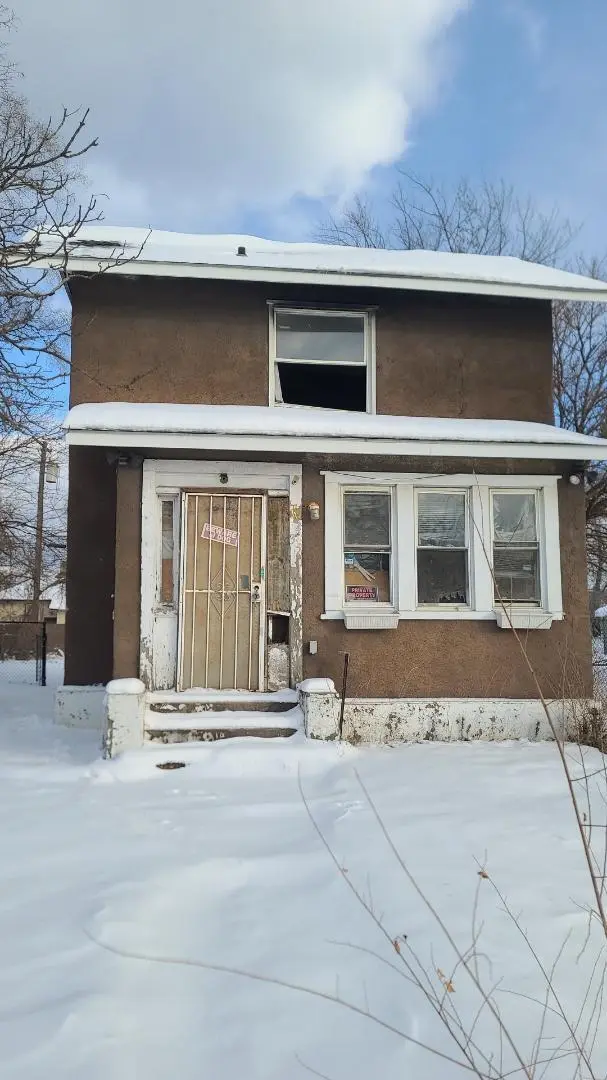
435 Buchanan St #46402 · Gary, IN
Flood risk 1/10 · Minimal
- FEMA flood zone
- X (unshaded)
- Chance of flooding over 30 yrs
- 0.0%
- Est. flood insurance / yr
- $473 – $860
Fire risk 1/10 · Minimal
- Est. fire insurance / yr
- $717 – $1,331
Heat risk 3/10 · Minor
- Hot days now (above 102°F)
- 7 days/yr
- Hot days in 30 yrs
- 15 days/yr
Wind risk 2/10 · Minimal
- Chance of severe wind over 30 yrs
- 1.0%
Air-quality risk 4/10 · Minor
- Unhealthy air days now
- 5 days/yr
- Unhealthy air days in 30 yrs
- 6 days/yr
Risk factors via First Street. Map © Google.
Why this score? — see what drove the B+ grade
The composite is a weighted blend of 9 inputs, each scored 0–100. Each bar is that input's sub-score; the figure is the points it added to the 100-point composite (weight × sub-score).
- Cash flow +30.0/30.0
- ARV discount +15.0/15.0
- 1% rule +10.0/10.0
- DSCR +10.0/10.0
- Livability +3.7/5.0
- Rent growth +2.5/5.0
- Condition / age +2.5/5.0
- Appreciation +1.4/10.0
- Schools +0.5/10.0
$35,000
🖨 Deal sheet (PDF) 📄 Offer letter ✓ Due diligence
Listing remarks MLS
Tons of potential in this 2 story 3 bedroom with a full basement.
Key facts
- 6,098 sq ft lot
- Built 1917
- Listed 172 days
Neighborhood map
What this means for you Summary
Snapshot
- This is a 3-bed/1.0-bath single-family listed at $35k.
Deal economics
- At list price, monthly cash flow is $798 ($10k/yr) — positive.
- The deal already cash-flows at list — no discount required.
- Meets the 1% rule at list price ($1k rent vs $35k).
- Recommended offer: $31k (12.0% below list) — sets the bar for market timing.
- Cap rate 33.6% vs local median 9.1% in Gary — top-decile yield for the area; either an underpriced asset or a hidden risk that comps aren't pricing in. Stress-test before assuming the spread holds.
Location & tenants
- Location reads 73/100 on livability (#105 in IN) — a middle-class / working-renter tenant base. Strengths: commute A+, cost of living A+, housing A+; Watch: schools F, crime F, employment F.
- Gary Community School Corporation (urban): math 3% / reading 11% proficiency, ranked #299 of 301 in IN (top 99%) — low school quality limits family demand, transient renter base, plan for 1-2y turnover; 80% free/reduced lunch — lower-income household profile, screen leases tightly.
- Market conditions: 47 active listings in the ZIP; 16 comparable units currently listed for rent nearby; rentals leasing fast (median 0d on market — plan ~1-2 weeks tenant-placement turnaround); lower-income renter base — watch delinquency; 1,642 units permitted in Lake County in 2024 (14 in 5+ unit buildings).
- At $1,331/mo this rent would consume 48% of the median local household income ($34k/yr) (locally 336% of renters already pay >50% of income on rent) — very limited rent-growth headroom before tenants either downsize or default.
Forward outlook
- Local home prices are declining (-3.0%/yr); year-one equity from $242 of loan paydown is wiped out by about $1k of value loss. Plan a longer hold.
- Lake County population projected to shrink 7% by 2050 — rents likely to lag national; underwrite the cash flow, not the appreciation.
- At projected returns (-3.0% appreciation + 3.0% rent growth), your $10k cash investment doubles in ~2 years — after that, you're playing with house money.
Negotiation context
- It's been on market 173 days — a 12% lower offer ($31k) is reasonable based on typical stale-listing flexibility.
- 4 sale attempts since 28y ago with the ask held roughly flat each time — persistent listings suggest the price (not the market) is what's stuck; bring a comps-based counter.
- Current owner paid $29k; 22% above their basis — modest negotiation headroom, anchor on the comps not their cost.
Risks & watch-outs
- Watch-outs: built in 1917 — expect roof / HVAC / electrical / plumbing capex.
Questions for the listing agent
- It's been on market 173 days. Have you received any prior offers? Is the seller open to a 12% concession, seller financing, or rate buy-down credit?
- Built in 1917 — when were the roof, HVAC, electrical panel, plumbing, and water heater last replaced?
- Why hasn't it sold? Are there any deal-killer items the seller is aware of (foundation, flood, title, zoning, code violations)?
- Is there a deadline driving the sale (1031 exchange, divorce, estate, relocation)? That informs how much negotiation room exists.
- Schools are F-rated, which usually means shorter tenancies and higher turnover. Who's the typical renter profile here, and what's been the actual vacancy rate?
- Crime grade is F in this area — have there been break-ins, vandalism, or insurance claims at this property in the last 3 years? What carrier currently insures it and at what premium?
- What's the average days-on-market for RENTAL listings here right now (not sales)? A rising rental-DOM trend means longer vacancies and softer asking-rent achievability than the comps imply.
- What's the recent tenant-quality profile in this submarket — average credit score on applications, eviction rate, late-payment / NSF rate, and stable-employment percentage? A property-management company in the area should have these aggregated.
- How much new for-sale + rental construction is in the pipeline within 1–3 miles? Heavy new supply typically softens prices + rents 12–24 months out; constrained supply supports both.
Investment metrics
- 1% rule
- 3.80% ✓
- Cap rate
- 33.65%
- Cash-on-cash
- 97.69%
- DSCR
- 5.35
- GRM
- 2.2
CMA / ARV
- ARV (median comp)
- $45,891
- List price
- $35,000
- Delta
- -23.73%
- Verdict
- UNDERPRICED
- Comps
- 20 within 1.0 mi
Show comp detail 12 sales within ~0.75 mi
| Address | Dist | Beds/Ba | Sqft | Sold | Price | $/sf | Match |
|---|---|---|---|---|---|---|---|
| 435 Buchanan St | 0.00mi | 3/1.0 | 1,188 (0%) | 10mo | $28,700 | $24 | 92 |
| 266 Johnson St | 0.27mi | 2/1.0 (-1) | 1,113 (-6%) | 3mo | $37,000 | $33 | 70 |
| 455 Polk St | 0.19mi | 3/1.0 | 1,140 (-4%) | 19mo | $89,900 | $79 | 69 |
| 759 Grant St | 0.45mi | 3/1.0 | 1,248 (+5%) | 6mo | $100,000 | $80 | 65 |
| 768 Tyler St | 0.49mi | 4/1.0 (+1) | 1,248 (+5%) | 1mo | $22,000 | $18 | 63 |
| 1901 W 4th Pl | 0.44mi | 2/1.0 (-1) | 1,154 (-3%) | 16mo | $60,000 | $52 | 56 |
| 235 W Taft St | 0.67mi | 3/2.0 | 1,158 (-2%) | 8mo | $184,000 | $159 | 53 |
| 805 Buchanan St | 0.46mi | 3/2.0 | 1,350 (+14%) | 0mo | $100,000 | $74 | 51 |
| 206 Mckinley St | 0.60mi | 2/1.0 (-1) | 1,237 (+4%) | 15mo | $110,000 | $89 | 48 |
| 1067 Polk St | 0.74mi | 3/1.5 | 1,088 (-8%) | 7mo | $116,000 | $107 | 43 |
| 407 Mckinley St | 0.50mi | 3/1.5 | 1,047 (-12%) | 16mo | $115,140 | $110 | 42 |
| 231 Cleveland St | 0.50mi | 3/1.0 | 1,015 (-15%) | 17mo | $60,000 | $59 | 38 |
Match score weights: distance 35% · size 25% · config 20% · recency 20%. Top-matched comps best support the ARV.
Projected returns pro-forma
-3.0% appreciation · 3.0% rent growth · sell at horizon
- IRR
- 98.7%
- Equity multiple
- 5.61×
- Total profit
- $45,169
- Equity at exit
- $5,219
- IRR
- —
- Equity multiple
- 11.70×
- Total profit
- $104,873
- Equity at exit
- $3,026
Cash invested: $9,800 (down + closing). Projections, not guarantees.
Landlord ↔ Tenant lean methodology
- Overall (STATE)
- 90 Strongly Landlord-Friendly
- State Indiana
- 90 Strongly Landlord-Friendly · R+11
- County
- — inherits STATE
- City
- — inherits STATE
ZIP-level market 46402
- Home prices YoY
- -2.8%
- Active inventory
- 47
- Price-to-rent
- 2.2×
Monthly cashflow live
- Estimated rent
- $1,331 high interval (Pro) →
- Mortgage (P&I)
- −$184
- Tax from tax record
- −$55 /mo · $665/yr
- Insurance
- −$15
- HOA
- −$0
- Vacancy / Maint / Mgmt
- −$279
- Net cashflow
- $798
Break-even live
Sensitivity live
| Price | -10% $818 | -5% $808 | +0% $798 | +5% $788 | +10% $778 |
|---|---|---|---|---|---|
| Rent | -10% $693 | -5% $745 | +0% $798 | +5% $850 | +10% $903 |
| Rate | -1.0pp $815 | -0.5pp $807 | base $798 | +0.5pp $789 | +1.0pp $780 |
UW: 25.0% down · 7.5% · 30yr · 1.5% tax · 5.0% vac · 8.0% maint · 8.0% mgmt
Financing live
Cash to close
- Down payment
- $8,750
- Closing costs
- $1,050
- Reserves months
- —
- Total cash needed
- —
Loan-product check · same deal, 3 products live
Conventional
25% down · 7.5% · 30yr
- Down + closing
- —
- Monthly P&I
- —
- Monthly cashflow
- —
- DSCR
- —
- Eligible?
- —
Personal DTI + credit; lowest rate.
DSCR
20% down · 8.5% · 30yr
- Down + closing
- —
- Monthly P&I
- —
- Monthly cashflow
- —
- DSCR
- —
- Eligible?
- —
No personal income docs; deal must DSCR.
Hard money
10% down · 12.0% · 12mo
- Down + closing
- —
- Monthly P&I
- —
- Monthly cashflow
- —
- DSCR
- —
- Eligible?
- —
Short-term bridge; refi at stabilization.
Rent comps 16 comps
| Address | Beds | Baths | Sqft | Rent | $/sqft | DOM | Units | Dist |
|---|---|---|---|---|---|---|---|---|
| 411 Pierce St Gary, IN | 3.0 | 1.0 | 874 | $1,395 | $1.60 | 23d | 1 | 0.07mi |
| 317 Garfield St Gary, IN | 3.0 | 1.0 | 936 | $1,495 | $1.60 | 44d | 1 | 0.34mi |
| 358 Arthur St Unit 2 Gary, IN | 2.0 | 1.0 | 800 | $1,250 | $1.56 | 0d | 1 | 0.42mi |
| 501 Madison St Gary, IN | 1.0–4.0 | 1.0 | 883 | $1,362 | $1.54 | 0d | 11 | 0.59mi |
| 2306 W 5th Ave Gary, IN | 2.0–3.0 | 1.0 | 937 | $1,299 | $1.39 | 0d | 2 | 0.66mi |
| 2306 W 5th Ave Apt 3 Gary, IN | 3.0 | 1.0 | 1025 | $1,299 | $1.27 | 0d | 1 | 0.67mi |
| 2602 W 6th Ave Gary, IN | 2.0 | 1.0 | 750 | $990 | $1.32 | 0d | 1 | 0.91mi |
| 672 Connecticut St Apt 1S Gary, IN | 3.0 | 1.0 | 1247 | $875 | $0.70 | 16d | 1 | 0.99mi |
| 1521 Pierce St Unit 1 Gary, IN | 2.0 | 1.0 | 800 | $850 | $1.06 | 0d | 1 | 1.08mi |
| 1572 Polk St Gary, IN | 3.0 | 1.0 | 1500 | $1,250 | $0.83 | 0d | 1 | 1.16mi |
| 2939 W 10th Ave Gary, IN | 2.0 | 1.0 | 744 | $1,190 | $1.60 | 0d | 1 | 1.30mi |
| 840 W 19th Ave Gary, IN | 2.0 | 1.0 | 1035 | $1,150 | $1.11 | 20d | 1 | 1.32mi |
| 1595 Ellsworth St Gary, IN | 2.0 | 1.0 | 868 | $1,100 | $1.27 | 3d | 1 | 1.40mi |
| 1595 Ellsworth St Unit 1 Gary, IN | 2.0 | 1.0 | 868 | $1,100 | $1.27 | 0d | 1 | 1.40mi |
| 1316 Delaware St Unit 2 Gary, IN | 2.0 | 1.0 | 700 | $950 | $1.36 | 21d | 1 | 1.41mi |
| 1329 Delaware St Gary, IN | 2.0 | 1.0 | 1100 | $1,100 | $1.00 | 44d | 1 | 1.45mi |
Listing history 11 events
-
2026-06-01days on market $35,000 Active 173 DOM
-
2026-05-31days on market $35,000 Active 172 DOM
-
2025-12-10$35,000 Active 65-char remark
Show marketing remark (65 chars)
Tons of potential in this 2 story 3 bedroom with a full basement.
-
2025-08-22soldstatus $28,700 Closed 141-char remark
Show marketing remark (141 chars)
2 story with 3 bedroom and full basement. Low property taxes and large fenced yard and 4 car concrete parking spaces in the back of the house
-
2025-08-10status Pending 141-char remark
Show marketing remark (141 chars)
2 story with 3 bedroom and full basement. Low property taxes and large fenced yard and 4 car concrete parking spaces in the back of the house
-
2025-07-23price $36,900 141-char remark
Show marketing remark (141 chars)
2 story with 3 bedroom and full basement. Low property taxes and large fenced yard and 4 car concrete parking spaces in the back of the house
-
2025-06-18$41,500 Active 141-char remark
Show marketing remark (141 chars)
2 story with 3 bedroom and full basement. Low property taxes and large fenced yard and 4 car concrete parking spaces in the back of the house
-
2011-06-01historical
-
2010-05-10$34,900
-
1998-08-05historical
-
1998-04-24$39,900
ⓘ Source: listings_history table (triggers on properties + properties_extension) + one-shot
backfill from property_details.listing_events for pre-trigger history.
Tax reassessment forecast IN · Partial reset (capped growth)
- Current annual tax
- $665 · $55/mo
- Projected year-2 tax
- $665 · $55/mo
- Expected delta
- $0/yr ($0/mo · 0.0%)
ⓘ Screening estimate from a state-policy table — verify with the county assessor before closing.
Climate risk First Street
- Flood 1/10 Low FEMA zone X (unshaded) · 0% chance over 30 yrs
- Wildfire 1/10 Low
- Heat 3/10 Moderate 7 d/yr ≥102°F today · 15 d/yr by 30 yrs out
- Wind 2/10 Low 100% chance of damaging wind over 30 yrs
- Air quality 4/10 Moderate 5 unhealthy d/yr today · 6 by 30 yrs out
Nearby sold comps map
Loading sold comps map…
Walkable amenities ~0.75 mi
Loading nearby amenities…
Taxation est. · year 1
- Rental income
- $15,970
- − Mortgage interest
- −$1,961
- − Property taxes
- −$665
- − Insurance
- −$175
- − Repairs & maintenance
- −$1,278
- − Management
- −$1,278
- − Depreciation
- −$1,018
- Taxable income
- $9,596
- Est. tax owed @ 24.0%
- −$2,303
- After-tax cash flow
- $7,271/yr
For passive investors: Depreciation is non-cash, so a rental often shows a tax loss while cash-flowing — sheltering income. Rental losses are passive: they offset passive income freely, and up to $25,000/yr can offset ordinary (W-2) income if you actively participate and your MAGI is under $100k (phasing out to $0 by $150k); unused losses carry forward. On sale, claimed depreciation is recaptured at up to 25%, and gains may owe capital-gains tax (a 1031 exchange can defer both). Figures are a year-1 estimate at your 24.0% rate — not tax advice; consult a CPA.
Schools (NCES district)
- District
- Gary Community School Corporation
- NCES district ID
- 1803870
- Math proficiency
- 3% ▼ -10.00%
- Reading proficiency
- 11% ▼ -6.00%
- Median HH income
- $27,739
- Composite
- 4.98/100
- National rank
- #10039
- State rank
- #299 of 301 in IN
Livability — Gary
- Score
- 73/100
- State rank
- #105
- US rank
- #5592
Category grades
Schools grade is shown separately in the Schools card above.
Census & demographics
- Census place
- Gary, IN
- County
- Lake County · 422,878 people
- City population
- 63,701
- Metro
- Chicago-Naperville-Elgin, IL-IN-WI
- Population (ZIP)
- 5,836
- Household income
- $33,529
- Rent vs Own
- Severe rent burden
- 336.0
Population outlook (Lake County) Hauer SSP2
- Today (2025)
- 484,026 people
- By 2030
- 478,091 · -1.2%
- By 2040
- 462,974 · -4.3%
- By 2050
- 449,894 · -7.1%
- By 2075
- 436,169 · -9.9%
- By 2100
- 426,607 · -11.9%
Race, ethnicity, and origin ACS 2023
- Neighborhood character
- Predominantly Black (87%)
- Race & ethnicity
- Black 87% Two or more races 5% White 5% Hispanic / Latino 4%
- Common ancestry
- Romanian 1% Ukrainian 1%
- Foreign-born
- 1% · Canada
- Languages at home
- 98% English-only · Spanish 1% Arabic 1%
Political lean MEDSL · Lake
- 2024 margin
- Lean D (+5.6) · D 52.1% · R 46.5% · Other 1.5%
- 2008→2024 swing
- -28.6pp toward R · 2008: 34.3pp · 2024: 5.6pp
- All cycles
- 2024: D+5.6 2020: D+15.1 2016: D+20.6 2012: D+31.0 2008: D+34.3
Not yet ingested
- Civics
- —
Market trends
- HPI YoY
- ▼ -7.21%
- Current HPI
- 250.2464
- Rent YoY
- —
- Metro
- Chicago-Naperville-Elgin, IL-IN-WI
- State GDP YoY
- ▲ 2.90%
- F500 in state
- 18
Industry mix (Fortune 500 HQ in IN)
| Industry | F500 HQs | Revenue |
|---|---|---|
| Industrial Machinery | 2 | $37B |
|
||
| Healthcare | 1 | $177B |
|
||
| Pharmaceuticals | 1 | $45B |
|
||
| Metals / Steel | 1 | $18B |
|
||
| Agriculture | 1 | $17B |
|
||
| Packaging | 1 | $12B |
|
||
Price history
-12.3% since first listed9 events — show timeline
- 2025-12-10 Listed $35,000 NIRA MLS as Distributed by MLS Grid
- 2025-08-22 Sold (MLS) $28,700 NIRA MLS as Distributed by MLS Grid
- 2025-08-10 Pending — NIRA MLS as Distributed by MLS Grid
- 2025-07-23 Price Changed $36,900 NIRA MLS as Distributed by MLS Grid
- 2025-06-18 Listed $41,500 NIRA MLS as Distributed by MLS Grid
- 2011-06-01 Listing Removed — NIRA MLS as Distributed by MLS Grid
- 2010-05-10 Listed $34,900 NIRA MLS as Distributed by MLS Grid
- 1998-08-05 Listing Removed — NIRA MLS as Distributed by MLS Grid
- 1998-04-24 Listed $39,900 NIRA MLS as Distributed by MLS Grid
Property tax history
-12.1%/yrLatest (2024): $665 · +56.8% YoY. Source: county tax records.
Cash-flow waterfall
monthlySold comps — $/sqft
last 12 mo · ≤1 miLoading sold comps…