 🏷️ Likely Rental
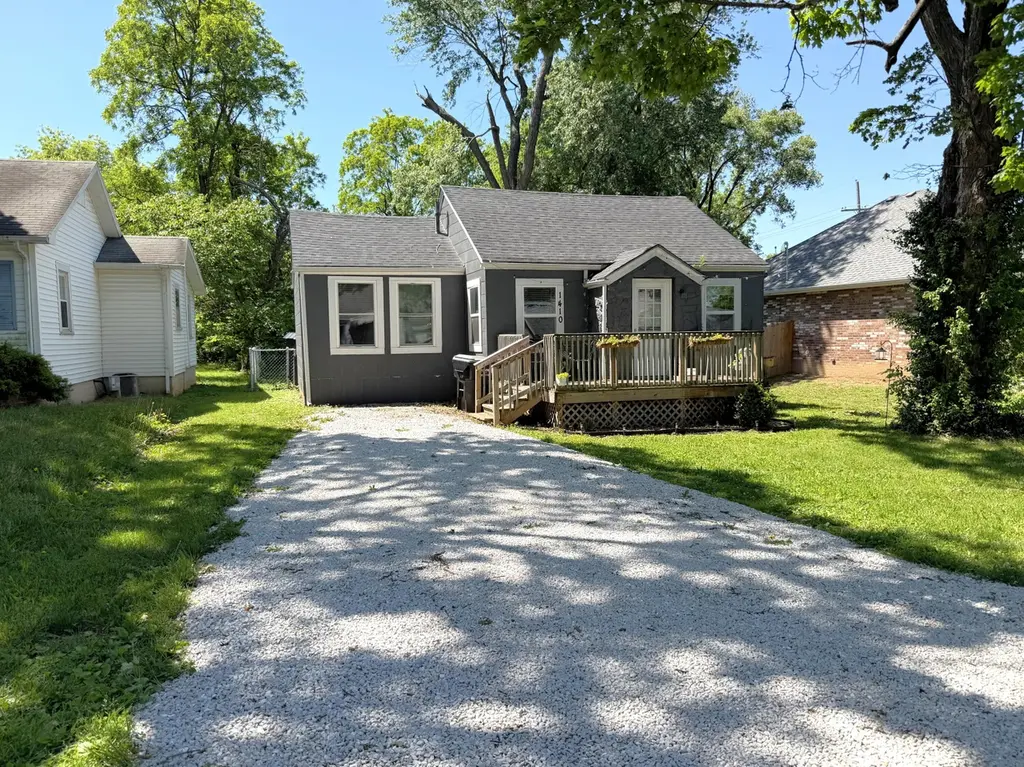
1410 E Lindberg St · Springfield, MO
Flood risk 1/10 · Minimal
- FEMA flood zone
- X (unshaded)
- Chance of flooding over 30 yrs
- 0.0%
- Est. flood insurance / yr
- $507 – $1,088
Fire risk 1/10 · Minimal
- Est. fire insurance / yr
- $1,054 – $1,958
Heat risk 5/10 · Moderate
- Hot days now (above 105°F)
- 7 days/yr
- Hot days in 30 yrs
- 19 days/yr
Wind risk 2/10 · Minimal
- Chance of severe wind over 30 yrs
- —
Air-quality risk 2/10 · Minimal
- Unhealthy air days now
- 1 days/yr
- Unhealthy air days in 30 yrs
- 2 days/yr
Risk factors via First Street. Map © Google.
Why this score? — see what drove the C grade
The composite is a weighted blend of 9 inputs, each scored 0–100. Each bar is that input's sub-score; the figure is the points it added to the 100-point composite (weight × sub-score).
- Cash flow +18.1/30.0
- ARV discount +15.0/15.0
- DSCR +5.7/10.0
- 1% rule +4.0/10.0
- Livability +3.8/5.0
- Rent growth +3.3/5.0
- Schools +3.2/10.0
- Condition / age +2.5/5.0
- Appreciation +0.0/10.0
$129,900
🖨 Deal sheet 📄 Offer letter ✓ Due diligence
Listing remarks
Charming and full of curb appeal, this updated home is the perfect turnkey investment opportunity! Featuring attractive exterior appeal and thoughtful updates throughout, this property is already generating reliable income with a tenant in place at $1,309/month through 08/31/2026.Investors will appreciate the stability of immediate cash flow without the hassle of finding a tenant, while the home itself offers long-term appeal with its inviting character. Whether you're looking to expand your rental portfolio or secure an investment property, this one checks all the boxes.
Key facts
- 6,970 sq ft lot
- Built 1942
- Listed 3 days
Property features AI
Exterior
- Utilities: Public water; Public sewer
- Home design: Single family residence; One story
- Construction: 0.16-acre lot
- Exterior features: Subdivision: Melrose Place
Interior
- Bathrooms: 1 full bathroom
- Heating & cooling: Central heating; Central air; Window air conditioning units
- Interior features: Basement
Neighborhood map
What this means for you Summary
Snapshot
- This is a 2-bed/1.0-bath single-family listed at $130k.
Deal economics
- At list price, monthly cash flow is $113 ($1k/yr) — positive.
- The deal already cash-flows at list — no discount required.
- To meet the 1% rule (rent ≥ 1% of price), the offer needs to be $117k (9.8% below list).
- Recommended offer: $117k (9.8% below list) — sets the bar for 1% rule.
- Cap rate 7.3% vs local median 4.6% in Springfield — top-decile yield for the area; either an underpriced asset or a hidden risk that comps aren't pricing in. Stress-test before assuming the spread holds.
Location & tenants
- Location reads 75/100 on livability (#57 in MO, #4,121 nationally) — a middle-class / working-renter tenant base. Strengths: commute A+, cost of living A+, housing A+; Watch: crime F, employment F.
- Springfield R-XII (urban): math 32% / reading 46% proficiency, ranked #174 of 324 in MO (top 54%) — families likely to look elsewhere, expect single-tenant / working-renter base with shorter leases.
- Zoned schools: Delaware Elem. (math 27% / reading 37%, grade F, #761 of 1,115 statewide, top 72%, 303 students, 66% FRL); Jarrett Middle (math 19% / reading 40%, grade F, #291 of 391 statewide, top 76%, 445 students, 70% FRL); Parkview High (math 11% / reading 40%, grade F, #433 of 521 statewide, top 83%, 1,234 students, 62% FRL) — zoned schools average 66% FRL vs 46% district-wide (20 pts higher); higher-poverty schools than district average — tighter screening recommended.
- Market conditions: Rents rising (+3.2%/yr); 260 active listings in the ZIP; 21 comparable units currently listed for rent nearby; rentals lingering (median 44d on market — plan ~5-8 weeks vacancy on turnover, expect pricing pressure); 52% of comp listings sitting > 30 days — soft ceiling on asking rent; 1,302 units permitted in Greene County in 2024 (250 in 5+ unit buildings).
Forward outlook
- Local home prices are declining (-3.0%/yr); year-one equity from $898 of loan paydown is wiped out by about $4k of value loss. Plan a longer hold.
- Greene County population projected at +25% by 2050 — long-run rental-demand tailwind backs the buy-and-hold thesis.
Negotiation context
- Only 3 days on market — expect competitive offers; lowballing is unlikely to land.
- 2 sale attempts since 4y ago with the ask held roughly flat each time — persistent listings suggest the price (not the market) is what's stuck; bring a comps-based counter.
Risks & watch-outs
- Watch-outs: built in 1942 — expect roof / HVAC / electrical / plumbing capex.
- Climate carrying-cost: extreme-heat days projected 7→19/yr by 2055 (HVAC capex compounding) — expect insurance premiums to compound above CPI over the hold.
Questions for the listing agent
- Built in 1942 — when were the roof, HVAC, electrical panel, plumbing, and water heater last replaced?
- Is there a deadline driving the sale (1031 exchange, divorce, estate, relocation)? That informs how much negotiation room exists.
- Crime grade is F in this area — have there been break-ins, vandalism, or insurance claims at this property in the last 3 years? What carrier currently insures it and at what premium?
- What's the average days-on-market for RENTAL listings here right now (not sales)? A rising rental-DOM trend means longer vacancies and softer asking-rent achievability than the comps imply.
- What's the recent tenant-quality profile in this submarket — average credit score on applications, eviction rate, late-payment / NSF rate, and stable-employment percentage? A property-management company in the area should have these aggregated.
- How much new for-sale + rental construction is in the pipeline within 1–3 miles? Heavy new supply typically softens prices + rents 12–24 months out; constrained supply supports both.
Investment metrics
- 1% rule
- 0.90% ✗
- Cap rate
- 7.34%
- Cash-on-cash
- 3.73%
- DSCR
- 1.17
- GRM
- 9.2
CMA / ARV
- ARV (median comp)
- $168,450
- List price
- $129,900
- Delta
- -22.89%
- Verdict
- UNDERPRICED
- Comps
- 20 within 1.0 mi
Show comp detail 9 sales within ~0.75 mi
| Address | Dist | Beds/Ba | Sqft | Sold | Price | $/sf | Match |
|---|---|---|---|---|---|---|---|
| 1500 E Lindberg St | 0.14mi | 2/1.0 | 800 (-0%) | 2mo | $149,900 | $187 | 92 |
| 1506 E Lindberg St | 0.15mi | 2/1.0 | 800 (-0%) | 8mo | $189,900 | $237 | 86 |
| 1513 E Mcgee St | 0.17mi | 2/1.0 | 768 (-4%) | 3mo | $155,000 | $202 | 83 |
| 1619 E Cherokee St | 0.36mi | 2/1.0 | 792 (-1%) | 3mo | $110,000 | $139 | 78 |
| 1426 E Whiteside St | 0.07mi | 2/1.0 | 840 (+5%) | 13mo | $112,000 | $133 | 78 |
| 1429 E Mcgee St | 0.09mi | 2/1.0 | 768 (-4%) | 13mo | $155,000 | $202 | 78 |
| 1247 E University St | 0.53mi | 2/1.0 | 772 (-4%) | 18mo | $160,000 | $207 | 54 |
| 1348 E Stanford St | 0.55mi | 2/1.0 | 910 (+14%) | 3mo | $169,000 | $186 | 49 |
| 1951 S Maryland Ave | 0.55mi | 2/2.0 | 884 (+10%) | 17mo | $169,500 | $192 | 39 |
Match score weights: distance 35% · size 25% · config 20% · recency 20%. Top-matched comps best support the ARV.
Projected returns pro-forma
-3.0% appreciation · 3.23% rent growth · sell at horizon
- IRR
- -10.2%
- Equity multiple
- 0.63×
- Total profit
- $-13,604
- Equity at exit
- $19,369
- IRR
- -0.6%
- Equity multiple
- 0.96×
- Total profit
- $-1,586
- Equity at exit
- $11,231
Cash invested: $36,372 (down + closing). Projections, not guarantees.
Landlord ↔ Tenant lean methodology
- Overall (STATE)
- 81 Strongly Landlord-Friendly
- State Missouri
- 81 Strongly Landlord-Friendly · R+10
- County
- — inherits STATE
- City
- — inherits STATE
ZIP-level market 65804
- Rents YoY
- 3.2%
- Active inventory
- 260
- Price-to-rent
- 9.2×
Monthly cashflow live
- Estimated rent
- $1,171 high interval (Pro) →
- Mortgage (P&I)
- −$681
- Tax from tax record
- −$77 /mo · $920/yr
- Insurance
- −$54
- HOA
- −$0
- Vacancy / Maint / Mgmt
- −$246
- Net cashflow
- $113
Break-even live
UW: 25.0% down · 7.5% · 30yr · 1.5% tax · 5.0% vac · 8.0% maint · 8.0% mgmt
Financing live
Cash to close
- Down payment
- $32,475
- Closing costs
- $3,897
- Reserves months
- —
- Total cash needed
- —
Loan-product check · same deal, 3 products live
Conventional
25% down · 7.5% · 30yr
- Down + closing
- —
- Monthly P&I
- —
- Monthly cashflow
- —
- DSCR
- —
- Eligible?
- —
Personal DTI + credit; lowest rate.
DSCR
20% down · 8.5% · 30yr
- Down + closing
- —
- Monthly P&I
- —
- Monthly cashflow
- —
- DSCR
- —
- Eligible?
- —
No personal income docs; deal must DSCR.
Hard money
10% down · 12.0% · 12mo
- Down + closing
- —
- Monthly P&I
- —
- Monthly cashflow
- —
- DSCR
- —
- Eligible?
- —
Short-term bridge; refi at stabilization.
Rent comps 21 comps
| Address | Beds | Baths | Sqft | Rent | $/sqft | DOM | Units | Dist |
|---|---|---|---|---|---|---|---|---|
| 1277 E Wayland St Springfield, MO | 3.0 | 1.0 | 992 | $1,299 | $1.31 | 23d | 1 | 0.26mi |
| 2116 S Fairway Ave Springfield, MO | 1.0–2.0 | 1.0 | 700 | $905 | $1.29 | 13d | 3 | 0.30mi |
| 2142 S Fairway Ave Springfield, MO | 1.0–2.0 | 1.0 | 700 | $795 | $1.14 | 13d | 4 | 0.30mi |
| 2051 S Kentwood Ave Unit 1 Springfield, MO | 2.0 | 1.0 | 1000 | $1,250 | $1.25 | 13d | 1 | 0.32mi |
| 2035 S Florence Ave Springfield, MO | 2.0 | 1.0 | 850 | $1,195 | $1.41 | 13d | 1 | 0.41mi |
| 1426 E University St Springfield, MO | 2.0 | 1.0 | 1000 | $1,400 | $1.40 | 44d | 1 | 0.46mi |
| 1562 S National Ave Springfield, MO | 3.0 | 1.0 | 1064 | $1,225 | $1.15 | 44d | 1 | 0.75mi |
| 1451 E Woodland St Springfield, MO | 1.0 | 1.0 | 550 | $695 | $1.26 | 44d | 1 | 0.84mi |
| 932 E Sunset St Springfield, MO | 2.0–3.0 | 2.0 | 1088 | $1,695 | $1.56 | 13d | 3 | 0.88mi |
| 2521 S Holland Ave Springfield, MO | 1.0–2.0 | 1.0–2.0 | 1034 | $1,695 | $1.64 | 44d | 1 | 1.01mi |
| 1251 E Guinevere St Unit 16 Springfield, MO | 2.0 | 2.0 | 700 | $900 | $1.29 | 44d | 1 | 1.01mi |
| 1235 E Guinevere St Unit K Springfield, MO | 2.0 | 1.5 | 1000 | $1,050 | $1.05 | 44d | 1 | 1.04mi |
| 640 E Sunset St Springfield, MO | 2.0 | 2.0 | 976 | $1,695 | $1.74 | 44d | 1 | 1.08mi |
| 2149 E Sunshine St Springfield, MO | 1.0–2.0 | 1.0–1.5 | 671 | $1,453 | $2.17 | 13d | 20 | 1.10mi |
| 2020 E Bennett St Springfield, MO | 1.0–2.0 | 1.0 | 743 | $930 | $1.25 | 44d | 6 | 1.14mi |
| 1364 E Battlefield Rd Springfield, MO | 1.0 | 1.0 | 520 | $2,729 | $5.25 | 21d | 5 | 1.21mi |
| 2072 E Bennett St Springfield, MO | 1.0–2.0 | 1.0 | 750 | $935 | $1.25 | 44d | 5 | 1.22mi |
| 2146 E Bennett St Unit 0 Springfield, MO | 2.0 | 1.0 | 1009 | $895 | $0.89 | 44d | 1 | 1.29mi |
| 2621 S Jefferson Ave Unit 323 Springfield, MO | 1.0 | 1.0 | 642 | $1,295 | $2.02 | 13d | 1 | 1.32mi |
| 2561 South Pl Unit B Springfield, MO | 2.0 | 1.0 | 884 | $850 | $0.96 | 23d | 1 | 1.33mi |
| 1228 E Belmont St Springfield, MO | 1.0–2.0 | 1.0 | 802 | $930 | $1.16 | 44d | 1 | 1.48mi |
Listing history 6 events
-
2026-05-18status Pending 578-char remark
-
2026-05-14$129,900 Active 578-char remark
-
2022-04-17price $1,150
-
2022-01-25$129,900
-
2021-06-15soldstatus
-
2021-04-30soldstatus
ⓘ Source: listings_history table (triggers on properties + properties_extension) + one-shot
backfill from property_details.listing_events for pre-trigger history.
Tax reassessment forecast MO · Resets to sale price
- Current annual tax
- $920 · $77/mo
- Projected year-2 tax
- $1,260 · $105/mo
- Expected delta
- +$340/yr (+$28/mo · 37.0%)
ⓘ Screening estimate from a state-policy table — verify with the county assessor before closing.
Climate risk First Street
- Flood 1/10 Low FEMA zone X (unshaded) · 0% chance over 30 yrs
- Wildfire 1/10 Low
- Heat 5/10 Major 7 d/yr ≥105°F today · 19 d/yr by 30 yrs out
- Wind 2/10 Low
- Air quality 2/10 Low 1 unhealthy d/yr today · 2 by 30 yrs out
Nearby sold comps map
Loading sold comps map…
Walkable amenities ~0.75 mi
Loading nearby amenities…
Taxation est. · year 1
- Rental income
- $14,053
- − Mortgage interest
- −$7,276
- − Property taxes
- −$920
- − Insurance
- −$650
- − Repairs & maintenance
- −$1,124
- − Management
- −$1,124
- − Depreciation
- −$3,779
- Taxable loss
- −$820
- Est. tax savings @ 24.0%
- +$197
- After-tax cash flow
- $1,555/yr
For passive investors: Depreciation is non-cash, so a rental often shows a tax loss while cash-flowing — sheltering income. Rental losses are passive: they offset passive income freely, and up to $25,000/yr can offset ordinary (W-2) income if you actively participate and your MAGI is under $100k (phasing out to $0 by $150k); unused losses carry forward. On sale, claimed depreciation is recaptured at up to 25%, and gains may owe capital-gains tax (a 1031 exchange can defer both). Figures are a year-1 estimate at your 24.0% rate — not tax advice; consult a CPA.
Schools (NCES district)
- District
- Springfield R-XII
- NCES district ID
- 2928860
- Math proficiency
- 32% ▼ -2.00%
- Reading proficiency
- 46% ▼ -3.00%
- Median HH income
- $37,886
- Composite
- 32.45/100
- National rank
- #5717
- State rank
- #174 of 324 in MO
Livability — Springfield
- Score
- 75/100
- State rank
- #57
- US rank
- #4121
Category grades
Schools grade is shown separately in the Schools card above.
Census & demographics
- Census place
- Springfield, MO
- County
- Greene County · 244,327 people
- City population
- 223,044
- Metro
- Springfield, MO
- Population (ZIP)
- 40,935
- Household income
- $62,301
- Rent vs Own
- Severe rent burden
- 1412.0
Population outlook (Greene County) Hauer SSP2
- Today (2025)
- 319,054 people
- By 2030
- 335,135 · +5.0%
- By 2040
- 366,186 · +14.8%
- By 2050
- 397,431 · +24.6%
- By 2075
- 477,035 · +49.5%
- By 2100
- 520,828 · +63.2%
Race, ethnicity, and origin ACS 2023
- Neighborhood character
- Predominantly White (87%)
- Race & ethnicity
- White 87% Two or more races 5% Hispanic / Latino 4% Black 2% Asian 2%
- Common ancestry
- Italian 3% Lithuanian 3% Slovak 3%
- Foreign-born
- 3% · Canada, South Korea
- Languages at home
- 95% English-only · Spanish 2% Other Indo-European 1%
Political lean MEDSL · Greene
- 2024 margin
- Strong R (+20.8) · D 38.9% · R 59.7% · Other 1.4%
- 2008→2024 swing
- -5.0pp toward R · 2008: -15.8pp · 2024: -20.8pp
- All cycles
- 2024: R+20.8 2020: R+20.1 2016: R+27.4 2012: R+24.4 2008: R+15.8
Not yet ingested
- Civics
- —
Market trends
- HPI YoY
- ▼ -271.81%
- Current HPI
- 197.8418
- Rent YoY
- ▲ 3.23%
- Metro
- Springfield, MO
- State GDP YoY
- ▲ 1.84%
- F500 in state
- 20
Industry mix (Fortune 500 HQ in MO)
| Industry | F500 HQs | Revenue |
|---|---|---|
| Healthcare | 1 | $163B |
|
||
| Insurance | 1 | $21B |
|
||
| Industrial Technology | 1 | $17B |
|
||
| Retail | 1 | $16B |
|
||
| Industrial Distribution | 1 | $10B |
|
||
| Utilities | 1 | $9B |
|
||
Price history
+0.0% since first listed6 events — show timeline
- 2026-05-18 Pending — SOMO
- 2026-05-14 Listed $129,900 SOMO
- 2022-04-17 Price Changed $1,150 RENT.
- 2022-01-25 Listed $129,900 SOMO
- 2021-06-15 Sold (Public Records) — Public Records
- 2021-04-30 Sold (Public Records) — Public Records
Property tax history
+9.3%/yrLatest (2025): $920 · +3.3% YoY. Source: county tax records.
Cash-flow waterfall
monthlySold comps — $/sqft
last 12 mo · ≤1 miLoading sold comps…