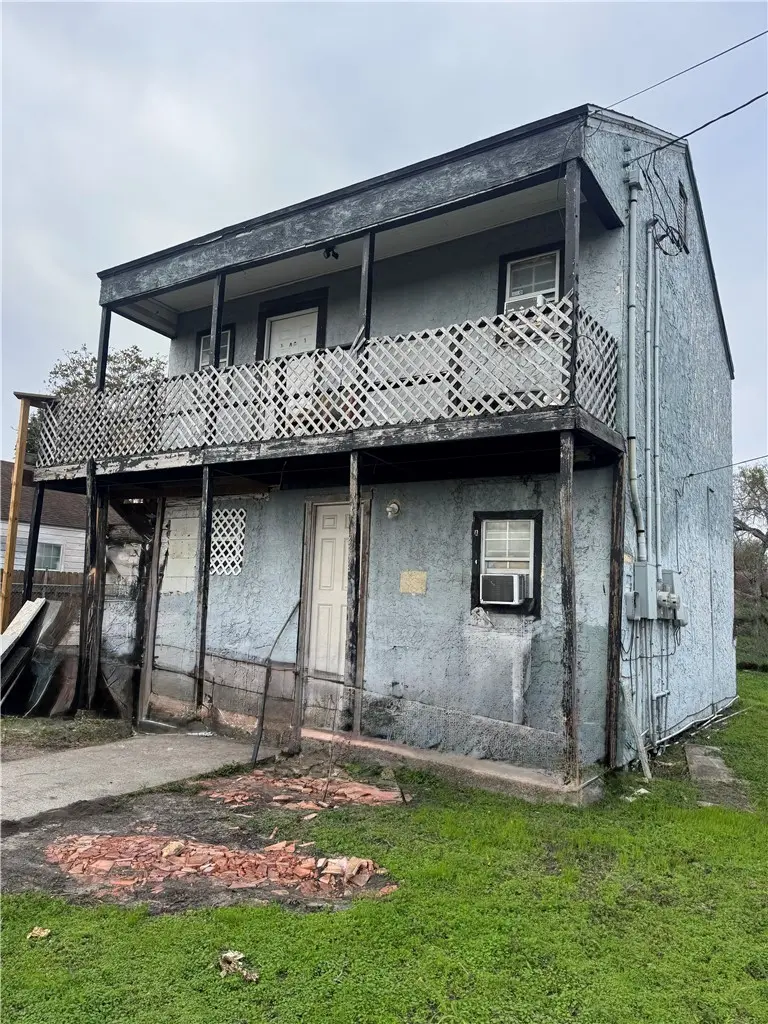
1601 15th St · Corpus Christi, TX
Flood risk 1/10 · Minimal
- FEMA flood zone
- X (unshaded)
- Chance of flooding over 30 yrs
- 0.0%
- Est. flood insurance / yr
- $507 – $1,088
Fire risk 1/10 · Minimal
- Est. fire insurance / yr
- $1,222 – $2,270
Heat risk 10/10 · Severe
- Hot days now (above 107°F)
- 7 days/yr
- Hot days in 30 yrs
- 26 days/yr
Wind risk 9/10 · Severe
- Chance of severe wind over 30 yrs
- 99.0%
Air-quality risk 1/10 · Minimal
- Unhealthy air days now
- 0 days/yr
- Unhealthy air days in 30 yrs
- 0 days/yr
Risk factors via First Street. Map © Google.
Why this score? — see what drove the C+ grade
The composite is a weighted blend of 9 inputs, each scored 0–100. Each bar is that input's sub-score; the figure is the points it added to the 100-point composite (weight × sub-score).
- Cash flow +26.4/30.0
- DSCR +9.0/10.0
- ARV discount +7.5/15.0
- 1% rule +7.1/10.0
- Livability +3.9/5.0
- Rent growth +3.0/5.0
- Schools +2.8/10.0
- Condition / age +2.5/5.0
- Appreciation +0.0/10.0
$107,500
🖨 Deal sheet 📄 Offer letter ✓ Due diligence
Listing remarks MLS
$10,000 in Seller Concessions!!INVESTOR SPECIAL!!! WANT MONTHLY PASSIVE INCOME??? Both Living Spaces Offer- 1 Bedroom, 1 Full Bath, Kitchen and Living Room. The back Garage was converted into a 2 Bedroom, 1 Full Bath and Kitchen. Only about 3 Minutes from DEL MAR COLLEGE (East Campus) and 5 Minutes from COLE PARK. Property is being SOLD AS IS.
Key facts
- Built 1940
- Listed 171 days
Neighborhood map
What this means for you Summary
Snapshot
- This is a 1-bed/1.0-bath townhouse listed at $108k.
Deal economics
- At list price, monthly cash flow is $281 ($3k/yr) — positive.
- The deal already cash-flows at list — no discount required.
- Meets the 1% rule at list price ($1k rent vs $108k).
- Recommended offer: $95k (12.0% below list) — sets the bar for market timing.
- Cap rate 9.4% vs local median 3.6% in Corpus Christi — top-decile yield for the area; either an underpriced asset or a hidden risk that comps aren't pricing in. Stress-test before assuming the spread holds.
Location & tenants
- Location reads 78/100 on livability (#66 in TX, #2,404 nationally) — a middle-class / working-renter tenant base. Strengths: commute A+, cost of living A+, housing A+; Watch: crime F.
- Corpus Christi ISD (urban): math 31% / reading 35% proficiency, ranked #562 of 826 in TX (top 68%) — families likely to look elsewhere, expect single-tenant / working-renter base with shorter leases; 63% free/reduced lunch — lower-income household profile, screen leases tightly.
- Market conditions: Rents rising (+1.9%/yr); 141 active listings in the ZIP; 22 comparable units currently listed for rent nearby; rentals at typical pace (median 22d on market — plan ~3-4 weeks tenant-placement turnaround); 45% of comp listings sitting > 30 days — soft ceiling on asking rent; 1,397 units permitted in Nueces County in 2024 (47 in 5+ unit buildings).
Forward outlook
- Local home prices are declining (-3.0%/yr); year-one equity from $743 of loan paydown is wiped out by about $3k of value loss. Plan a longer hold.
- Nueces County population projected at +36% by 2050 — long-run rental-demand tailwind backs the buy-and-hold thesis.
Negotiation context
- It's been on market 171 days — a 12% lower offer ($95k) is reasonable based on typical stale-listing flexibility.
- 7 sale attempts since 29y ago; this cycle's ask has dropped $36k (25%) from the opening price — seller is motivated, your offer sets the floor, not the list.
- Current owner paid $36k; list at $108k implies a 199% gain — meaningful room to come down on a strong offer.
Risks & watch-outs
- Watch-outs: built in 1940 — expect roof / HVAC / electrical / plumbing capex.
- Climate carrying-cost: severe wind risk, 99% chance of damaging wind over 30y; extreme-heat days projected 7→26/yr by 2055 (HVAC capex compounding) — expect insurance premiums to compound above CPI over the hold.
Questions for the listing agent
- It's been on market 171 days. Have you received any prior offers? Is the seller open to a 12% concession, seller financing, or rate buy-down credit?
- Built in 1940 — when were the roof, HVAC, electrical panel, plumbing, and water heater last replaced?
- Why hasn't it sold? Are there any deal-killer items the seller is aware of (foundation, flood, title, zoning, code violations)?
- Is there a deadline driving the sale (1031 exchange, divorce, estate, relocation)? That informs how much negotiation room exists.
- Crime grade is F in this area — have there been break-ins, vandalism, or insurance claims at this property in the last 3 years? What carrier currently insures it and at what premium?
- What's the average days-on-market for RENTAL listings here right now (not sales)? A rising rental-DOM trend means longer vacancies and softer asking-rent achievability than the comps imply.
- What's the recent tenant-quality profile in this submarket — average credit score on applications, eviction rate, late-payment / NSF rate, and stable-employment percentage? A property-management company in the area should have these aggregated.
- How much new for-sale + rental construction is in the pipeline within 1–3 miles? Heavy new supply typically softens prices + rents 12–24 months out; constrained supply supports both.
Investment metrics
- 1% rule
- 1.21% ✓
- Cap rate
- 9.43%
- Cash-on-cash
- 11.19%
- DSCR
- 1.50
- GRM
- 6.9
CMA / ARV
- ARV (median comp)
- $267,677
- List price
- $107,500
- Delta
- -59.84%
- Verdict
- UNDERPRICED
- Comps
- 17 within 1.0 mi
Projected returns pro-forma
-3.0% appreciation · 1.87% rent growth · sell at horizon
- IRR
- -0.9%
- Equity multiple
- 0.97×
- Total profit
- $-985
- Equity at exit
- $16,029
- IRR
- 7.6%
- Equity multiple
- 1.54×
- Total profit
- $16,378
- Equity at exit
- $9,295
Cash invested: $30,100 (down + closing). Projections, not guarantees.
Landlord ↔ Tenant lean methodology
- Overall (STATE)
- 87 Strongly Landlord-Friendly
- State Texas
- 87 Strongly Landlord-Friendly · R+5
- County
- — inherits STATE
- City
- — inherits STATE
ZIP-level market 78404
- Rents YoY
- 1.9%
- Active inventory
- 141
- Price-to-rent
- 6.9×
Monthly cashflow live
- Estimated rent
- $1,303 high interval (Pro) →
- Mortgage (P&I)
- −$564
- Tax from tax record
- −$140 /mo · $1,685/yr
- Insurance
- −$45
- HOA
- −$0
- Vacancy / Maint / Mgmt
- −$274
- Net cashflow
- $281
Break-even live
UW: 25.0% down · 7.5% · 30yr · 1.5% tax · 5.0% vac · 8.0% maint · 8.0% mgmt
Financing live
Cash to close
- Down payment
- $26,875
- Closing costs
- $3,225
- Reserves months
- —
- Total cash needed
- —
Loan-product check · same deal, 3 products live
Conventional
25% down · 7.5% · 30yr
- Down + closing
- —
- Monthly P&I
- —
- Monthly cashflow
- —
- DSCR
- —
- Eligible?
- —
Personal DTI + credit; lowest rate.
DSCR
20% down · 8.5% · 30yr
- Down + closing
- —
- Monthly P&I
- —
- Monthly cashflow
- —
- DSCR
- —
- Eligible?
- —
No personal income docs; deal must DSCR.
Hard money
10% down · 12.0% · 12mo
- Down + closing
- —
- Monthly P&I
- —
- Monthly cashflow
- —
- DSCR
- —
- Eligible?
- —
Short-term bridge; refi at stabilization.
Rent comps 22 comps
| Address | Beds | Baths | Sqft | Rent | $/sqft | DOM | Units | Dist |
|---|---|---|---|---|---|---|---|---|
| 1634 14th St Corpus Christi, TX | 2.0 | 1.5 | 980 | $1,090 | $1.11 | 44d | 1 | 0.13mi |
| 1628 18th St Corpus Christi, TX | 2.0 | 1.0 | 1112 | $1,000 | $0.90 | 44d | 1 | 0.15mi |
| 2622 Cloyde St Corpus Christi, TX | 2.0 | 1.0 | 1693 | $1,150 | $0.68 | 44d | 1 | 0.38mi |
| 1318 6th St Corpus Christi, TX | 2.0 | 1.0 | 900 | $900 | $1.00 | 14d | 1 | 0.55mi |
| 455 Louisiana Ave Corpus Christi, TX | 2.0 | 1.0 | 1528 | $3,000 | $1.96 | 21d | 1 | 0.73mi |
| 2402 Segrest St Corpus Christi, TX | 2.0 | 1.0 | 1120 | $825 | $0.74 | 21d | 1 | 0.74mi |
| 826 Hancock Ave Unit 2 Corpus Christi, TX | 2.0 | 1.0 | 1000 | $950 | $0.95 | 21d | 1 | 0.76mi |
| 305 Atlantic St Unit B Corpus Christi, TX | 1.0 | 1.0 | 1756 | $1,275 | $0.73 | 44d | 1 | 0.76mi |
| 801 S Alameda St Unit A Corpus Christi, TX | 2.0 | 1.0 | 1760 | $900 | $0.51 | 44d | 1 | 0.77mi |
| 443 Indiana Ave Corpus Christi, TX | 2.0 | 1.0 | 968 | $1,650 | $1.70 | 44d | 1 | 0.85mi |
| 1117 Ocean Dr Unit B Corpus Christi, TX | 2.0 | 1.0 | 1543 | $3,000 | $1.94 | 44d | 1 | 0.86mi |
| 522 Hancock Ave Unit 1-319 Corpus Christi, TX | 2.0 | 2.0 | 1133 | $1,625 | $1.43 | 21d | 1 | 0.90mi |
| 522 Hancock Ave Corpus Christi, TX | 1.0–2.0 | 1.0–2.0 | 915 | $1,515 | $1.65 | 14d | 10 | 0.91mi |
| 823 S Water St Corpus Christi, TX | 2.0 | 2.0 | 1243 | $2,000 | $1.61 | 14d | 1 | 0.98mi |
| 802 S Carancahua St Corpus Christi, TX | 2.0 | 1.0–2.0 | 869 | $1,260 | $1.45 | 14d | 68 | 0.98mi |
| 332 Rosebud Ave Corpus Christi, TX | 2.0 | 1.0 | 942 | $1,150 | $1.22 | 21d | 1 | 0.99mi |
| 715 S Upper Broadway St Corpus Christi, TX | 1.0 | 1.0–1.5 | 772 | $1,650 | $2.14 | 21d | 2 | 1.02mi |
| 715 S Upper Broadway #903 Corpus Christi, TX | 1.0 | 1.5 | 892 | $1,700 | $1.91 | 44d | 1 | 1.02mi |
| 309 Rosebud Ave Unit D Corpus Christi, TX | 2.0 | 1.0 | 882 | $1,100 | $1.25 | 21d | 1 | 1.04mi |
| 2837 Santa Fe St Unit 2 Corpus Christi, TX | 2.0 | 1.0 | 1030 | $1,300 | $1.26 | 14d | 1 | 1.07mi |
| 238 Watson St Unit B Corpus Christi, TX | 1.0 | 1.0 | 1411 | $800 | $0.57 | 44d | 1 | 1.13mi |
| 3102 Santa Fe St Corpus Christi, TX | 1.0–2.0 | 1.0–2.0 | 922 | $695 | $0.75 | 44d | 1 | 1.46mi |
Listing history 32 events
-
2026-06-18days on market $107,500 Active 171 DOM
-
2026-06-17days on market $107,500 Active 170 DOM
-
2026-06-16days on market $107,500 Active 169 DOM
-
2026-06-15days on market $107,500 Active 168 DOM
-
2026-06-14days on market $107,500 Active 166 DOM
-
2026-06-10days on market $107,500 Active 163 DOM
-
2026-06-09days on market $107,500 Active 162 DOM
-
2026-06-08days on market $107,500 Active 161 DOM
-
2026-06-07days on market $107,500 Active 160 DOM
-
2026-06-05days on market $107,500 Active 157 DOM
-
2026-06-03days on market $107,500 Active 156 DOM
-
2026-06-02days on market $107,500 Active 155 DOM
-
2026-06-01days on market $107,500 Active 154 DOM
-
2026-05-31days on market $107,500 Active 153 DOM
-
2026-05-30days on market $107,500 Active 152 DOM
-
2026-05-15status Active 345-char remark
Show marketing remark (345 chars)
$10,000 in Seller Concessions!!INVESTOR SPECIAL!!! WANT MONTHLY PASSIVE INCOME??? Both Living Spaces Offer- 1 Bedroom, 1 Full Bath, Kitchen and Living Room. The back Garage was converted into a 2 Bedroom, 1 Full Bath and Kitchen. Only about 3 Minutes from DEL MAR COLLEGE (East Campus) and 5 Minutes from COLE PARK. Property is being SOLD AS IS.
-
2026-05-01status Pending 345-char remark
Show marketing remark (345 chars)
$10,000 in Seller Concessions!!INVESTOR SPECIAL!!! WANT MONTHLY PASSIVE INCOME??? Both Living Spaces Offer- 1 Bedroom, 1 Full Bath, Kitchen and Living Room. The back Garage was converted into a 2 Bedroom, 1 Full Bath and Kitchen. Only about 3 Minutes from DEL MAR COLLEGE (East Campus) and 5 Minutes from COLE PARK. Property is being SOLD AS IS.
-
2026-04-09price $107,500 345-char remark
Show marketing remark (345 chars)
$10,000 in Seller Concessions!!INVESTOR SPECIAL!!! WANT MONTHLY PASSIVE INCOME??? Both Living Spaces Offer- 1 Bedroom, 1 Full Bath, Kitchen and Living Room. The back Garage was converted into a 2 Bedroom, 1 Full Bath and Kitchen. Only about 3 Minutes from DEL MAR COLLEGE (East Campus) and 5 Minutes from COLE PARK. Property is being SOLD AS IS.
-
2026-03-19price $130,000 345-char remark
Show marketing remark (345 chars)
$10,000 in Seller Concessions!!INVESTOR SPECIAL!!! WANT MONTHLY PASSIVE INCOME??? Both Living Spaces Offer- 1 Bedroom, 1 Full Bath, Kitchen and Living Room. The back Garage was converted into a 2 Bedroom, 1 Full Bath and Kitchen. Only about 3 Minutes from DEL MAR COLLEGE (East Campus) and 5 Minutes from COLE PARK. Property is being SOLD AS IS.
-
2026-02-20price $142,000 345-char remark
Show marketing remark (345 chars)
$10,000 in Seller Concessions!!INVESTOR SPECIAL!!! WANT MONTHLY PASSIVE INCOME??? Both Living Spaces Offer- 1 Bedroom, 1 Full Bath, Kitchen and Living Room. The back Garage was converted into a 2 Bedroom, 1 Full Bath and Kitchen. Only about 3 Minutes from DEL MAR COLLEGE (East Campus) and 5 Minutes from COLE PARK. Property is being SOLD AS IS.
-
2025-12-15$143,000 Active 345-char remark
Show marketing remark (345 chars)
$10,000 in Seller Concessions!!INVESTOR SPECIAL!!! WANT MONTHLY PASSIVE INCOME??? Both Living Spaces Offer- 1 Bedroom, 1 Full Bath, Kitchen and Living Room. The back Garage was converted into a 2 Bedroom, 1 Full Bath and Kitchen. Only about 3 Minutes from DEL MAR COLLEGE (East Campus) and 5 Minutes from COLE PARK. Property is being SOLD AS IS.
-
2021-06-23soldstatus
-
2017-11-09soldstatus
-
2013-05-27$74,500
-
2008-06-05$79,900
-
2008-04-21soldstatus
-
2004-07-21soldstatus
-
2003-09-05soldstatus $36,000
-
2001-04-19$47,500
-
1998-10-16soldstatus
-
1998-03-01$28,500
-
1997-03-26$27,900
ⓘ Source: listings_history table (triggers on properties + properties_extension) + one-shot
backfill from property_details.listing_events for pre-trigger history.
Tax reassessment forecast TX · Resets to sale price
- Current annual tax
- $1,685 · $140/mo
- Projected year-2 tax
- $1,967 · $164/mo
- Expected delta
- +$282/yr (+$24/mo · 16.8%)
ⓘ Screening estimate from a state-policy table — verify with the county assessor before closing.
Climate risk First Street
- Flood 1/10 Low FEMA zone X (unshaded) · 0% chance over 30 yrs
- Wildfire 1/10 Low
- Heat 10/10 Extreme 7 d/yr ≥107°F today · 26 d/yr by 30 yrs out
- Wind 9/10 Extreme 99% chance of damaging wind over 30 yrs
- Air quality 1/10 Low 0 unhealthy d/yr today · 0 by 30 yrs out
Nearby sold comps map
Loading sold comps map…
Walkable amenities ~0.75 mi
Loading nearby amenities…
Taxation est. · year 1
- Rental income
- $15,640
- − Mortgage interest
- −$6,022
- − Property taxes
- −$1,685
- − Insurance
- −$538
- − Repairs & maintenance
- −$1,251
- − Management
- −$1,251
- − Depreciation
- −$3,127
- Taxable income
- $1,766
- Est. tax owed @ 24.0%
- −$424
- After-tax cash flow
- $2,944/yr
For passive investors: Depreciation is non-cash, so a rental often shows a tax loss while cash-flowing — sheltering income. Rental losses are passive: they offset passive income freely, and up to $25,000/yr can offset ordinary (W-2) income if you actively participate and your MAGI is under $100k (phasing out to $0 by $150k); unused losses carry forward. On sale, claimed depreciation is recaptured at up to 25%, and gains may owe capital-gains tax (a 1031 exchange can defer both). Figures are a year-1 estimate at your 24.0% rate — not tax advice; consult a CPA.
Schools (NCES district)
- District
- Corpus Christi ISD
- NCES district ID
- 4815270
- Math proficiency
- 31% ▼ -18.00%
- Reading proficiency
- 35% ▼ -7.00%
- Median HH income
- $45,672
- Composite
- 28.27/100
- National rank
- #6793
- State rank
- #562 of 826 in TX
Livability — Corpus Christi
- Score
- 78/100
- State rank
- #66
- US rank
- #2404
Category grades
Schools grade is shown separately in the Schools card above.
Census & demographics
- Census place
- Corpus Christi, TX
- County
- Nueces County · 296,836 people
- City population
- 296,836
- Metro
- Corpus Christi, TX
- Population (ZIP)
- 12,635
- Household income
- $61,280
- Rent vs Own
- Severe rent burden
- 596.0
Population outlook (Nueces County) Hauer SSP2
- Today (2025)
- 418,037 people
- By 2030
- 447,123 · +7.0%
- By 2040
- 505,911 · +21.0%
- By 2050
- 567,522 · +35.8%
- By 2075
- 729,686 · +74.6%
- By 2100
- 847,087 · +102.6%
Race, ethnicity, and origin ACS 2023
- Neighborhood character
- Majority Hispanic (62%)
- Race & ethnicity
- Hispanic / Latino 62% White 32% Two or more races 29% Black 4%
- Hispanic origin (detail)
- Mexican 56%
- Common ancestry
- Slovak 3% Italian 2% Lithuanian 1%
- Foreign-born
- 9% · Canada
- Languages at home
- 61% English-only · Spanish 39%
Political lean MEDSL · Nueces
- 2024 margin
- R (+11.5) · D 43.8% · R 55.3%
- 2008→2024 swing
- -7.1pp toward R · 2008: -4.4pp · 2024: -11.5pp
- All cycles
- 2024: R+11.5 2020: R+2.9 2016: R+1.5 2012: R+3.2 2008: R+4.4
Not yet ingested
- Civics
- —
Market trends
- HPI YoY
- ▼ -211.10%
- Current HPI
- 177.4759
- Rent YoY
- ▲ 1.87%
- Metro
- Corpus Christi, TX
- State GDP YoY
- ▲ 3.95%
- F500 in state
- 110
Industry mix (Fortune 500 HQ in TX)
| Industry | F500 HQs | Revenue |
|---|---|---|
| Energy | 16 | $1,198B |
|
||
| Technology | 5 | $198B |
|
||
| Engineering / Construction | 4 | $72B |
|
||
| Energy Services | 3 | $60B |
|
||
| Utilities | 3 | $41B |
|
||
| Healthcare | 2 | $330B |
|
||
Price history
+285.3% since first listed17 events — show timeline
- 2026-05-15 Relisted — CBMLS
- 2026-05-01 Pending — CBMLS
- 2026-04-09 Price Changed $107,500 CBMLS
- 2026-03-19 Price Changed $130,000 CBMLS
- 2026-02-20 Price Changed $142,000 CBMLS
- 2025-12-15 Listed $143,000 CBMLS
- 2021-06-23 Sold (Public Records) — Public Records
- 2017-11-09 Sold (Public Records) — Public Records
- 2013-05-27 Listed $74,500 CBMLS
- 2008-06-05 Listed $79,900 CBMLS
- 2008-04-21 Sold (Public Records) — Public Records
- 2004-07-21 Sold (Public Records) — Public Records
- 2003-09-05 Sold (Public Records) $36,000 Public Records
- 2001-04-19 Listed $47,500 CBMLS
- 1998-10-16 Sold (MLS) — CBMLS
- 1998-03-01 Listed $28,500 CBMLS
- 1997-03-26 Listed $27,900 CBMLS
Property tax history
+0.6%/yrLatest (2025): $1,685 · -10.7% YoY. Source: county tax records.
Cash-flow waterfall
monthlySold comps — $/sqft
last 12 mo · ≤1 miLoading sold comps…