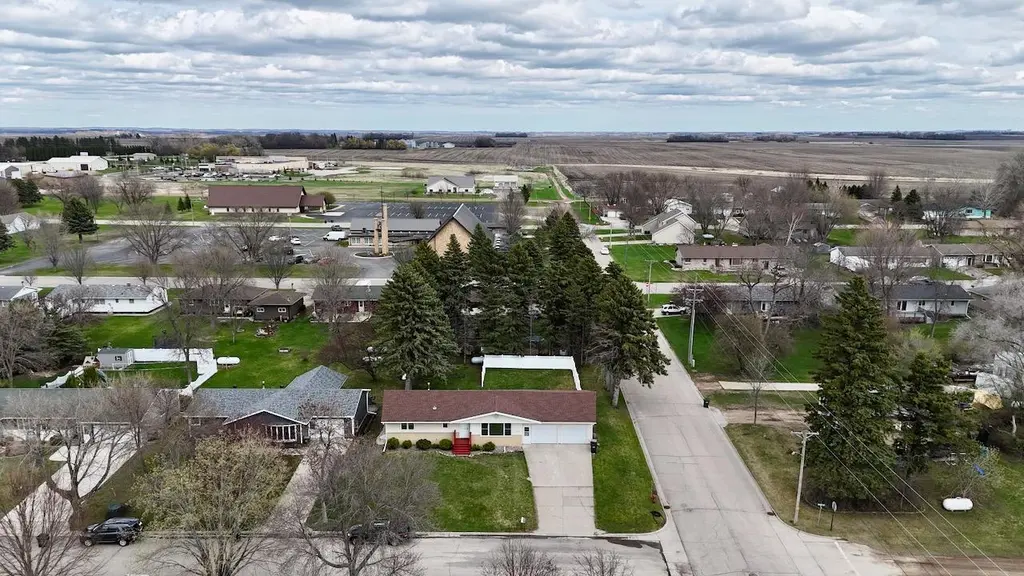
219 9th Ave SE · Elbow Lake, MN
Flood risk 1/10 · Minimal
- FEMA flood zone
- —
- Chance of flooding over 30 yrs
- 0.0%
- Est. flood insurance / yr
- —
Fire risk 1/10 · Minimal
- Est. fire insurance / yr
- $888 – $1,650
Heat risk 1/10 · Minimal
- Hot days now (above 97°F)
- 7 days/yr
- Hot days in 30 yrs
- 13 days/yr
Wind risk 2/10 · Minimal
- Chance of severe wind over 30 yrs
- —
Air-quality risk 3/10 · Minor
- Unhealthy air days now
- 3 days/yr
- Unhealthy air days in 30 yrs
- 3 days/yr
Risk factors via First Street. Map © Google.
Why this score? — see what drove the D- grade
The composite is a weighted blend of 9 inputs, each scored 0–100. Each bar is that input's sub-score; the figure is the points it added to the 100-point composite (weight × sub-score).
- Appreciation +7.6/10.0
- ARV discount +7.5/15.0
- Cash flow +7.0/30.0
- Schools +4.6/10.0
- Livability +3.8/5.0
- Rent growth +2.5/5.0
- Condition / age +2.5/5.0
- 1% rule +1.7/10.0
- DSCR +1.2/10.0
$199,000
🖨 Deal sheet 📄 Offer letter ✓ Due diligence
Listing remarks MLS
Come check out this spacious 5 bedroom, 2 bath rambler located on corner lot. Large living room looks out to Athletic’s Park. Host your loved ones with large family room in basement! Enjoy your privacy in the fenced in backyard lined with towering pines. The attached, insulated and heated garage make winters easier. Updates include a main bathroom remodel, recessed lighting throughout main level and garage storage shelving. Call for a showing today! Agent related to Seller.
Key facts
- Natural light
- Corner lot
- Quiet community
Tags
Property features AI
Exterior
- Parking: Attached garage with concrete floor; 2-car garage (24 x 26)
- Utilities: City water connected; City sewer connected; 100 amp electric service with circuit breakers; Natural gas
- Home design: Residential property; One-story home; Entry level: main; Above-grade and below-grade finished living areas included
- Construction: Frame construction; Asphalt roof; Block foundation
- Exterior features: Corner lot; Vinyl fencing; City street frontage with paved streets; Publicly maintained road
Interior
- Kitchen: Dishwasher; Microwave; Range; Refrigerator
- Bedrooms: 4 bedrooms (all on the main level)
- Bathrooms: 1 full bathroom (main floor)
- Heating & cooling: Boiler heating; Ductless mini-split and window air conditioning units
- Interior features: Dishwasher, Microwave, Range, Refrigerator; Kitchen and dining combined; Full, partially finished basement
- Laundry & utility: Laundry in basement
Neighborhood map
What this means for you Summary
Snapshot
- This is a 4-bed/1.0-bath single-family listed at $199k.
Deal economics
- At list price, monthly cash flow is $-288 ($-3k/yr) — negative.
- To cash-flow at today's rent, offer at most $148k (25.5% below list).
- To meet the 1% rule (rent ≥ 1% of price), the offer needs to be $134k (32.6% below list).
- Recommended offer: $134k (32.6% below list) — sets the bar for 1% rule.
Location & tenants
- Location reads 75/100 on livability (#188 in MN, #4,060 nationally) — a middle-class / working-renter tenant base. Strengths: crime A+, cost of living A+, housing A+; Watch: amenities F, commute F.
- West Central Area (rural): math 47% / reading 61% proficiency, ranked #80 of 301 in MN (top 27%) — acceptable for families but not a draw, mixed tenant base, ~2y average lease.
- Market conditions: 22 active listings in the ZIP; 2 units permitted in Grant County in 2024 (0 in 5+ unit buildings).
Forward outlook
- In year one you build about $12k of equity ($1k loan paydown + $10k appreciation (5.1% local appreciation)).
- Grant County population projected at -20% by 2050 — secular population decline; favor cash flow + early exit over multi-decade hold.
- By year 4, paydown + projected appreciation supports a ~$39k cash-out refi (75% LTV) — recoverable capital for the next deal without selling this one.
Negotiation context
- It's been on market 27 days — a 2% lower offer ($196k) is reasonable based on typical stale-listing flexibility.
- 6 sale attempts since 15y ago with the ask held roughly flat each time — persistent listings suggest the price (not the market) is what's stuck; bring a comps-based counter.
- Current owner paid $68k; list at $199k implies a 193% gain — meaningful room to come down on a strong offer.
Questions for the listing agent
- What do current leases actually rent for vs. the listed asking? Can we see a recent rent roll and the last 12 months of T-12 income?
- Built in 1966 — when were the roof, HVAC, electrical panel, plumbing, and water heater last replaced?
- Is there a deadline driving the sale (1031 exchange, divorce, estate, relocation)? That informs how much negotiation room exists.
- Schools are B-rated — typically a magnet for longer-tenancy family renters. What's the average tenant stay here, and is there a school-zone premium baked into asking?
- The area grade is low — what's the realistic commute time and amenity access for the typical tenant pool here? Any planned neighborhood developments (good or bad) we should know about?
- What's the average days-on-market for RENTAL listings here right now (not sales)? A rising rental-DOM trend means longer vacancies and softer asking-rent achievability than the comps imply.
- What's the recent tenant-quality profile in this submarket — average credit score on applications, eviction rate, late-payment / NSF rate, and stable-employment percentage? A property-management company in the area should have these aggregated.
- How much new for-sale + rental construction is in the pipeline within 1–3 miles? Heavy new supply typically softens prices + rents 12–24 months out; constrained supply supports both.
Investment metrics
- 1% rule
- 0.67% ✗
- Cap rate
- 4.56%
- Cash-on-cash
- -6.20%
- DSCR
- 0.72
- GRM
- 12.4
CMA / ARV
No comps found within radius.
Projected returns pro-forma
5.12% appreciation · 3.0% rent growth · sell at horizon
- IRR
- 8.0%
- Equity multiple
- 1.52×
- Total profit
- $28,937
- Equity at exit
- $114,257
- IRR
- 9.9%
- Equity multiple
- 2.84×
- Total profit
- $102,723
- Equity at exit
- $198,432
Cash invested: $55,720 (down + closing). Projections, not guarantees.
Landlord ↔ Tenant lean methodology
- Overall (STATE)
- 46 Balanced
- State Minnesota
- 46 Balanced · D+2
- County
- — inherits STATE
- City
- — inherits STATE
ZIP-level market 56531
- Home prices YoY
- 2.1%
- Active inventory
- 22
- Price-to-rent
- 12.4×
Monthly cashflow live
- Estimated rent
- $1,341 medium interval (Pro) →
- Mortgage (P&I)
- −$1,044
- Tax from tax record
- −$221 /mo · $2,650/yr
- Insurance
- −$83
- HOA
- −$0
- Vacancy / Maint / Mgmt
- −$282
- Net cashflow
- $-288
Break-even live
UW: 25.0% down · 7.5% · 30yr · 1.5% tax · 5.0% vac · 8.0% maint · 8.0% mgmt
Financing live
Cash to close
- Down payment
- $49,750
- Closing costs
- $5,970
- Reserves months
- —
- Total cash needed
- —
Loan-product check · same deal, 3 products live
Conventional
25% down · 7.5% · 30yr
- Down + closing
- —
- Monthly P&I
- —
- Monthly cashflow
- —
- DSCR
- —
- Eligible?
- —
Personal DTI + credit; lowest rate.
DSCR
20% down · 8.5% · 30yr
- Down + closing
- —
- Monthly P&I
- —
- Monthly cashflow
- —
- DSCR
- —
- Eligible?
- —
No personal income docs; deal must DSCR.
Hard money
10% down · 12.0% · 12mo
- Down + closing
- —
- Monthly P&I
- —
- Monthly cashflow
- —
- DSCR
- —
- Eligible?
- —
Short-term bridge; refi at stabilization.
Listing history 18 events
-
2026-05-04historical Contingent - Inspection
-
2026-04-30$199,000 Active
-
2025-08-13soldstatus $68,000
-
2021-06-21soldstatus $155,700
-
2021-06-18soldstatus $155,700 Sold 484-char remark
Show marketing remark (484 chars)
Come check out this spacious 5 bedroom, 2 bath rambler located on corner lot. Large living room looks out to Athletic’s Park. Host your loved ones with large family room in basement! Enjoy your privacy in the fenced in backyard lined with towering pines. The attached, insulated and heated garage make winters easier. Updates include a main bathroom remodel, recessed lighting throughout main level and garage storage shelving. Call for a showing today! Agent related to Seller.
-
2021-04-19status Pending 484-char remark
Show marketing remark (484 chars)
Come check out this spacious 5 bedroom, 2 bath rambler located on corner lot. Large living room looks out to Athletic’s Park. Host your loved ones with large family room in basement! Enjoy your privacy in the fenced in backyard lined with towering pines. The attached, insulated and heated garage make winters easier. Updates include a main bathroom remodel, recessed lighting throughout main level and garage storage shelving. Call for a showing today! Agent related to Seller.
-
2021-04-15$144,900 Active 484-char remark
Show marketing remark (484 chars)
Come check out this spacious 5 bedroom, 2 bath rambler located on corner lot. Large living room looks out to Athletic’s Park. Host your loved ones with large family room in basement! Enjoy your privacy in the fenced in backyard lined with towering pines. The attached, insulated and heated garage make winters easier. Updates include a main bathroom remodel, recessed lighting throughout main level and garage storage shelving. Call for a showing today! Agent related to Seller.
-
2020-05-04soldstatus $100,752
-
2016-07-26soldstatus $110,000 327-char remark
Show marketing remark (327 chars)
NEW SHINGLES!! NO ASSESSMENTS!! 2400+ square feet, 4 bedrooms (potential for 5), 2 baths, partially fenced yard, manicured corner lot. All this and an attached heated garage. This home is turn key ready. Located across the street from the Athletic Field and just minutes from down town. It won't last long, so call today!!
-
2016-06-06$114,900 327-char remark
Show marketing remark (327 chars)
NEW SHINGLES!! NO ASSESSMENTS!! 2400+ square feet, 4 bedrooms (potential for 5), 2 baths, partially fenced yard, manicured corner lot. All this and an attached heated garage. This home is turn key ready. Located across the street from the Athletic Field and just minutes from down town. It won't last long, so call today!!
-
2011-09-12soldstatus $67,000
-
2011-09-12soldstatus $67,000
-
2011-09-12soldstatus $67,000
-
2011-09-12soldstatus $67,000
-
2011-04-19$72,900
-
2011-04-19$72,900
-
2011-04-19$72,900
-
2003-07-22soldstatus $68,000
ⓘ Source: listings_history table (triggers on properties + properties_extension) + one-shot
backfill from property_details.listing_events for pre-trigger history.
Tax reassessment forecast MN · Partial reset (capped growth)
- Current annual tax
- $2,650 · $221/mo
- Projected year-2 tax
- $2,650 · $221/mo
- Expected delta
- $0/yr ($0/mo · 0.0%)
ⓘ Screening estimate from a state-policy table — verify with the county assessor before closing.
Climate risk First Street
- Flood 1/10 Low 0% chance over 30 yrs
- Wildfire 1/10 Low
- Heat 1/10 Low 7 d/yr ≥97°F today · 13 d/yr by 30 yrs out
- Wind 2/10 Low
- Air quality 3/10 Moderate 3 unhealthy d/yr today · 3 by 30 yrs out
Nearby sold comps map
Loading sold comps map…
Walkable amenities ~0.75 mi
Loading nearby amenities…
Taxation est. · year 1
- Rental income
- $16,094
- − Mortgage interest
- −$11,147
- − Property taxes
- −$2,650
- − Insurance
- −$995
- − Repairs & maintenance
- −$1,288
- − Management
- −$1,288
- − Depreciation
- −$5,789
- Taxable loss
- −$7,062
- Est. tax savings @ 24.0%
- +$1,695
- After-tax cash flow
- $-1,759/yr
For passive investors: Depreciation is non-cash, so a rental often shows a tax loss while cash-flowing — sheltering income. Rental losses are passive: they offset passive income freely, and up to $25,000/yr can offset ordinary (W-2) income if you actively participate and your MAGI is under $100k (phasing out to $0 by $150k); unused losses carry forward. On sale, claimed depreciation is recaptured at up to 25%, and gains may owe capital-gains tax (a 1031 exchange can defer both). Figures are a year-1 estimate at your 24.0% rate — not tax advice; consult a CPA.
Schools (NCES district)
- District
- West Central Area
- NCES district ID
- 2700104
- Math proficiency
- 47% ▼ -16.00%
- Reading proficiency
- 61% ▼ -8.00%
- Median HH income
- $48,888
- Composite
- 45.94/100
- National rank
- #2541
- State rank
- #80 of 301 in MN
Livability — Elbow Lake
- Score
- 75/100
- State rank
- #188
- US rank
- #4060
Category grades
Schools grade is shown separately in the Schools card above.
Census & demographics
- Census place
- Elbow Lake, MN
- City population
- 1,948
- Population (ZIP)
- 1,948
Population outlook (Grant County) Hauer SSP2
- Today (2025)
- 5,527 people
- By 2030
- 5,287 · -4.3%
- By 2040
- 4,829 · -12.6%
- By 2050
- 4,415 · -20.1%
- By 2075
- 3,504 · -36.6%
- By 2100
- 2,555 · -53.8%
Race, ethnicity, and origin ACS 2023
- Neighborhood character
- Predominantly White (94%)
- Race & ethnicity
- White 94% Two or more races 4% Hispanic / Latino 1%
- Common ancestry
- Portuguese 36% Scottish 3% Romanian 3%
- Foreign-born
- 0%
- Languages at home
- 99% English-only · Spanish 1%
Political lean MEDSL · Grant
- 2024 margin
- Solid R (+30.6) · D 33.6% · R 64.2% · Other 2.2%
- 2008→2024 swing
- -36.2pp toward R · 2008: 5.7pp · 2024: -30.6pp
- All cycles
- 2024: R+30.6 2020: R+26.5 2016: R+27.8 2012: R+2.9 2008: D+5.7
Not yet ingested
- Civics
- —
Market trends
- HPI YoY
- ▲ 5.12%
- Current HPI
- 253.9553
- Rent YoY
- —
- Metro
- —
- State GDP YoY
- ▲ 2.41%
- F500 in state
- 34
Industry mix (Fortune 500 HQ in MN)
| Industry | F500 HQs | Revenue |
|---|---|---|
| Healthcare | 2 | $407B |
|
||
| Retail | 2 | $150B |
|
||
| Consumer Goods | 2 | $32B |
|
||
| Industrial Machinery | 2 | $6B |
|
||
| Agriculture | 1 | $40B |
|
||
| Healthcare / Medical Devices | 1 | $32B |
|
||
Price history
+192.6% since first listed18 events — show timeline
- 2026-05-04 Contingent — NORTHSTARMLS as Distributed by MLS Grid
- 2026-04-30 Listed $199,000 NORTHSTARMLS as Distributed by MLS Grid
- 2025-08-13 Sold (Public Records) $68,000 Public Records
- 2021-06-21 Sold (Public Records) $155,700 Public Records
- 2021-06-18 Sold (MLS) $155,700 NORTHSTARMLS as Distributed by MLS Grid
- 2021-04-19 Pending — NORTHSTARMLS as Distributed by MLS Grid
- 2021-04-15 Listed $144,900 NORTHSTARMLS as Distributed by MLS Grid
- 2020-05-04 Sold (Public Records) $100,752 Public Records
- 2016-07-26 Sold (MLS) $110,000 NORTHSTARMLS as Distributed by MLS Grid
- 2016-06-06 Listed $114,900 NORTHSTARMLS as Distributed by MLS Grid
- 2011-09-12 Sold (Public Records) $67,000 Public Records
- 2011-09-12 Sold (MLS) $67,000 NORTHSTARMLS as Distributed by MLS Grid
- 2011-09-12 Sold (MLS) $67,000 NORTHSTARMLS as Distributed by MLS Grid
- 2011-09-12 Sold (MLS) $67,000 NORTHSTARMLS as Distributed by MLS Grid
- 2011-04-19 Listed $72,900 NORTHSTARMLS as Distributed by MLS Grid
- 2011-04-19 Listed $72,900 NORTHSTARMLS as Distributed by MLS Grid
- 2011-04-19 Listed $72,900 NORTHSTARMLS as Distributed by MLS Grid
- 2003-07-22 Sold (Public Records) $68,000 Public Records
Property tax history
+2.6%/yrLatest (2026): $2,650 · +0.6% YoY. Source: county tax records.
Cash-flow waterfall
monthlySold comps — $/sqft
last 12 mo · ≤1 miLoading sold comps…