 Triplex
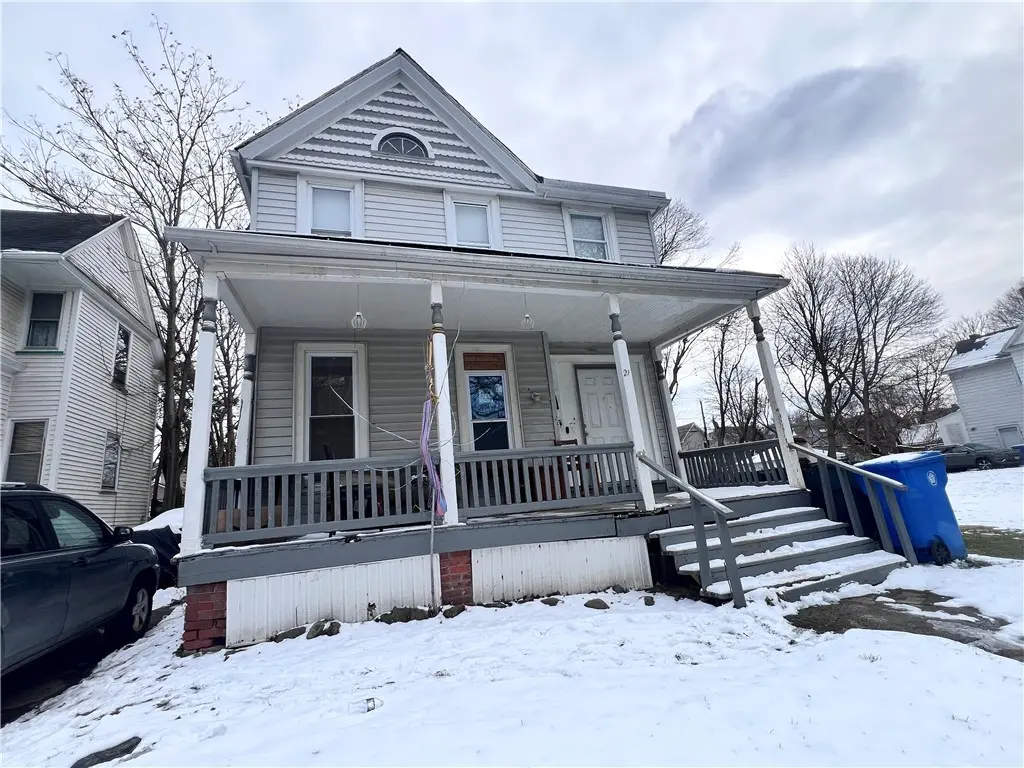
21 Locust St · Rochester, NY
Flood risk 1/10 · Minimal
- FEMA flood zone
- X (unshaded)
- Chance of flooding over 30 yrs
- 0.0%
- Est. flood insurance / yr
- $473 – $860
Fire risk 1/10 · Minimal
- Est. fire insurance / yr
- $691 – $1,283
Heat risk 2/10 · Minimal
- Hot days now (above 95°F)
- 7 days/yr
- Hot days in 30 yrs
- 15 days/yr
Wind risk 1/10 · Minimal
- Chance of severe wind over 30 yrs
- —
Air-quality risk 2/10 · Minimal
- Unhealthy air days now
- 1 days/yr
- Unhealthy air days in 30 yrs
- 2 days/yr
Risk factors via First Street. Map © Google.
Why this score? — see what drove the B grade
The composite is a weighted blend of 9 inputs, each scored 0–100. Each bar is that input's sub-score; the figure is the points it added to the 100-point composite (weight × sub-score).
- Cash flow +30.0/30.0
- 1% rule +10.0/10.0
- DSCR +10.0/10.0
- ARV discount +7.7/15.0
- Livability +3.8/5.0
- Rent growth +2.5/5.0
- Condition / age +2.5/5.0
- Appreciation +2.2/10.0
- Schools +1.9/10.0
$125,000
🖨 Deal sheet 📄 Offer letter ✓ Due diligence
Multi-family units
County records classify this as Multi-Family (2-4 Unit). Listing-text estimate: 3 units. confirmed
Listing remarks MLS
Discover this fully occupied, cash-flowing 3-family in Rochester's historic Edgerton neighborhood, one of the city's most diverse and storied communities. With all three units tenanted and generating income from day one, this property is a turnkey addition to any investor's portfolio. Each unit operates independently, keeping management straightforward and expenses predictable. Whether you're a seasoned investor looking to scale or a first-time buyer ready to plant your flag in one of Rochester's most affordable zip codes, 21 Locust Street delivers immediate value. The Edgerton location puts residents steps from Edgerton Park and the Frederick Law Olmsted-designed Lower Falls Park and Jones Square Park, green spaces that anchor the neighborhood's outdoor appeal. The Genesee River forms the neighborhood's eastern boundary, and the Edgerton Recreation Center, home to the beloved Stardust Ballroom and the iconic Model Railroad Room, adds a layer of community charm that tenants love. I-490 sits just two miles away, making commuting a breeze, and downtown Rochester's shops, dining, and entertainment options are a quick drive from your doorstep. Savvy investors will immediately recognize the strong rental demand in this established residential neighborhood and its attractive, close-to-assessed-value price point. Don't overlook this opportunity to acquire a stabilized, income-producing asset in a community that has been one of Rochester's most enduring residential neighborhoods for over a century.
Key facts
- Strong rental demand
- Three units tenanted
- Independent units
Tags
Neighborhood map
What this means for you Summary
Snapshot
- This is a 3 × 3-bed/3.0-bath units multifamily listed at $125k.
Deal economics
- At list price, monthly cash flow is $2k ($23k/yr) — positive. Per door: $645/mo.
- The deal already cash-flows at list — no discount required.
- Meets the 1% rule at list price ($3k rent vs $125k).
- Recommended offer: $118k (6.0% below list) — sets the bar for market timing.
- Cap rate 24.9% vs local median 9.3% in Rochester — top-decile yield for the area; either an underpriced asset or a hidden risk that comps aren't pricing in. Stress-test before assuming the spread holds.
Location & tenants
- Location reads 76/100 on livability (#222 in NY, #3,482 nationally) — a middle-class / working-renter tenant base. Strengths: commute A+, cost of living A+, housing A+; Watch: schools D+, crime F, employment F.
- Rochester City School District (urban): math 21% / reading 26% proficiency, ranked #589 of 590 in NY (top 100%) — low school quality limits family demand, transient renter base, plan for 1-2y turnover; 82% free/reduced lunch — lower-income household profile, screen leases tightly.
- Market conditions: 71 active listings in the ZIP; 15 comparable units currently listed for rent nearby; rentals at typical pace (median 21d on market — plan ~3-4 weeks tenant-placement turnaround); 40% of comp listings sitting > 30 days — soft ceiling on asking rent; 1,169 units permitted in Monroe County in 2024 (591 in 5+ unit buildings).
Forward outlook
- Local home prices are declining (-3.0%/yr); year-one equity from $864 of loan paydown is wiped out by about $4k of value loss. Plan a longer hold.
- Monroe County population projected to shrink 6% by 2050 — rents likely to lag national; underwrite the cash flow, not the appreciation.
- At projected returns (-3.0% appreciation + 3.0% rent growth), your $35k cash investment doubles in ~2 years — after that, you're playing with house money.
Negotiation context
- It's been on market 87 days — a 6% lower offer ($118k) is reasonable based on typical stale-listing flexibility.
- 2 sale attempts since 14y ago with the ask held roughly flat each time — persistent listings suggest the price (not the market) is what's stuck; bring a comps-based counter.
- Current owner paid $55k; list at $125k implies a 128% gain — meaningful room to come down on a strong offer.
Risks & watch-outs
- Watch-outs: built in 1890 — expect roof / HVAC / electrical / plumbing capex.
Questions for the listing agent
- It's been on market 87 days. Have you received any prior offers? Is the seller open to a 6% concession, seller financing, or rate buy-down credit?
- Can we see the unit-by-unit rent roll, current vacancy, and any below-market leases? What's the average tenancy length?
- What capital expenditures (roof, boiler, parking lot, exteriors) have been made in the last 5 years, and what's planned in the next 2?
- Built in 1890 — when were the roof, HVAC, electrical panel, plumbing, and water heater last replaced?
- Why hasn't it sold? Are there any deal-killer items the seller is aware of (foundation, flood, title, zoning, code violations)?
- Is there a deadline driving the sale (1031 exchange, divorce, estate, relocation)? That informs how much negotiation room exists.
- Schools are D-rated, which usually means shorter tenancies and higher turnover. Who's the typical renter profile here, and what's been the actual vacancy rate?
- Crime grade is F in this area — have there been break-ins, vandalism, or insurance claims at this property in the last 3 years? What carrier currently insures it and at what premium?
- What's the average days-on-market for RENTAL listings here right now (not sales)? A rising rental-DOM trend means longer vacancies and softer asking-rent achievability than the comps imply.
- What's the recent tenant-quality profile in this submarket — average credit score on applications, eviction rate, late-payment / NSF rate, and stable-employment percentage? A property-management company in the area should have these aggregated.
- How much new apartment / multifamily construction is in the pipeline within 1–3 miles? Heavy new supply (>2% of stock underway) typically softens rents 12–24 months out; light construction supports rent growth.
Investment metrics
- 1% rule
- 2.76% ✓
- Cap rate
- 24.86%
- Cash-on-cash
- 66.32%
- DSCR
- 3.95
- GRM
- 3.0
CMA / ARV
- ARV (median comp)
- $125,457
- List price
- $125,000
- Delta
- -0.36%
- Verdict
- FAIR
- Comps
- 20 within 1.0 mi
Show comp detail 12 sales within ~0.75 mi
| Address | Dist | Beds/Ba | Sqft | Sold | Price | $/sf | Match |
|---|---|---|---|---|---|---|---|
| 204 Fulton Ave | 0.13mi | 4/2.0 (+1) | 1,938 (-2%) | 12mo | $68,000 | $35 | 73 |
| 304 Ravine Ave | 0.25mi | 3/2.0 | 1,812 (-8%) | 7mo | $35,000 | $19 | 66 |
| 475 Sherman St | 0.38mi | 4/2.0 (+1) | 2,016 (+2%) | 5mo | $150,000 | $74 | 65 |
| 60 Locust St | 0.15mi | 4/2.0 (+1) | 2,250 (+14%) | 3mo | $65,000 | $29 | 58 |
| 315 Lexington Ave | 0.43mi | 3/2.0 | 1,754 (-11%) | 1mo | $107,000 | $61 | 57 |
| 41 Pierpont St | 0.47mi | 3/2.0 | 1,778 (-10%) | 2mo | $17,000 | $10 | 56 |
| 40 Finch St | 0.46mi | 3/2.0 | 1,826 (-7%) | 9mo | $91,000 | $50 | 55 |
| 205-207 Ravine Ave | 0.11mi | 4/2.0 (+1) | 2,240 (+14%) | 11mo | $190,000 | $85 | 54 |
| 2 Costar St | 0.31mi | 4/2.0 (+1) | 2,122 (+8%) | 12mo | $125,000 | $59 | 53 |
| 187 Fulton Ave | 0.08mi | 4/2.0 (+1) | 1,684 (-14%) | 12mo | $57,000 | $34 | 53 |
| 31 Plover St | 0.46mi | 4/2.0 (+1) | 1,776 (-10%) | 6mo | $123,000 | $69 | 49 |
| 12 Nielson St | 0.64mi | 4/2.0 (+1) | 1,908 (-3%) | 12mo | $67,500 | $35 | 46 |
Match score weights: distance 35% · size 25% · config 20% · recency 20%. Top-matched comps best support the ARV.
Projected returns pro-forma
-3.0% appreciation · 3.0% rent growth · sell at horizon
- IRR
- 65.6%
- Equity multiple
- 3.94×
- Total profit
- $102,953
- Equity at exit
- $18,638
- IRR
- 69.9%
- Equity multiple
- 8.09×
- Total profit
- $248,324
- Equity at exit
- $10,808
Cash invested: $35,000 (down + closing). Projections, not guarantees.
Landlord ↔ Tenant lean methodology
- Overall (STATE)
- 15 Strongly Tenant-Friendly
- State New York
- 15 Strongly Tenant-Friendly · D+10
- County
- — inherits STATE
- City
- — inherits STATE
ZIP-level market 14613
- Home prices YoY
- -2.0%
- Active inventory
- 71
- Price-to-rent
- 9.1×
Monthly cashflow live
- Estimated rent
- $3,452 medium interval (Pro) →
- Mortgage (P&I)
- −$656
- Tax from tax record
- −$85 /mo · $1,022/yr
- Insurance
- −$52
- HOA
- −$0
- Vacancy / Maint / Mgmt
- −$725
- Net cashflow
- $1,934
Break-even live
3-unit breakdown (identical units grouped — click to expand)
| Units | Beds | Baths | Est. rent |
|---|---|---|---|
| 3× units | 3 | 3 | $3,453 |
| #1 | 3 | 3 | $1,151 |
| #2 | 3 | 3 | $1,151 |
| #3 | 3 | 3 | $1,151 |
| Total (3 units) | $3,452 | ||
UW: 25.0% down · 7.5% · 30yr · 1.5% tax · 5.0% vac · 8.0% maint · 8.0% mgmt
Financing live
Cash to close
- Down payment
- $31,250
- Closing costs
- $3,750
- Reserves months
- —
- Total cash needed
- —
Loan-product check · same deal, 3 products live
Conventional
25% down · 7.5% · 30yr
- Down + closing
- —
- Monthly P&I
- —
- Monthly cashflow
- —
- DSCR
- —
- Eligible?
- —
Personal DTI + credit; lowest rate.
DSCR
20% down · 8.5% · 30yr
- Down + closing
- —
- Monthly P&I
- —
- Monthly cashflow
- —
- DSCR
- —
- Eligible?
- —
No personal income docs; deal must DSCR.
Hard money
10% down · 12.0% · 12mo
- Down + closing
- —
- Monthly P&I
- —
- Monthly cashflow
- —
- DSCR
- —
- Eligible?
- —
Short-term bridge; refi at stabilization.
Rent comps 15 comps
| Address | Beds | Baths | Sqft | Rent | $/sqft | DOM | Units | Dist |
|---|---|---|---|---|---|---|---|---|
| 327 Glenwood Ave Rochester, NY | 3.0 | 1.0 | 2012 | $1,690 | $0.84 | 3d | 1 | 0.34mi |
| 28-30 Carthage Dr Unit 28 Rochester, NY | 3.0 | 1.0 | 1415 | $1,600 | $1.13 | 23d | 1 | 0.49mi |
| 98 Pierpont St Rochester, NY | 3.0 | 1.0 | 1973 | $1,295 | $0.66 | 43d | 1 | 0.54mi |
| 69 Angle St Rochester, NY | 2.0 | 1.0 | 1500 | $1,500 | $1.00 | 14d | 1 | 0.61mi |
| 1016 Lake Ave Unit 1 Rochester, NY | 3.0 | 1.0 | 1300 | $1,600 | $1.23 | 43d | 1 | 0.71mi |
| 1108 Lake Ave Rochester, NY | 2.0 | 1.0 | 2574 | $1,600 | $0.62 | 43d | 1 | 0.84mi |
| 2 Jay St Unit 2 Rochester, NY | 3.0 | 1.0 | 1252 | $1,045 | $0.83 | 43d | 1 | 0.94mi |
| 710-712 Jay St Unit 3 Rochester, NY | 2.0 | 1.0 | 1252 | $895 | $0.71 | 43d | 1 | 1.05mi |
| 87 McNaughton St Unit 87 Rochester, NY | 2.0 | 1.0 | 1929 | $1,300 | $0.67 | 14d | 1 | 1.07mi |
| 287 Electric Ave Rochester, NY | 3.0 | 1.5 | 1297 | $1,500 | $1.16 | 2d | 1 | 1.24mi |
| 385 Ames St Rochester, NY | 3.0 | 1.5 | 1738 | $1,500 | $0.86 | 21d | 1 | 1.24mi |
| 235 Flower City Park Rochester, NY | 3.0 | 1.0 | 2000 | $1,360 | $0.68 | 43d | 1 | 1.28mi |
| 248 Flower City Park Rochester, NY | 3.0 | 1.0 | 1350 | $1,800 | $1.33 | 3d | 1 | 1.32mi |
| 768 Flower City Park Rochester, NY | 3.0 | 1.0 | 1995 | $1,995 | $1.00 | 10d | 1 | 1.47mi |
| 108 Wetmore Park Rochester, NY | 3.0 | 2.0 | 1278 | $1,900 | $1.49 | 10d | 1 | 1.48mi |
Listing history 21 events
-
2026-06-18days on market $125,000 Active 87 DOM
-
2026-06-17days on market $125,000 Active 86 DOM
-
2026-06-16days on market $125,000 Active 85 DOM
-
2026-06-15days on market $125,000 Active 84 DOM
-
2026-06-13days on market $125,000 Active 82 DOM
-
2026-06-13days on market $125,000 Active 81 DOM
-
2026-06-10days on market $125,000 Active 79 DOM
-
2026-06-09days on market $125,000 Active 78 DOM
-
2026-06-09days on market $125,000 Active 77 DOM
-
2026-06-07days on market $125,000 Active 76 DOM
-
2026-06-05days on market $125,000 Active 73 DOM
-
2026-06-03days on market $125,000 Active 72 DOM
-
2026-06-03days on market $125,000 Active 71 DOM
-
2026-06-01days on market $125,000 Active 70 DOM
-
2026-05-31days on market $125,000 Active 69 DOM
-
2026-03-20$125,000 Active 1515-char remark
Show marketing remark (1515 chars)
Discover this fully occupied, cash-flowing 3-family in Rochester's historic Edgerton neighborhood, one of the city's most diverse and storied communities. With all three units tenanted and generating income from day one, this property is a turnkey addition to any investor's portfolio. Each unit operates independently, keeping management straightforward and expenses predictable. Whether you're a seasoned investor looking to scale or a first-time buyer ready to plant your flag in one of Rochester's most affordable zip codes, 21 Locust Street delivers immediate value. The Edgerton location puts residents steps from Edgerton Park and the Frederick Law Olmsted-designed Lower Falls Park and Jones Square Park, green spaces that anchor the neighborhood's outdoor appeal. The Genesee River forms the neighborhood's eastern boundary, and the Edgerton Recreation Center, home to the beloved Stardust Ballroom and the iconic Model Railroad Room, adds a layer of community charm that tenants love. I-490 sits just two miles away, making commuting a breeze, and downtown Rochester's shops, dining, and entertainment options are a quick drive from your doorstep. Savvy investors will immediately recognize the strong rental demand in this established residential neighborhood and its attractive, close-to-assessed-value price point. Don't overlook this opportunity to acquire a stabilized, income-producing asset in a community that has been one of Rochester's most enduring residential neighborhoods for over a century.
-
2012-10-26soldstatus $54,900 151-char remark
Show marketing remark (151 chars)
Money making opportunity. Maintenance free. Off-street parking. New windows, seperate utilities, c of o supplied with 3 month free property management.
-
2012-10-26soldstatus $54,000
Show marketing remark (151 chars)
Money making opportunity. Maintenance free. Off-street parking. New windows, seperate utilities, c of o supplied with 3 month free property management.
-
2012-07-03$54,900 151-char remark
Show marketing remark (151 chars)
Money making opportunity. Maintenance free. Off-street parking. New windows, seperate utilities, c of o supplied with 3 month free property management.
-
2008-06-13soldstatus $21,500
-
2005-12-16soldstatus $40,000
ⓘ Source: listings_history table (triggers on properties + properties_extension) + one-shot
backfill from property_details.listing_events for pre-trigger history.
Tax reassessment forecast NY · Partial reset (capped growth)
- Current annual tax
- $1,022 · $85/mo
- Projected year-2 tax
- $1,567 · $131/mo
- Expected delta
- +$546/yr (+$45/mo · 53.4%)
ⓘ Screening estimate from a state-policy table — verify with the county assessor before closing.
Climate risk First Street
- Flood 1/10 Low FEMA zone X (unshaded) · 0% chance over 30 yrs
- Wildfire 1/10 Low
- Heat 2/10 Low 7 d/yr ≥95°F today · 15 d/yr by 30 yrs out
- Wind 1/10 Low
- Air quality 2/10 Low 1 unhealthy d/yr today · 2 by 30 yrs out
Nearby sold comps map
Loading sold comps map…
Walkable amenities ~0.75 mi
Loading nearby amenities…
Taxation est. · year 1
- Rental income
- $41,424
- − Mortgage interest
- −$7,002
- − Property taxes
- −$1,022
- − Insurance
- −$625
- − Repairs & maintenance
- −$3,314
- − Management
- −$3,314
- − Depreciation
- −$3,636
- Taxable income
- $22,511
- Est. tax owed @ 24.0%
- −$5,403
- After-tax cash flow
- $17,810/yr
For passive investors: Depreciation is non-cash, so a rental often shows a tax loss while cash-flowing — sheltering income. Rental losses are passive: they offset passive income freely, and up to $25,000/yr can offset ordinary (W-2) income if you actively participate and your MAGI is under $100k (phasing out to $0 by $150k); unused losses carry forward. On sale, claimed depreciation is recaptured at up to 25%, and gains may owe capital-gains tax (a 1031 exchange can defer both). Figures are a year-1 estimate at your 24.0% rate — not tax advice; consult a CPA.
Schools (NCES district)
- District
- Rochester City School District
- NCES district ID
- 3624750
- Math proficiency
- 21% ▬ 0.00%
- Reading proficiency
- 26% ▲ 4.00%
- Median HH income
- $30,923
- Composite
- 18.98/100
- National rank
- #8850
- State rank
- #589 of 590 in NY
Livability — Rochester
- Score
- 76/100
- State rank
- #222
- US rank
- #3482
Category grades
Schools grade is shown separately in the Schools card above.
Census & demographics
- Census place
- Rochester, NY
- City population
- 432,803
- Population (ZIP)
- 14,740
Population outlook (Monroe County) Hauer SSP2
- Today (2025)
- 759,460 people
- By 2030
- 757,154 · -0.3%
- By 2040
- 740,644 · -2.5%
- By 2050
- 714,443 · -5.9%
- By 2075
- 645,883 · -15.0%
- By 2100
- 547,084 · -28.0%
Race, ethnicity, and origin ACS 2023
- Neighborhood character
- Highly diverse neighborhood (Simpson 0.70)
- Race & ethnicity
- Black 45% White 22% Hispanic / Latino 20% Two or more races 10% Asian 8% Pacific Islander 1%
- Hispanic origin (detail)
- Puerto Rican 16% Dominican 3%
- Common ancestry
- British 2% Serbian 1% Romanian 1%
- Foreign-born
- 13% · Canada, India, Philippines
- Languages at home
- 79% English-only · Spanish 12% Other Asian/Pacific 5% Other Indo-European 3%
Political lean MEDSL · Monroe
- 2024 margin
- D (+19.1) · D 59.5% · R 40.5%
- 2008→2024 swing
- +1.4pp toward D · 2008: 17.7pp · 2024: 19.1pp
- All cycles
- 2024: D+19.1 2020: D+21.0 2016: D+14.1 2012: D+17.4 2008: D+17.7
Not yet ingested
- Civics
- —
Market trends
- HPI YoY
- ▼ -5.56%
- Current HPI
- 274.2485
- Rent YoY
- —
- Metro
- —
- State GDP YoY
- ▲ 2.60%
- F500 in state
- 92
Industry mix (Fortune 500 HQ in NY)
| Industry | F500 HQs | Revenue |
|---|---|---|
| Financial Services | 10 | $950B |
|
||
| Consumer Goods | 9 | $162B |
|
||
| Insurance | 4 | $225B |
|
||
| Telecommunications | 2 | $144B |
|
||
| Pharmaceuticals | 2 | $112B |
|
||
| Media / Entertainment | 2 | $69B |
|
||
Price history
+212.5% since first listed6 events — show timeline
- 2026-03-20 Listed $125,000 UNYREIS
- 2012-10-26 Sold (Public Records) $54,000 Public Records
- 2012-10-26 Sold (MLS) $54,900 UNYREIS
- 2012-07-03 Listed $54,900 UNYREIS
- 2008-06-13 Sold (Public Records) $21,500 Public Records
- 2005-12-16 Sold (Public Records) $40,000 Public Records
Property tax history
+6.7%/yrLatest (2025): $1,022 · +0.0% YoY. Source: county tax records.
Cash-flow waterfall
monthlySold comps — $/sqft
last 12 mo · ≤1 miLoading sold comps…