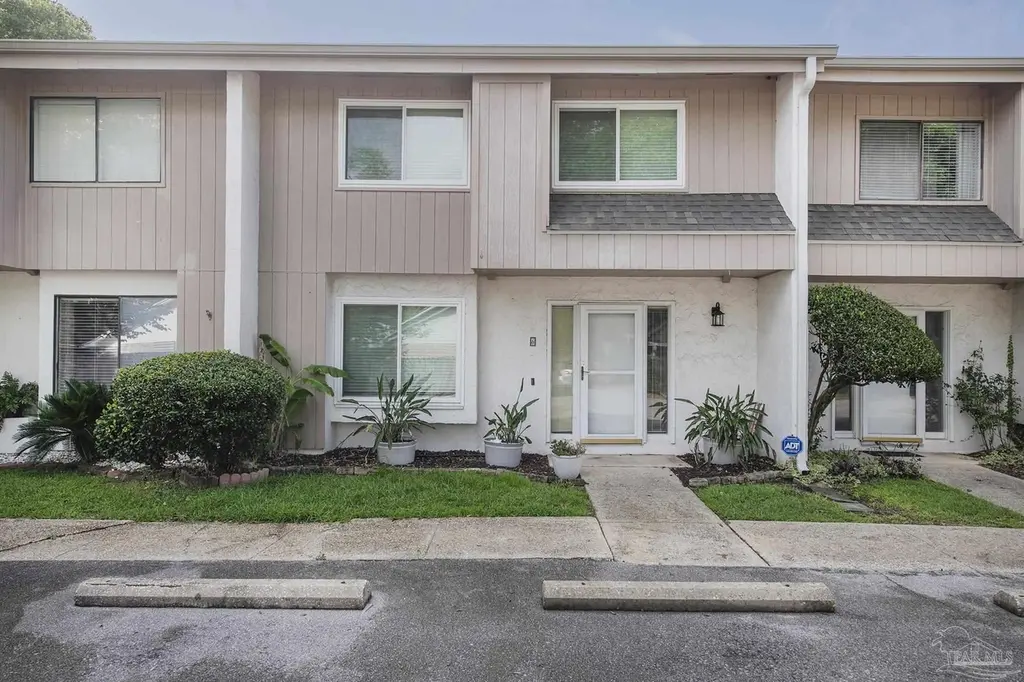
3400 Wimbledon Dr #6 · Pensacola, FL
Flood risk 1/10 · Minimal
- FEMA flood zone
- X (unshaded)
- Chance of flooding over 30 yrs
- 0.0%
- Est. flood insurance / yr
- $507 – $1,088
Fire risk 1/10 · Minimal
- Est. fire insurance / yr
- $947 – $1,759
Heat risk 10/10 · Severe
- Hot days now (above 105°F)
- 7 days/yr
- Hot days in 30 yrs
- 22 days/yr
Wind risk 9/10 · Severe
- Chance of severe wind over 30 yrs
- 99.0%
Air-quality risk 1/10 · Minimal
- Unhealthy air days now
- 0 days/yr
- Unhealthy air days in 30 yrs
- 0 days/yr
Risk factors via First Street. Map © Google.
Why this score? — see what drove the D grade
The composite is a weighted blend of 9 inputs, each scored 0–100. Each bar is that input's sub-score; the figure is the points it added to the 100-point composite (weight × sub-score).
- Cash flow +10.7/30.0
- ARV discount +7.5/15.0
- 1% rule +5.4/10.0
- Livability +4.2/5.0
- Schools +3.6/10.0
- Rent growth +3.4/5.0
- DSCR +3.1/10.0
- Condition / age +2.5/5.0
- Appreciation +0.0/10.0
$259,000
🖨 Deal sheet 📄 Offer letter ✓ Due diligence
Listing remarks
Welcome to this UPDATED, charming 3 bedroom, 2.5 bath townhome ideally located in east Pensacola. The first floor features a spacious living room complete with a built in bookcase and a cozy wood burning fireplace, perfect for gatherings and relaxing evenings at home. The galley style kitchen showcases elegant white painted cabinets and drawers paired with stainless steel appliances, blending style and functionality. Granite countertops in the kitchen. Just outside, you’ll find a covered deck and open patio area, ideal for cookouts and family fun. Upstairs, the large primary bedroom offers a private balcony overlooking the backyard. The ensuite bath includes a oversized closet and a s
Key facts
- $495 HOA
- 2 parking spots
- Built 1978
Property features AI
Finance
- Other: Building area approximately 1,932 square feet; Unit located in Tennis Oasis Townhouse Condominium (Unit #6)
- HOA & community: Association with annual fee (fee includes association, deed restrictions, and insurance)
Exterior
- Parking: Two total parking spaces (2 spaces per unit)
- Security: Insurance provided through association
- Utilities: Public water; Public sewer; Circuit breaker electric service; Cable available
- Home design: Townhouse condominium (Tennis Oasis T/H Condo); Two levels; Resale property; Shingle gable roof; Slab foundation; Frame construction
- Construction: Frame construction; Slab foundation; Shingle gable roof
- Exterior features: Covered patio / lanai; Patio; Balcony; Back yard fencing; Central access to grounds; Paved private-maintained road
Interior
- Kitchen: Updated kitchen with granite counters, new backsplash, new cabinets and sink, wood flooring; Stainless steel appliances; Pantry; Built-in microwave; ENERGY STAR qualified refrigerator and dishwasher
- Bedrooms: Master bedroom about 14.5 x 15.5; Second-floor bedroom about 10.5 x 14; Second-floor bedroom about 10 x 16.5
- Flooring: Tile; Simulated wood; Wood flooring in kitchen
- Bathrooms: Two full bathrooms and one half bathroom; Updated bathrooms with large shower, double sinks, granite countertops, abundant storage, and tile flooring
- Heating & cooling: Central heating; Central air conditioning; Fireplace(s); Ceiling fans; ENERGY STAR qualified cooling equipment
- Interior features: Baseboards; Bookcases; Ceiling fans; High ceilings; Vaulted ceilings; Recessed lighting; High-speed internet; Storm door(s); Double pane windows with blinds
- Laundry & utility: Inside laundry with washer/dryer hookups; Electric water heater (ENERGY STAR qualified)
Neighborhood map
What this means for you Summary
Snapshot
- This is a 3-bed/3.0-bath condo listed at $259k.
Deal economics
- At list price, monthly cash flow is $-121 ($-1k/yr) — negative.
- To cash-flow at today's rent, offer at most $238k (8.3% below list).
- Meets the 1% rule at list price ($3k rent vs $259k).
- Recommended offer: $238k (8.3% below list) — sets the bar for cash-flow.
- Cap rate 5.7% vs local median 3.6% in Pensacola — top-decile yield for the area; either an underpriced asset or a hidden risk that comps aren't pricing in. Stress-test before assuming the spread holds.
Location & tenants
- Location reads 83/100 on livability (#53 in FL, #924 nationally) — a professional / high-income tenant draw. Strengths: commute A+, cost of living A+, housing A+.
- Escambia (suburban): math 40% / reading 45% proficiency, ranked #56 of 73 in FL (top 77%) — families likely to look elsewhere, expect single-tenant / working-renter base with shorter leases.
- Market conditions: Rents rising (+3.6%/yr); 172 active listings in the ZIP; 4 comparable units currently listed for rent nearby; rentals at typical pace (median 23d on market — plan ~3-4 weeks tenant-placement turnaround); 1,479 units permitted in Escambia County in 2024 (0 in 5+ unit buildings).
- This rent runs 44% of the median local income ($73k/yr) — at the standard rent-burdened threshold; future hikes will face affordability resistance.
Forward outlook
- Local home prices are declining (-3.0%/yr); year-one equity from $2k of loan paydown is wiped out by about $8k of value loss. Plan a longer hold.
- Escambia County population projected at +13% by 2050 — modest demand growth; plan on rents tracking national, not racing it.
Negotiation context
- Only 9 days on market — expect competitive offers; lowballing is unlikely to land.
- Current owner paid $152k; list at $259k implies a 70% gain — meaningful room to come down on a strong offer.
Risks & watch-outs
- Climate carrying-cost: severe wind risk, 99% chance of damaging wind over 30y; extreme-heat days projected 7→22/yr by 2055 (HVAC capex compounding) — expect insurance premiums to compound above CPI over the hold.
Questions for the listing agent
- What do current leases actually rent for vs. the listed asking? Can we see a recent rent roll and the last 12 months of T-12 income?
- Built in 1978 — when were the roof, HVAC, electrical panel, plumbing, and water heater last replaced?
- What does the HOA fee cover, when was the last increase, and are there any pending special assessments or reserve-fund shortfalls?
- Any open or pending special assessments — roof, HVAC, plumbing, elevator, façade? What's the per-unit balance and payoff schedule, and is the seller paying it off at close or rolling it to the buyer?
- Is there a deadline driving the sale (1031 exchange, divorce, estate, relocation)? That informs how much negotiation room exists.
- The area grade is low — what's the realistic commute time and amenity access for the typical tenant pool here? Any planned neighborhood developments (good or bad) we should know about?
- What's the average days-on-market for RENTAL listings here right now (not sales)? A rising rental-DOM trend means longer vacancies and softer asking-rent achievability than the comps imply.
- What's the recent tenant-quality profile in this submarket — average credit score on applications, eviction rate, late-payment / NSF rate, and stable-employment percentage? A property-management company in the area should have these aggregated.
- How much new apartment / multifamily construction is in the pipeline within 1–3 miles? Heavy new supply (>2% of stock underway) typically softens rents 12–24 months out; light construction supports rent growth.
Investment metrics
- 1% rule
- 1.04% ✓
- Cap rate
- 5.73%
- Cash-on-cash
- -2.01%
- DSCR
- 0.91
- GRM
- 8.0
CMA / ARV
No comps found within radius.
Projected returns pro-forma
-3.0% appreciation · 3.63% rent growth · sell at horizon
- IRR
- -18.6%
- Equity multiple
- 0.34×
- Total profit
- $-47,655
- Equity at exit
- $38,618
- IRR
- -9.2%
- Equity multiple
- 0.41×
- Total profit
- $-42,992
- Equity at exit
- $22,394
Cash invested: $72,520 (down + closing). Projections, not guarantees.
Landlord ↔ Tenant lean methodology
- Overall (STATE)
- 87 Strongly Landlord-Friendly
- State Florida
- 87 Strongly Landlord-Friendly · R+3
- County
- — inherits STATE
- City
- — inherits STATE
ZIP-level market 32504
- Home prices YoY
- -30.9%
- Rents YoY
- 3.6%
- Active inventory
- 172
- Price-to-rent
- 8.0×
Monthly cashflow live
- Estimated rent
- $2,694 medium interval (Pro) →
- Mortgage (P&I)
- −$1,358
- Tax from tax record
- −$289 /mo · $3,466/yr
- Insurance
- −$108
- HOA
- −$495
- Vacancy / Maint / Mgmt
- −$566
- Net cashflow
- $-121
Break-even live
UW: 25.0% down · 7.5% · 30yr · 1.5% tax · 5.0% vac · 8.0% maint · 8.0% mgmt
Financing live
Cash to close
- Down payment
- $64,750
- Closing costs
- $7,770
- Reserves months
- —
- Total cash needed
- —
Loan-product check · same deal, 3 products live
Conventional
25% down · 7.5% · 30yr
- Down + closing
- —
- Monthly P&I
- —
- Monthly cashflow
- —
- DSCR
- —
- Eligible?
- —
Personal DTI + credit; lowest rate.
DSCR
20% down · 8.5% · 30yr
- Down + closing
- —
- Monthly P&I
- —
- Monthly cashflow
- —
- DSCR
- —
- Eligible?
- —
No personal income docs; deal must DSCR.
Hard money
10% down · 12.0% · 12mo
- Down + closing
- —
- Monthly P&I
- —
- Monthly cashflow
- —
- DSCR
- —
- Eligible?
- —
Short-term bridge; refi at stabilization.
Rent comps 4 comps
| Address | Beds | Baths | Sqft | Rent | $/sqft | DOM | Units | Dist |
|---|---|---|---|---|---|---|---|---|
| 3791 Maule Rd Pensacola, FL | 4.0 | 3.0 | 2000 | $3,250 | $1.62 | 23d | 1 | 0.98mi |
| 3545 Hopestill Rd Pensacola, FL | 4.0 | 2.0 | 1984 | $2,400 | $1.21 | 23d | 1 | 0.99mi |
| 3547 Firestone Blvd Pensacola, FL | 4.0 | 2.0 | 2000 | $2,695 | $1.35 | 23d | 1 | 1.02mi |
| 3019 Keats Dr Pensacola, FL | 4.0 | 2.5 | 2484 | $4,400 | $1.77 | 23d | 1 | 1.36mi |
HOA detail condo
- Monthly dues
- $495 · $5,940/yr
- Assessments
- None detected in remarks — confirm with the listing agent.
Listing history 13 events
-
2026-06-18days on market $259,000 Active 9 DOM
-
2026-06-17days on market $259,000 Active 8 DOM
-
2026-06-16days on market $259,000 Active 7 DOM
-
2026-06-15days on market $259,000 Active 6 DOM
-
2026-06-14days on market $259,000 Active 4 DOM
-
2026-06-10remarks 693-char remark
-
2026-06-10statusdays on market $259,000 Active 1 DOM
-
2026-06-09days on market $259,000 Coming Soon 8 DOM
-
2026-06-08days on market $259,000 Coming Soon 7 DOM
-
2026-06-07days on market $259,000 Coming Soon 6 DOM
-
2026-06-03days on market $259,000 Coming Soon 2 DOM
-
2026-06-02remarks 687-char remark
-
2026-06-02$259,000 Coming Soon 1 DOM
ⓘ Source: listings_history table (triggers on properties + properties_extension) + one-shot
backfill from property_details.listing_events for pre-trigger history.
Tax reassessment forecast FL · Resets to sale price
- Current annual tax
- $3,466 · $289/mo
- Projected year-2 tax
- $3,466 · $289/mo
- Expected delta
- $0/yr ($0/mo · 0.0%)
ⓘ Screening estimate from a state-policy table — verify with the county assessor before closing.
Climate risk First Street
- Flood 1/10 Low FEMA zone X (unshaded) · 0% chance over 30 yrs
- Wildfire 1/10 Low
- Heat 10/10 Extreme 7 d/yr ≥105°F today · 22 d/yr by 30 yrs out
- Wind 9/10 Extreme 99% chance of damaging wind over 30 yrs
- Air quality 1/10 Low 0 unhealthy d/yr today · 0 by 30 yrs out
Nearby sold comps map
Loading sold comps map…
Walkable amenities ~0.75 mi
Loading nearby amenities…
Taxation est. · year 1
- Rental income
- $32,334
- − Mortgage interest
- −$14,508
- − Property taxes
- −$3,466
- − Insurance
- −$1,295
- − Repairs & maintenance
- −$2,587
- − Management
- −$2,587
- − HOA
- −$5,940
- − Depreciation
- −$7,535
- Taxable loss
- −$5,583
- Est. tax savings @ 24.0%
- +$1,340
- After-tax cash flow
- $-116/yr
For passive investors: Depreciation is non-cash, so a rental often shows a tax loss while cash-flowing — sheltering income. Rental losses are passive: they offset passive income freely, and up to $25,000/yr can offset ordinary (W-2) income if you actively participate and your MAGI is under $100k (phasing out to $0 by $150k); unused losses carry forward. On sale, claimed depreciation is recaptured at up to 25%, and gains may owe capital-gains tax (a 1031 exchange can defer both). Figures are a year-1 estimate at your 24.0% rate — not tax advice; consult a CPA.
Schools (NCES district)
- District
- Escambia
- NCES district ID
- 1200510
- Math proficiency
- 40% ▼ -9.00%
- Reading proficiency
- 45% ▼ -4.00%
- Median HH income
- $44,649
- Composite
- 36.04/100
- National rank
- #4773
- State rank
- #56 of 73 in FL
Livability — Pensacola
- Score
- 83/100
- State rank
- #53
- US rank
- #924
Category grades
Schools grade is shown separately in the Schools card above.
Census & demographics
- Census place
- Pensacola, FL
- County
- Escambia County · 301,722 people
- City population
- 237,636
- Metro
- Pensacola-Ferry Pass-Brent, FL
- Population (ZIP)
- 22,153
- Household income
- $72,672
- Rent vs Own
- Severe rent burden
- 533.0
Population outlook (Escambia County) Hauer SSP2
- Today (2025)
- 334,637 people
- By 2030
- 345,779 · +3.3%
- By 2040
- 364,828 · +9.0%
- By 2050
- 378,514 · +13.1%
- By 2075
- 403,220 · +20.5%
- By 2100
- 386,125 · +15.4%
Race, ethnicity, and origin ACS 2023
- Neighborhood character
- Predominantly White (69%)
- Race & ethnicity
- White 69% Black 13% Two or more races 10% Hispanic / Latino 6% Asian 4%
- Hispanic origin (detail)
- Mexican 2%
- Common ancestry
- Lithuanian 3% Italian 2% Slovak 2%
- Foreign-born
- 7% · Canada, China, Jamaica
- Languages at home
- 92% English-only · Spanish 2% Chinese 2% Other Indo-European 1%
Political lean MEDSL · Escambia
- 2024 margin
- R (+19.5) · D 39.7% · R 59.2% · Other 1.1%
- 2008→2024 swing
- -0.2pp no change · 2008: -19.3pp · 2024: -19.5pp
- All cycles
- 2024: R+19.5 2020: R+15.1 2016: R+20.6 2012: R+20.6 2008: R+19.3
Not yet ingested
- Civics
- —
Market trends
- HPI YoY
- ▼ -119.75%
- Current HPI
- 268.2214
- Rent YoY
- ▲ 3.63%
- Metro
- Pensacola-Ferry Pass-Brent, FL
- State GDP YoY
- ▲ 3.28%
- F500 in state
- 36
Industry mix (Fortune 500 HQ in FL)
| Industry | F500 HQs | Revenue |
|---|---|---|
| Industrial Technology | 2 | $29B |
|
||
| Insurance | 2 | $17B |
|
||
| Retail | 1 | $60B |
|
||
| Technology Distribution | 1 | $58B |
|
||
| Homebuilding | 1 | $35B |
|
||
| Technology Manufacturing | 1 | $35B |
|
||
Price history
+246.7% since first listed6 events — show timeline
- 2026-06-01 Coming Soon $259,000 PARMLS
- 2020-12-01 Sold (Public Records) $152,000 Public Records
- 2003-11-07 Sold (Public Records) $95,000 Public Records
- 1998-05-06 Sold (Public Records) $82,500 Public Records
- 1989-05-01 Sold (Public Records) $83,000 Public Records
- 1980-08-01 Sold (Public Records) $74,700 Public Records
Property tax history
+14.5%/yrLatest (2025): $3,466 · +9.7% YoY. Source: county tax records.
Cash-flow waterfall
monthlySold comps — $/sqft
last 12 mo · ≤1 miLoading sold comps…