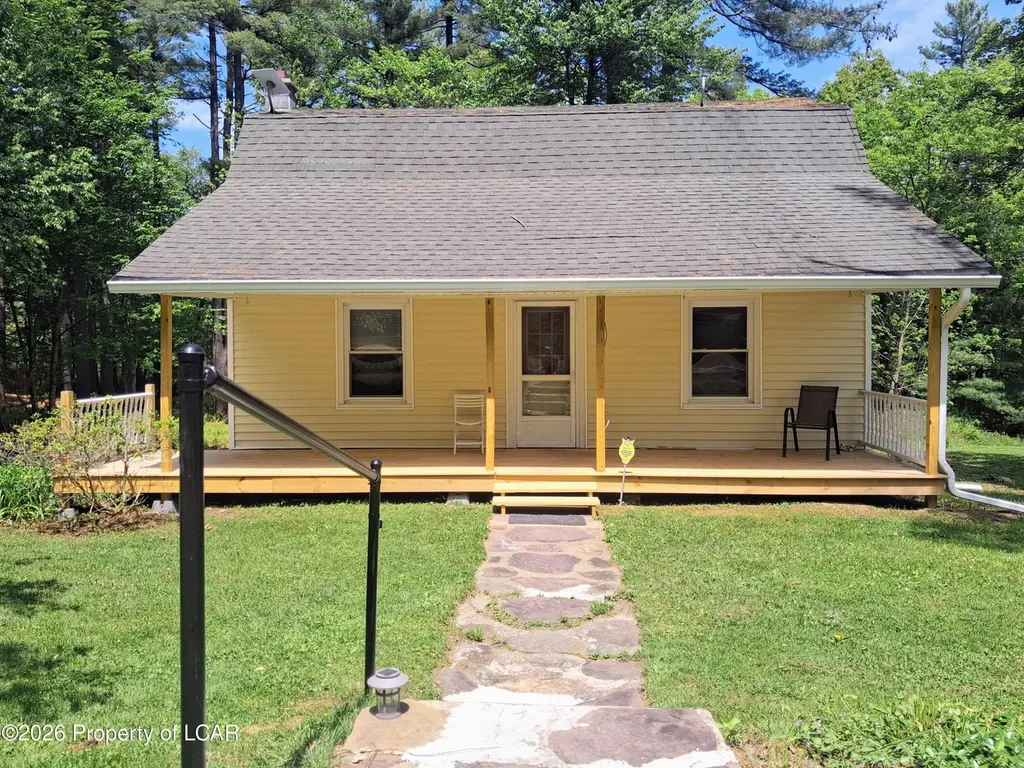
958 Pennsylvania 239 · Waller, PA
Flood risk 1/10 · Minimal
- FEMA flood zone
- X (unshaded)
- Chance of flooding over 30 yrs
- 0.0%
- Est. flood insurance / yr
- $473 – $860
Fire risk 3/10 · Minor
- Est. fire insurance / yr
- $511 – $949
Heat risk 3/10 · Minor
- Hot days now (above 94°F)
- 7 days/yr
- Hot days in 30 yrs
- 15 days/yr
Wind risk 2/10 · Minimal
- Chance of severe wind over 30 yrs
- 4.0%
Air-quality risk 2/10 · Minimal
- Unhealthy air days now
- 1 days/yr
- Unhealthy air days in 30 yrs
- 2 days/yr
Risk factors via First Street. Map © Google.
Why this score? — see what drove the B- grade
The composite is a weighted blend of 9 inputs, each scored 0–100. Each bar is that input's sub-score; the figure is the points it added to the 100-point composite (weight × sub-score).
- Cash flow +27.1/30.0
- DSCR +9.4/10.0
- ARV discount +7.5/15.0
- 1% rule +7.3/10.0
- Appreciation +6.2/10.0
- Schools +3.6/10.0
- Rent growth +2.5/5.0
- Livability +2.5/5.0
- Condition / age +2.2/5.0
$98,000
🖨 Deal sheet 📄 Offer letter ✓ Due diligence
Listing remarks
Opportunity and potential on nearly 2 acres! Offering over 1,200 square feet of space, a rural setting with a spring-fed water service, this property is ready for its next chapter. Renovations have been started, leaving a blank canvas for the new owner to complete and customize to their vision. Rural setting with plenty of room to grow, create, and add value. Cash sale only. Property being sold
Key facts
- Room to grow
- Blank canvas
- 1.94 acre lot
Tags
Property features AI
Finance
- Financial info: Annual taxes: $1,788.44
Exterior
- Home design: Single-family residence; Two levels
- Construction: Vinyl siding
- Exterior features: Approximately 1.94-acre lot; Residential zoning
Interior
- Bathrooms: One full bathroom
- Heating & cooling: Oil heating; Baseboard heating; Has heating
- Interior features: Dining room fireplace; Seven total rooms
Neighborhood map
What this means for you Summary
Snapshot
- This is a 3-bed/1.0-bath single-family listed at $98k. Condition is rated fair.
Deal economics
- At list price, monthly cash flow is $278 ($3k/yr) — positive.
- The deal already cash-flows at list — no discount required.
- Meets the 1% rule at list price ($1k rent vs $98k).
Location & tenants
- Location reads 50/100 on livability (#1,704 in PA) — a working-class tenant base; expect higher turnover. Strengths: cost of living A+, crime A; Watch: health & safety D, schools F, amenities F.
- Benton Area SD (rural): math 32% / reading 52% proficiency, ranked #329 of 539 in PA (top 61%) — families likely to look elsewhere, expect single-tenant / working-renter base with shorter leases.
- Market conditions: 25 active listings in the ZIP; 82 units permitted in Columbia County in 2024 (0 in 5+ unit buildings).
Forward outlook
- In year one you build about $3k of equity ($678 loan paydown + $2k appreciation (2.5% local appreciation)).
- Columbia County population projected at -12% by 2050 — secular population decline; favor cash flow + early exit over multi-decade hold.
- At projected returns (2.5% appreciation + 3.0% rent growth), your $27k cash investment doubles in ~4 years — after that, you're playing with house money.
- By year 10, paydown + projected appreciation supports a ~$30k cash-out refi (75% LTV) — recoverable capital for the next deal without selling this one.
Negotiation context
- Only 3 days on market — expect competitive offers; lowballing is unlikely to land.
- 5 sale attempts since 2y ago with the ask held roughly flat each time — persistent listings suggest the price (not the market) is what's stuck; bring a comps-based counter.
Questions for the listing agent
- Have any recent inspections been done? Can we get a copy of the seller's disclosures and any deferred-maintenance estimates?
- Is there a deadline driving the sale (1031 exchange, divorce, estate, relocation)? That informs how much negotiation room exists.
- Schools are F-rated, which usually means shorter tenancies and higher turnover. Who's the typical renter profile here, and what's been the actual vacancy rate?
- What's the average days-on-market for RENTAL listings here right now (not sales)? A rising rental-DOM trend means longer vacancies and softer asking-rent achievability than the comps imply.
- What's the recent tenant-quality profile in this submarket — average credit score on applications, eviction rate, late-payment / NSF rate, and stable-employment percentage? A property-management company in the area should have these aggregated.
- How much new for-sale + rental construction is in the pipeline within 1–3 miles? Heavy new supply typically softens prices + rents 12–24 months out; constrained supply supports both.
Investment metrics
- 1% rule
- 1.23% ✓
- Cap rate
- 9.70%
- Cash-on-cash
- 12.18%
- DSCR
- 1.54
- GRM
- 6.8
CMA / ARV
No comps found within radius.
Projected returns pro-forma
2.48% appreciation · 3.0% rent growth · sell at horizon
- IRR
- 17.7%
- Equity multiple
- 1.98×
- Total profit
- $26,877
- Equity at exit
- $41,211
- IRR
- 19.5%
- Equity multiple
- 3.71×
- Total profit
- $74,273
- Equity at exit
- $61,375
Cash invested: $27,440 (down + closing). Projections, not guarantees.
Landlord ↔ Tenant lean methodology
- Overall (STATE)
- 62 Landlord-Friendly
- State Pennsylvania
- 62 Landlord-Friendly · EVEN
- County
- — inherits STATE
- City
- — inherits STATE
ZIP-level market 17814
- Home prices YoY
- 0.9%
- Active inventory
- 25
- Price-to-rent
- 6.8×
Monthly cashflow live
- Estimated rent
- $1,210 medium interval (Pro) →
- Mortgage (P&I)
- −$514
- Tax est. 1.5%
- −$122 /mo · $1,470/yr
- Insurance
- −$41
- HOA
- −$0
- Vacancy / Maint / Mgmt
- −$254
- Net cashflow
- $278
Break-even live
UW: 25.0% down · 7.5% · 30yr · 1.5% tax · 5.0% vac · 8.0% maint · 8.0% mgmt
Financing live
Cash to close
- Down payment
- $24,500
- Closing costs
- $2,940
- Reserves months
- —
- Total cash needed
- —
Loan-product check · same deal, 3 products live
Conventional
25% down · 7.5% · 30yr
- Down + closing
- —
- Monthly P&I
- —
- Monthly cashflow
- —
- DSCR
- —
- Eligible?
- —
Personal DTI + credit; lowest rate.
DSCR
20% down · 8.5% · 30yr
- Down + closing
- —
- Monthly P&I
- —
- Monthly cashflow
- —
- DSCR
- —
- Eligible?
- —
No personal income docs; deal must DSCR.
Hard money
10% down · 12.0% · 12mo
- Down + closing
- —
- Monthly P&I
- —
- Monthly cashflow
- —
- DSCR
- —
- Eligible?
- —
Short-term bridge; refi at stabilization.
Listing history 4 events
-
2026-06-04statusdays on market $98,000 Pending 3 DOM
-
2026-06-02days on market $98,000 Active 2 DOM
-
2026-05-31remarks 397-char remark
-
2026-05-31$98,000 Active 1 DOM
ⓘ Source: listings_history table (triggers on properties + properties_extension) + one-shot
backfill from property_details.listing_events for pre-trigger history.
Climate risk First Street
- Flood 1/10 Low FEMA zone X (unshaded) · 0% chance over 30 yrs
- Wildfire 3/10 Moderate
- Heat 3/10 Moderate 7 d/yr ≥94°F today · 15 d/yr by 30 yrs out
- Wind 2/10 Low 4% chance of damaging wind over 30 yrs
- Air quality 2/10 Low 1 unhealthy d/yr today · 2 by 30 yrs out
Nearby sold comps map
Loading sold comps map…
Walkable amenities ~0.75 mi
Loading nearby amenities…
Taxation est. · year 1
- Rental income
- $14,517
- − Mortgage interest
- −$5,490
- − Property taxes
- −$1,470
- − Insurance
- −$490
- − Repairs & maintenance
- −$1,161
- − Management
- −$1,161
- − Depreciation
- −$2,851
- Taxable income
- $1,894
- Est. tax owed @ 24.0%
- −$455
- After-tax cash flow
- $2,887/yr
For passive investors: Depreciation is non-cash, so a rental often shows a tax loss while cash-flowing — sheltering income. Rental losses are passive: they offset passive income freely, and up to $25,000/yr can offset ordinary (W-2) income if you actively participate and your MAGI is under $100k (phasing out to $0 by $150k); unused losses carry forward. On sale, claimed depreciation is recaptured at up to 25%, and gains may owe capital-gains tax (a 1031 exchange can defer both). Figures are a year-1 estimate at your 24.0% rate — not tax advice; consult a CPA.
Condition & rehab AI · 12 photos
The property is in fair condition with moderate renovations needed. The exposed framing and subflooring indicate significant structural damage that requires major repairs. Painting and installing appliances and fixtures would significantly increase its value.
Repairs flagged
- Major Exposed subflooring — Structural damage
- Major Exposed framing — Structural damage
- Major Exposed electrical panel — Structural damage
Value-add opportunities
- Both Paint interior walls — Enhances curb appeal and interior aesthetics
- Both Install appliances in kitchen — Improves functionality and appeal
- Both Install fixtures in bath — Enhances functionality and appeal
Renovation cost estimate screening
| Repair item | Severity | Est. cost |
|---|---|---|
| Exposed subflooring · Structural damage | Major | $15,000–50,000 |
| Exposed framing · Structural damage | Major | $15,000–50,000 |
| Exposed electrical panel · Structural damage | Major | $15,000–50,000 |
| Total estimated repair cost · 3 items | $45,000–150,000 |
Value-add ROI direction
- Both Paint interior walls — Enhances curb appeal and interior aesthetics ↑
- Both Install appliances in kitchen — Improves functionality and appeal ↑
- Both Install fixtures in bath — Enhances functionality and appeal ↑
ⓘ Cost ranges are severity-bucket heuristics (US national rule-of-thumb). Get contractor quotes + a written scope before underwriting a rehab budget.
Schools (NCES district)
- District
- Benton Area SD
- NCES district ID
- 4203390
- Math proficiency
- 32% ▼ -17.00%
- Reading proficiency
- 52% ▼ -18.00%
- Median HH income
- $46,806
- Composite
- 35.77/100
- National rank
- #4844
- State rank
- #329 of 539 in PA
Livability — Waller
- Score
- 50/100
- State rank
- #1704
- US rank
- #25580
Category grades
Schools grade is shown separately in the Schools card above.
Census & demographics
- Population (ZIP)
- 4,806
Population outlook (Columbia County) Hauer SSP2
- Today (2025)
- 65,170 people
- By 2030
- 64,054 · -1.7%
- By 2040
- 61,131 · -6.2%
- By 2050
- 57,526 · -11.7%
- By 2075
- 50,259 · -22.9%
- By 2100
- 44,756 · -31.3%
Race, ethnicity, and origin ACS 2023
- Neighborhood character
- Predominantly White (90%)
- Race & ethnicity
- White 90% Pacific Islander 4% Two or more races 2% Hispanic / Latino 2% Black 2%
- Common ancestry
- Romanian 8% Iranian 1% Lithuanian 1%
- Foreign-born
- 6% · Canada
- Languages at home
- 93% English-only · Spanish 2%
Political lean MEDSL · Columbia
- 2024 margin
- Solid R (+31.0) · D 34.0% · R 65.0%
- 2008→2024 swing
- -26.6pp toward R · 2008: -4.5pp · 2024: -31.0pp
- All cycles
- 2024: R+31.0 2020: R+30.7 2016: R+32.8 2012: R+12.4 2008: R+4.5
Not yet ingested
- Civics
- —
Market trends
- HPI YoY
- ▲ 2.48%
- Current HPI
- 269.4514
- Rent YoY
- —
- Metro
- —
- State GDP YoY
- ▲ 1.68%
- F500 in state
- 34
Industry mix (Fortune 500 HQ in PA)
| Industry | F500 HQs | Revenue |
|---|---|---|
| Healthcare | 2 | $309B |
|
||
| Insurance | 2 | $27B |
|
||
| Telecommunications / Media | 1 | $124B |
|
||
| Industrial Distribution | 1 | $22B |
|
||
| Financial Services | 1 | $20B |
|
||
| Chemicals / Materials | 1 | $18B |
|
||
Price history
-42.2% since first listed8 events — show timeline
- 2026-05-31 Listed $98,000 LCAR
- 2025-03-07 Contingent — CSVBR
- 2025-03-02 Relisted — CSVBR
- 2025-02-01 Relisted — CSVBR
- 2025-01-29 Price Changed $145,000 CSVBR
- 2025-01-02 Relisted — CSVBR
- 2024-12-05 Price Changed $159,500 CSVBR
- 2024-11-10 Listed $169,500 CSVBR
Cash-flow waterfall
monthlySold comps — $/sqft
last 12 mo · ≤1 miLoading sold comps…