1820 1st Ave S #102 · Minneapolis, MN
Flood risk 1/10 · Minimal
- FEMA flood zone
- X (unshaded)
- Chance of flooding over 30 yrs
- 0.0%
- Est. flood insurance / yr
- $507 – $1,088
Fire risk 1/10 · Minimal
- Est. fire insurance / yr
- $888 – $1,650
Heat risk 2/10 · Minimal
- Hot days now (above 99°F)
- 7 days/yr
- Hot days in 30 yrs
- 14 days/yr
Wind risk 2/10 · Minimal
- Chance of severe wind over 30 yrs
- —
Air-quality risk 2/10 · Minimal
- Unhealthy air days now
- 1 days/yr
- Unhealthy air days in 30 yrs
- 1 days/yr
Risk factors via First Street. Map © Google.
Why this score? — see what drove the D grade
The composite is a weighted blend of 9 inputs, each scored 0–100. Each bar is that input's sub-score; the figure is the points it added to the 100-point composite (weight × sub-score).
- ARV discount +15.0/15.0
- 1% rule +10.0/10.0
- Cash flow +3.9/30.0
- Livability +3.9/5.0
- Rent growth +3.8/5.0
- Schools +3.5/10.0
- Condition / age +2.5/5.0
- DSCR +0.0/10.0
- Appreciation +0.0/10.0
$70,000
🖨 Deal sheet 📄 Offer letter ✓ Due diligence
Listing remarks MLS
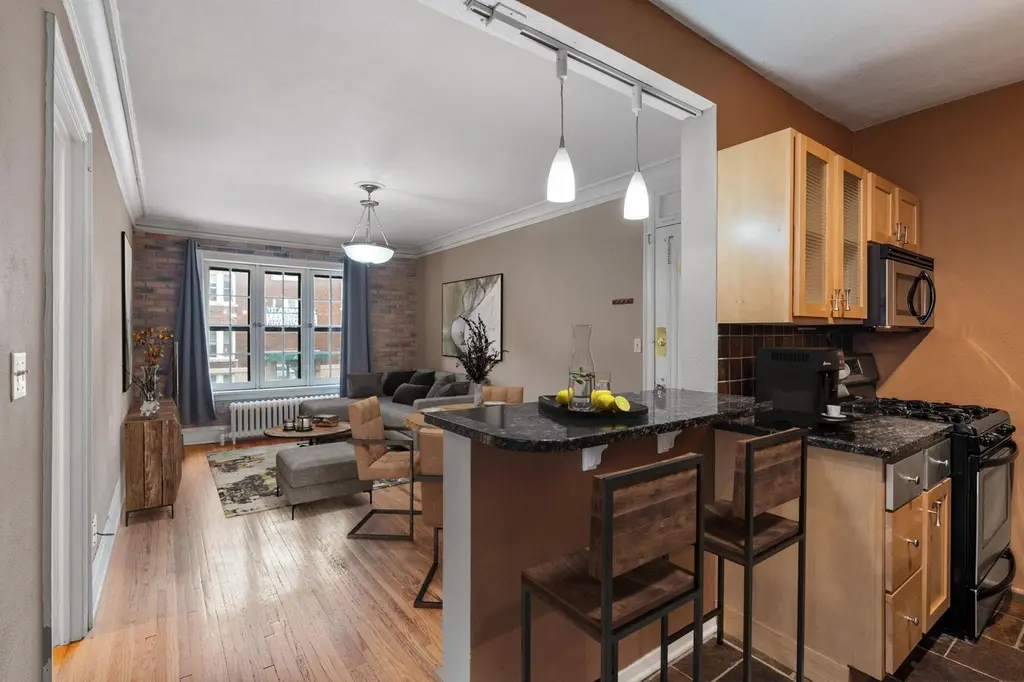
This unit is bursting with character and is ready for your unique touch! With exposed brick and a corner layout, it’s just waiting for the charm a buyer like you can bring. Located just south of downtown Minneapolis, this well-maintained 1BR/1BA condo in a historic brownstone is perfect for a downtown worker, college student, or a solid rental investment. Tucked into a transit-rich area, you'll have entertainment and dining options just blocks away. Come see what makes this home so special!
Key facts
- Exposed brick
- Historic brownstone
- Corner layout
Tags
Neighborhood map
What this means for you Summary
Snapshot
- This is a 1-bed/1.0-bath condo listed at $70k.
Deal economics
- At list price, monthly cash flow is $-198 ($-2k/yr) — negative.
- To cash-flow at today's rent, offer at most $35k (49.9% below list).
- Meets the 1% rule at list price ($1k rent vs $70k).
- Recommended offer: $35k (49.9% below list) — sets the bar for cash-flow.
Location & tenants
- Location reads 78/100 on livability (#110 in MN, #2,525 nationally) — a middle-class / working-renter tenant base. Strengths: amenities A+, commute A+, housing A+; Watch: cost of living C-, crime F.
- Minneapolis Public School District (urban): math 35% / reading 46% proficiency, ranked #217 of 301 in MN (top 72%) — families likely to look elsewhere, expect single-tenant / working-renter base with shorter leases.
- Market conditions: Rents rising fast (+5.1%/yr); 117 active listings in the ZIP; 40 comparable units currently listed for rent nearby; rentals at typical pace (median 24d on market — plan ~3-4 weeks tenant-placement turnaround); 4,651 units permitted in Hennepin County in 2024 (2,443 in 5+ unit buildings).
Forward outlook
- Local home prices are declining (-3.0%/yr); year-one equity from $484 of loan paydown is wiped out by about $2k of value loss. Plan a longer hold.
- Hennepin County population projected at +30% by 2050 — long-run rental-demand tailwind backs the buy-and-hold thesis.
Negotiation context
- It's been on market 205 days — a 12% lower offer ($62k) is reasonable based on typical stale-listing flexibility.
- 8 sale attempts since 18y ago; this cycle's ask has dropped $8k (10%) from the opening price — seller is motivated, your offer sets the floor, not the list.
Risks & watch-outs
- Watch-outs: HOA is 52% of rent; built in 1925 — expect roof / HVAC / electrical / plumbing capex.
Questions for the listing agent
- What do current leases actually rent for vs. the listed asking? Can we see a recent rent roll and the last 12 months of T-12 income?
- It's been on market 205 days. Have you received any prior offers? Is the seller open to a 50% concession, seller financing, or rate buy-down credit?
- Built in 1925 — when were the roof, HVAC, electrical panel, plumbing, and water heater last replaced?
- What does the HOA fee cover, when was the last increase, and are there any pending special assessments or reserve-fund shortfalls?
- Any open or pending special assessments — roof, HVAC, plumbing, elevator, façade? What's the per-unit balance and payoff schedule, and is the seller paying it off at close or rolling it to the buyer?
- Why hasn't it sold? Are there any deal-killer items the seller is aware of (foundation, flood, title, zoning, code violations)?
- Is there a deadline driving the sale (1031 exchange, divorce, estate, relocation)? That informs how much negotiation room exists.
- Crime grade is F in this area — have there been break-ins, vandalism, or insurance claims at this property in the last 3 years? What carrier currently insures it and at what premium?
- The area grade is low — what's the realistic commute time and amenity access for the typical tenant pool here? Any planned neighborhood developments (good or bad) we should know about?
- What's the average days-on-market for RENTAL listings here right now (not sales)? A rising rental-DOM trend means longer vacancies and softer asking-rent achievability than the comps imply.
- What's the recent tenant-quality profile in this submarket — average credit score on applications, eviction rate, late-payment / NSF rate, and stable-employment percentage? A property-management company in the area should have these aggregated.
- How much new apartment / multifamily construction is in the pipeline within 1–3 miles? Heavy new supply (>2% of stock underway) typically softens rents 12–24 months out; light construction supports rent growth.
Investment metrics
- 1% rule
- 1.60% ✓
- Cap rate
- 2.90%
- Cash-on-cash
- -12.11%
- DSCR
- 0.46
- GRM
- 5.2
CMA / ARV
- ARV (median comp)
- $94,575
- List price
- $70,000
- Delta
- -25.98%
- Verdict
- UNDERPRICED
- Comps
- 9 within 1.0 mi
Projected returns pro-forma
-3.0% appreciation · 5.1% rent growth · sell at horizon
- IRR
- -31.3%
- Equity multiple
- -0.08×
- Total profit
- $-21,137
- Equity at exit
- $10,437
- IRR
- -16.9%
- Equity multiple
- -0.16×
- Total profit
- $-22,703
- Equity at exit
- $6,052
Cash invested: $19,600 (down + closing). Projections, not guarantees.
Landlord ↔ Tenant lean methodology
- Overall (CITY)
- 34 Tenant-Leaning
- State Minnesota
- 46 Balanced · D+2
- County
- — inherits STATE
- City Minneapolis
- 34 Tenant-Leaning · D+50
ZIP-level market 55403
- Rents YoY
- 5.1%
- Active inventory
- 117
- Price-to-rent
- 5.2×
Monthly cashflow live
- Estimated rent
- $1,121 high interval (Pro) →
- Mortgage (P&I)
- −$367
- Tax from tax record
- −$109 /mo · $1,309/yr
- Insurance
- −$29
- HOA
- −$578
- Vacancy / Maint / Mgmt
- −$235
- Net cashflow
- $-198
Break-even live
UW: 25.0% down · 7.5% · 30yr · 1.5% tax · 5.0% vac · 8.0% maint · 8.0% mgmt
Financing live
Cash to close
- Down payment
- $17,500
- Closing costs
- $2,100
- Reserves months
- —
- Total cash needed
- —
Loan-product check · same deal, 3 products live
Conventional
25% down · 7.5% · 30yr
- Down + closing
- —
- Monthly P&I
- —
- Monthly cashflow
- —
- DSCR
- —
- Eligible?
- —
Personal DTI + credit; lowest rate.
DSCR
20% down · 8.5% · 30yr
- Down + closing
- —
- Monthly P&I
- —
- Monthly cashflow
- —
- DSCR
- —
- Eligible?
- —
No personal income docs; deal must DSCR.
Hard money
10% down · 12.0% · 12mo
- Down + closing
- —
- Monthly P&I
- —
- Monthly cashflow
- —
- DSCR
- —
- Eligible?
- —
Short-term bridge; refi at stabilization.
Rent comps 40 comps
| Address | Beds | Baths | Sqft | Rent | $/sqft | DOM | Units | Dist |
|---|---|---|---|---|---|---|---|---|
| 1900 1st Ave S Minneapolis, MN | 1.0 | 1.0 | 450 | $799 | $1.78 | 11d | 1 | 0.01mi |
| 1910 1st Ave S Apt 32 Minneapolis, MN | 1.0 | 1.0 | 575 | $975 | $1.70 | 24d | 1 | 0.03mi |
| 1910 1st Ave S Unit 35 Minneapolis, MN | 1.0 | 1.0 | 575 | $975 | $1.70 | 17d | 1 | 0.04mi |
| 1910 1st Ave S Unit 3 Minneapolis, MN | 1.0 | 1.0 | 575 | $965 | $1.68 | 24d | 1 | 0.04mi |
| 1821 1st Ave S #103 Minneapolis, MN | 2.0 | 1.0 | 680 | $1,595 | $2.35 | 13d | 1 | 0.04mi |
| 1821 1st Ave S Minneapolis, MN | 2.0 | 1.0 | 700 | $1,545 | $2.21 | 3d | 2 | 0.05mi |
| 1821 1st Ave S Minneapolis, MN | 1.0–2.0 | 1.0 | 620 | $1,195 | $1.93 | 43d | 2 | 0.05mi |
| 1900 Stevens Ave #35 Minneapolis, MN | 1.0 | 1.0 | 579 | $1,200 | $2.07 | 43d | 1 | 0.07mi |
| 1901 Stevens Ave #105 Minneapolis, MN | 1.0 | 1.0 | 700 | $950 | $1.36 | 43d | 1 | 0.09mi |
| 10 E 18th St Unit E316 Minneapolis, MN | 1.0 | 1.0 | 495 | $1,150 | $2.32 | 43d | 1 | 0.10mi |
| 10 E 18th St Unit E315 Minneapolis, MN | 1.0 | 1.0 | 520 | $1,344 | $2.58 | 7d | 1 | 0.10mi |
| 10 E 18th St Unit E513 Minneapolis, MN | — | 1.0 | 390 | $1,080 | $2.77 | 43d | 1 | 0.10mi |
| 10 E 18th St Unit 1383535P Minneapolis, MN | 1.0 | 1.0 | 592 | $3,594 | $6.07 | 7d | 1 | 0.11mi |
| 10 E 18th St Unit E214 Minneapolis, MN | 1.0 | 1.0 | 620 | $1,445 | $2.33 | 17d | 1 | 0.11mi |
| 10 E 18th St Unit E406 Minneapolis, MN | 1.0 | 1.0 | 470 | $1,233 | $2.62 | 43d | 1 | 0.11mi |
| 10 E 18th St Unit E312 Minneapolis, MN | 1.0 | 1.0 | 620 | $1,357 | $2.19 | 24d | 1 | 0.11mi |
| 10 E 18th St Unit E514 Minneapolis, MN | 1.0 | 1.0 | 590 | $1,444 | $2.45 | 3d | 1 | 0.11mi |
| 10 E 18th St Unit E610 Minneapolis, MN | 1.0 | 1.0 | 560 | $1,494 | $2.67 | 7d | 1 | 0.11mi |
| 10 E 18th St Unit E419 Minneapolis, MN | — | 1.0 | 410 | $1,057 | $2.58 | 21d | 1 | 0.11mi |
| 10 E 18th St Unit E102 Minneapolis, MN | 1.0 | 1.0 | 610 | $1,473 | $2.41 | 14d | 1 | 0.11mi |
| 110 E 18th St Minneapolis, MN | 2.0 | 1.0 | 509 | $1,135 | $2.23 | 24d | 6 | 0.12mi |
| 1702 Nicollet Ave Minneapolis, MN | 3.0 | 1.0–2.0 | 685 | $1,413 | $2.06 | 24d | 23 | 0.13mi |
| 128 E 18th St Unit 8 24 Minneapolis, MN | 1.0 | 1.0 | 512 | $945 | $1.85 | 43d | 1 | 0.13mi |
| 128 E 18th St Unit 21 20 Minneapolis, MN | 1.0 | 1.0 | 410 | $870 | $2.12 | 17d | 1 | 0.13mi |
| 128 E 18th St Unit 11 37 Minneapolis, MN | 1.0 | 1.0 | 420 | $895 | $2.13 | 17d | 1 | 0.13mi |
| 128 E 18th St Unit 24 02 Minneapolis, MN | 1.0 | 1.0 | 750 | $1,175 | $1.57 | 43d | 1 | 0.13mi |
| 128 E 18th St Apt 4 Minneapolis, MN | 1.0 | 1.0 | 600 | $990 | $1.65 | 3d | 1 | 0.13mi |
| 128 E 18th St Apt 2 Minneapolis, MN | 1.0 | 1.0 | 465 | $900 | $1.94 | 17d | 1 | 0.13mi |
| 128 E 18th St Unit 13 25 Minneapolis, MN | 1.0 | 1.0 | 425 | $910 | $2.14 | 43d | 1 | 0.14mi |
| 128 E 18th St Unit 24 321 Minneapolis, MN | — | 1.0 | 400 | $840 | $2.10 | 24d | 1 | 0.14mi |
| 128 E 18th St Unit 8 35 Minneapolis, MN | 1.0 | 1.0 | 465 | $920 | $1.98 | 43d | 1 | 0.14mi |
| 128 E 18th St Unit 15 05 Minneapolis, MN | 1.0 | 1.0 | 425 | $905 | $2.13 | 43d | 1 | 0.14mi |
| 128 E 18th St Unit 10 211 Minneapolis, MN | 1.0 | 1.0 | 575 | $935 | $1.63 | 24d | 1 | 0.14mi |
| 128 E 18th St Unit 7 02 Minneapolis, MN | 1.0 | 1.0 | 600 | $990 | $1.65 | 43d | 1 | 0.14mi |
| 128 E 18th St Unit 4 34 Minneapolis, MN | 1.0 | 1.0 | 600 | $980 | $1.63 | 24d | 1 | 0.14mi |
| 128 E 18th St Unit 8 06 Minneapolis, MN | 1.0 | 1.0 | 465 | $925 | $1.99 | 17d | 1 | 0.14mi |
| 128 E 18th St Unit 10 305 Minneapolis, MN | 1.0 | 1.0 | 560 | $925 | $1.65 | 43d | 1 | 0.14mi |
| 128 E 18th St Unit 14 26 Minneapolis, MN | 1.0 | 1.0 | 425 | $905 | $2.13 | 24d | 1 | 0.14mi |
| 1912 3rd Ave S Unit SO Minneapolis, MN | 1.0 | 1.0 | 420 | $970 | $2.31 | 43d | 1 | 0.19mi |
| 1920 3rd Ave S #206 Minneapolis, MN | 1.0 | 1.0 | 420 | $999 | $2.38 | 13d | 1 | 0.20mi |
HOA detail condo
- Monthly dues
- $578 · $6,936/yr
- Assessments
- None detected in remarks — confirm with the listing agent.
Listing history 39 events
-
2026-06-17status $70,000 Pending 205 DOM
-
2026-06-17days on market $70,000 Contingent - Inspection 205 DOM
-
2026-06-16days on market $70,000 Contingent - Inspection 204 DOM
-
2026-06-15days on market $70,000 Contingent - Inspection 203 DOM
-
2026-06-13days on market $70,000 Contingent - Inspection 201 DOM
-
2026-06-09days on market $70,000 Contingent - Inspection 197 DOM
-
2026-06-08days on market $70,000 Contingent - Inspection 196 DOM
-
2026-06-07days on market $70,000 Contingent - Inspection 195 DOM
-
2026-06-04days on market $70,000 Contingent - Inspection 192 DOM
-
2026-06-03statusdays on market $70,000 Contingent - Inspection 191 DOM
-
2026-06-02days on market $70,000 Active 190 DOM
-
2026-06-01days on market $70,000 Active 189 DOM
-
2026-05-31days on market $70,000 Active 188 DOM
-
2026-03-31price $70,000 501-char remark
Show marketing remark (501 chars)
This unit is bursting with character and is ready for your unique touch! With exposed brick and a corner layout, it’s just waiting for the charm a buyer like you can bring. Located just south of downtown Minneapolis, this well-maintained 1BR/1BA condo in a historic brownstone is perfect for a downtown worker, college student, or a solid rental investment. Tucked into a transit-rich area, you'll have entertainment and dining options just blocks away. Come see what makes this home so special!
-
2026-03-06price $72,000 501-char remark
Show marketing remark (501 chars)
This unit is bursting with character and is ready for your unique touch! With exposed brick and a corner layout, it’s just waiting for the charm a buyer like you can bring. Located just south of downtown Minneapolis, this well-maintained 1BR/1BA condo in a historic brownstone is perfect for a downtown worker, college student, or a solid rental investment. Tucked into a transit-rich area, you'll have entertainment and dining options just blocks away. Come see what makes this home so special!
-
2025-12-29price $75,000 501-char remark
Show marketing remark (501 chars)
This unit is bursting with character and is ready for your unique touch! With exposed brick and a corner layout, it’s just waiting for the charm a buyer like you can bring. Located just south of downtown Minneapolis, this well-maintained 1BR/1BA condo in a historic brownstone is perfect for a downtown worker, college student, or a solid rental investment. Tucked into a transit-rich area, you'll have entertainment and dining options just blocks away. Come see what makes this home so special!
-
2025-11-21$78,000 Active 501-char remark
Show marketing remark (501 chars)
This unit is bursting with character and is ready for your unique touch! With exposed brick and a corner layout, it’s just waiting for the charm a buyer like you can bring. Located just south of downtown Minneapolis, this well-maintained 1BR/1BA condo in a historic brownstone is perfect for a downtown worker, college student, or a solid rental investment. Tucked into a transit-rich area, you'll have entertainment and dining options just blocks away. Come see what makes this home so special!
-
2025-10-19historical
-
2025-07-29price $80,000
-
2025-07-07price $82,500
-
2025-04-24$85,000 Active
-
2025-04-15historical
-
2025-03-07price $90,000
-
2024-12-06price $92,500
-
2024-10-24$95,000 Active
-
2024-09-26historical $949
-
2024-09-10$949
-
2024-09-01historical $949
-
2024-08-22price $949
-
2024-07-08price $999
-
2024-04-30$1,099
-
2023-07-08historical
-
2009-05-28soldstatus $102,500
-
2009-05-07historical
-
2009-04-03$104,900
-
2009-04-02historical
-
2008-04-11$108,900
-
2008-04-07historical
-
2008-01-20$128,900
ⓘ Source: listings_history table (triggers on properties + properties_extension) + one-shot
backfill from property_details.listing_events for pre-trigger history.
Tax reassessment forecast MN · Partial reset (capped growth)
- Current annual tax
- $1,309 · $109/mo
- Projected year-2 tax
- $1,309 · $109/mo
- Expected delta
- $0/yr ($0/mo · 0.0%)
ⓘ Screening estimate from a state-policy table — verify with the county assessor before closing.
Climate risk First Street
- Flood 1/10 Low FEMA zone X (unshaded) · 0% chance over 30 yrs
- Wildfire 1/10 Low
- Heat 2/10 Low 7 d/yr ≥99°F today · 14 d/yr by 30 yrs out
- Wind 2/10 Low
- Air quality 2/10 Low 1 unhealthy d/yr today · 1 by 30 yrs out
Nearby sold comps map
Loading sold comps map…
Walkable amenities ~0.75 mi
Loading nearby amenities…
Taxation est. · year 1
- Rental income
- $13,451
- − Mortgage interest
- −$3,921
- − Property taxes
- −$1,309
- − Insurance
- −$350
- − Repairs & maintenance
- −$1,076
- − Management
- −$1,076
- − HOA
- −$6,936
- − Depreciation
- −$2,036
- Taxable loss
- −$3,253
- Est. tax savings @ 24.0%
- +$781
- After-tax cash flow
- $-1,593/yr
For passive investors: Depreciation is non-cash, so a rental often shows a tax loss while cash-flowing — sheltering income. Rental losses are passive: they offset passive income freely, and up to $25,000/yr can offset ordinary (W-2) income if you actively participate and your MAGI is under $100k (phasing out to $0 by $150k); unused losses carry forward. On sale, claimed depreciation is recaptured at up to 25%, and gains may owe capital-gains tax (a 1031 exchange can defer both). Figures are a year-1 estimate at your 24.0% rate — not tax advice; consult a CPA.
Schools (NCES district)
- District
- Minneapolis Public School District
- NCES district ID
- 2721240
- Math proficiency
- 35% ▼ -7.00%
- Reading proficiency
- 46% ▼ -1.00%
- Median HH income
- $50,521
- Composite
- 34.92/100
- National rank
- #5067
- State rank
- #217 of 301 in MN
Livability — Minneapolis
- Score
- 78/100
- State rank
- #110
- US rank
- #2525
Category grades
Schools grade is shown separately in the Schools card above.
Census & demographics
- Census place
- Minneapolis, MN
- County
- Hennepin County · 1,150,272 people
- City population
- 417,555
- Metro
- Minneapolis-St. Paul-Bloomington, MN-WI
- Population (ZIP)
- 17,601
- Household income
- $60,873
- Rent vs Own
- Severe rent burden
- 1701.0
Population outlook (Hennepin County) Hauer SSP2
- Today (2025)
- 1,405,227 people
- By 2030
- 1,492,650 · +6.2%
- By 2040
- 1,660,157 · +18.1%
- By 2050
- 1,823,498 · +29.8%
- By 2075
- 2,221,283 · +58.1%
- By 2100
- 2,509,976 · +78.6%
Race, ethnicity, and origin ACS 2023
- Neighborhood character
- Predominantly White (69%)
- Race & ethnicity
- White 69% Black 14% Two or more races 7% Hispanic / Latino 7% Asian 5% Native American 1%
- Hispanic origin (detail)
- Mexican 5%
- Common ancestry
- Portuguese 8% Romanian 6% Lithuanian 2%
- Foreign-born
- 13% · Canada, South Korea, China
- Languages at home
- 85% English-only · Spanish 5% Other Indo-European 3% French/Haitian/Cajun 2%
Political lean MEDSL · Hennepin
- 2024 margin
- Solid D (+42.6) · D 70.2% · R 27.5% · Other 2.3%
- 2008→2024 swing
- +14.0pp toward D · 2008: 28.6pp · 2024: 42.6pp
- All cycles
- 2024: D+42.6 2020: D+43.2 2016: D+35.3 2012: D+27.1 2008: D+28.6
Not yet ingested
- Civics
- —
Market trends
- HPI YoY
- ▼ -89.40%
- Current HPI
- 127.1575
- Rent YoY
- ▲ 5.10%
- Metro
- Minneapolis-St. Paul-Bloomington, MN-WI
- State GDP YoY
- ▲ 2.41%
- F500 in state
- 34
Industry mix (Fortune 500 HQ in MN)
| Industry | F500 HQs | Revenue |
|---|---|---|
| Healthcare | 2 | $407B |
|
||
| Retail | 2 | $150B |
|
||
| Consumer Goods | 2 | $32B |
|
||
| Industrial Machinery | 2 | $6B |
|
||
| Agriculture | 1 | $40B |
|
||
| Healthcare / Medical Devices | 1 | $32B |
|
||
Price history
-45.7% since first listed26 events — show timeline
- 2026-03-31 Price Changed $70,000 NORTHSTARMLS as Distributed by MLS Grid
- 2026-03-06 Price Changed $72,000 NORTHSTARMLS as Distributed by MLS Grid
- 2025-12-29 Price Changed $75,000 NORTHSTARMLS as Distributed by MLS Grid
- 2025-11-21 Listed $78,000 NORTHSTARMLS as Distributed by MLS Grid
- 2025-10-19 Listing Removed — NORTHSTARMLS as Distributed by MLS Grid
- 2025-07-29 Price Changed $80,000 NORTHSTARMLS as Distributed by MLS Grid
- 2025-07-07 Price Changed $82,500 NORTHSTARMLS as Distributed by MLS Grid
- 2025-04-24 Listed $85,000 NORTHSTARMLS as Distributed by MLS Grid
- 2025-04-15 Listing Removed — NORTHSTARMLS as Distributed by MLS Grid
- 2025-03-07 Price Changed $90,000 NORTHSTARMLS as Distributed by MLS Grid
- 2024-12-06 Price Changed $92,500 NORTHSTARMLS as Distributed by MLS Grid
- 2024-10-24 Listed $95,000 NORTHSTARMLS as Distributed by MLS Grid
- 2024-09-26 Rental Removed $949 APPFOLIO
- 2024-09-10 Listed for Rent $949 APPFOLIO
- 2024-09-01 Rental Removed $949 APPFOLIO
- 2024-08-22 Price Changed $949 APPFOLIO
- 2024-07-08 Price Changed $999 APPFOLIO
- 2024-04-30 Listed for Rent $1,099 APPFOLIO
- 2023-07-08 Rental Removed — RENTLY
- 2009-05-28 Sold (MLS) $102,500 NORTHSTARMLS as Distributed by MLS Grid
- 2009-05-07 Listing Removed — NORTHSTARMLS as Distributed by MLS Grid
- 2009-04-03 Listed $104,900 NORTHSTARMLS as Distributed by MLS Grid
- 2009-04-02 Listing Removed — NORTHSTARMLS as Distributed by MLS Grid
- 2008-04-11 Listed $108,900 NORTHSTARMLS as Distributed by MLS Grid
- 2008-04-07 Listing Removed — NORTHSTARMLS as Distributed by MLS Grid
- 2008-01-20 Listed $128,900 NORTHSTARMLS as Distributed by MLS Grid
Property tax history
+0.9%/yrLatest (2025): $1,309 · -2.7% YoY. Source: county tax records.
Cash-flow waterfall
monthlySold comps — $/sqft
last 12 mo · ≤1 miLoading sold comps…