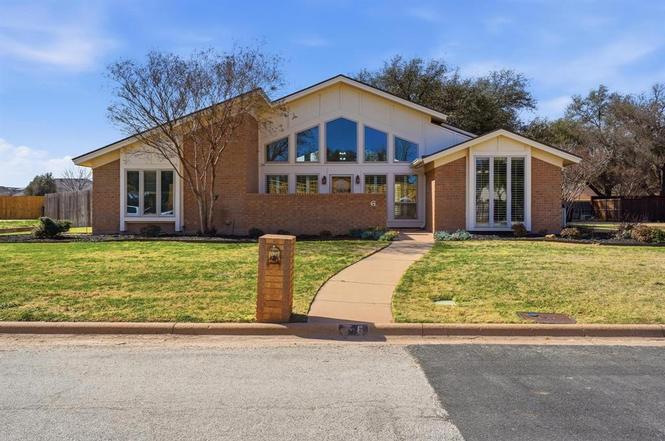
6 Augusta Dr · Abilene, TX
Flood risk No data
- FEMA flood zone
- —
- Chance of flooding over 30 yrs
- —
- Est. flood insurance / yr
- —
Fire risk No data
- Est. fire insurance / yr
- —
Heat risk No data
- Hot days now (above threshold)
- —
- Hot days in 30 yrs
- —
Wind risk No data
- Chance of severe wind over 30 yrs
- —
Air-quality risk No data
- Unhealthy air days now
- —
- Unhealthy air days in 30 yrs
- —
Risk factors via First Street. Map © Google.
Why this score? — see what drove the C- grade
The composite is a weighted blend of 9 inputs, each scored 0–100. Each bar is that input's sub-score; the figure is the points it added to the 100-point composite (weight × sub-score).
- Cash flow +17.8/30.0
- ARV discount +10.3/15.0
- DSCR +5.6/10.0
- 1% rule +5.0/10.0
- Rent growth +5.0/5.0
- Livability +3.8/5.0
- Schools +2.8/10.0
- Condition / age +2.5/5.0
- Appreciation +0.0/10.0
$399,900
🖨 Deal sheet (PDF) 📄 Offer letter ✓ Due diligence
Listing remarks
Spacious 4 bed-2.5 bath in Fairway Oaks, right across the street from the golf course. The interior features vaulted ceilings, two large living areas, a formal dining room, an updated kitchen, big bedrooms, and a primary suite with tons of space. The exterior offers a hot tub, a storage building with built in shelving, mature trees, long driveway, and no neighbors behind the property!
Key facts
- Hot tub
- Built in shelving
- Storage building
Tags
Property features AI
Finance
- Other: Property listed as residential single-family; Subdivision: Fairways
- HOA & community: Mandatory HOA (Fairway Oaks HOA); HOA fee $300 annually; HOA covers grounds maintenance
Exterior
- Parking: Attached 2-car garage; Covered parking for 2 vehicles; 2-car single door configuration
- Utilities: City water; City sewer; Natural gas available; Not in a municipal utility district
- Home design: Single-family residence; One story
- Construction: Brick construction; Composition roof; Slab foundation; Built in 1979
- Exterior features: Gutters; Storage; Wood fencing
Interior
- Kitchen: Dishwasher; Disposal; Electric cooktop; Double oven; Microwave
- Bedrooms: 4 bedrooms (primary bedroom on main level)
- Flooring: Carpet; Tile
- Bathrooms: 3 total bathrooms (2 full, 1 half)
- Heating & cooling: Central heating (natural gas); Central air conditioning (electric)
- Interior features: Vaulted ceilings; Two living areas; One dining area
Neighborhood map
What this means for you Summary
Snapshot
- This is a 4-bed/2.0-bath single-family listed at $400k.
Deal economics
- At list price, monthly cash flow is $330 ($4k/yr) — positive.
- The deal already cash-flows at list — no discount required.
- Meets the 1% rule at list price ($4k rent vs $400k).
- Recommended offer: $376k (6.0% below list) — sets the bar for market timing.
Location & tenants
- Location reads 75/100 on livability (#142 in TX, #4,037 nationally) — a middle-class / working-renter tenant base. Strengths: cost of living A+, housing A+, health & safety A+; Watch: crime D, commute F.
- Abilene ISD (urban): math 32% / reading 34% proficiency, ranked #575 of 826 in TX (top 70%) — families likely to look elsewhere, expect single-tenant / working-renter base with shorter leases.
- Zoned schools: Ward El (math 38% / reading 40%, grade F, #1,651 of 4,322 statewide, top 39%, 494 students, 52% FRL).
- Market conditions: Rents rising fast (+40.7%/yr); 288 active listings in the ZIP; 4 comparable units currently listed for rent nearby; rentals at typical pace (median 25d on market — plan ~3-4 weeks tenant-placement turnaround); solid renter incomes; 508 units permitted in Taylor County in 2024 (0 in 5+ unit buildings).
- At $4,007/mo this rent would consume 61% of the median local household income ($79k/yr) (locally 1181% of renters already pay >50% of income on rent) — very limited rent-growth headroom before tenants either downsize or default.
Forward outlook
- Local home prices are declining (-3.0%/yr); year-one equity from $3k of loan paydown is wiped out by about $12k of value loss. Plan a longer hold.
- Taylor County population projected at +16% by 2050 — long-run rental-demand tailwind backs the buy-and-hold thesis.
- At projected returns (-3.0% appreciation + 8.0% rent growth), your $112k cash investment doubles in ~10 years — after that, you're playing with house money.
Negotiation context
- It's been on market 77 days — a 6% lower offer ($376k) is reasonable based on typical stale-listing flexibility.
- 3 sale attempts since 11y ago with the ask held roughly flat each time — persistent listings suggest the price (not the market) is what's stuck; bring a comps-based counter.
Questions for the listing agent
- It's been on market 77 days. Have you received any prior offers? Is the seller open to a 6% concession, seller financing, or rate buy-down credit?
- Built in 1979 — when were the roof, HVAC, electrical panel, plumbing, and water heater last replaced?
- What does the HOA fee cover, when was the last increase, and are there any pending special assessments or reserve-fund shortfalls?
- Why hasn't it sold? Are there any deal-killer items the seller is aware of (foundation, flood, title, zoning, code violations)?
- Is there a deadline driving the sale (1031 exchange, divorce, estate, relocation)? That informs how much negotiation room exists.
- Schools are D-rated, which usually means shorter tenancies and higher turnover. Who's the typical renter profile here, and what's been the actual vacancy rate?
- Crime grade is D in this area — have there been break-ins, vandalism, or insurance claims at this property in the last 3 years? What carrier currently insures it and at what premium?
- What's the average days-on-market for RENTAL listings here right now (not sales)? A rising rental-DOM trend means longer vacancies and softer asking-rent achievability than the comps imply.
- What's the recent tenant-quality profile in this submarket — average credit score on applications, eviction rate, late-payment / NSF rate, and stable-employment percentage? A property-management company in the area should have these aggregated.
- How much new for-sale + rental construction is in the pipeline within 1–3 miles? Heavy new supply typically softens prices + rents 12–24 months out; constrained supply supports both.
Investment metrics
- 1% rule
- 1.00% ✓
- Cap rate
- 7.28%
- Cash-on-cash
- 3.53%
- DSCR
- 1.16
- GRM
- 8.3
CMA / ARV
- ARV (on-the-fly)
- $426,360
- Comps found
- 12
Show comp detail 12 sales within ~0.75 mi
| Address | Dist | Beds/Ba | Sqft | Sold | Price | $/sf | Match |
|---|---|---|---|---|---|---|---|
| 6 Augusta Dr | 0.00mi | 4/2.5 | 2,805 (0%) | 1mo | $399,900 | $143 | 97 |
| 2558 Meadow Lake Dr | 0.42mi | 3/2.0 (-1) | 2,598 (-7%) | 2mo | $325,000 | $125 | 62 |
| 5501 Chimney Rock Rd | 0.42mi | 4/3.0 | 2,628 (-6%) | 6mo | $399,900 | $152 | 61 |
| 8 Fairway Oaks Blvd | 0.18mi | 3/2.5 (-1) | 3,222 (+15%) | 2mo | $545,000 | $169 | 58 |
| 6249 Bay Hill Dr | 0.74mi | 4/3.0 | 2,761 (-2%) | 6mo | $449,900 | $163 | 54 |
| 5518 Chimney Rock Rd | 0.39mi | 4/4.0 | 2,436 (-13%) | 2mo | $319,900 | $131 | 50 |
| 42 Riviera Cir | 0.33mi | 3/3.0 (-1) | 2,429 (-13%) | 5mo | $425,000 | $175 | 49 |
| 33 Tamarisk Cir | 0.47mi | 3/2.0 (-1) | 2,427 (-14%) | 5mo | $420,000 | $173 | 46 |
| 6134 Laurel Ct | 0.69mi | 3/2.5 (-1) | 2,532 (-10%) | 2mo | $305,150 | $121 | 42 |
| 6 Olympic Cir | 0.69mi | 3/2.0 (-1) | 2,442 (-13%) | 1mo | $360,000 | $147 | 40 |
| 55 Pebble Beach St | 0.60mi | 4/4.5 | 3,114 (+11%) | 5mo | $299,999 | $96 | 40 |
| 1 Hoylake Dr | 0.73mi | 4/3.5 | 3,153 (+12%) | 8mo | $520,000 | $165 | 33 |
Match score weights: distance 35% · size 25% · config 20% · recency 20%. Top-matched comps best support the ARV.
Projected returns pro-forma
-3.0% appreciation · 8.0% rent growth · sell at horizon
- IRR
- -5.1%
- Equity multiple
- 0.80×
- Total profit
- $-22,524
- Equity at exit
- $59,626
- IRR
- 9.8%
- Equity multiple
- 1.93×
- Total profit
- $104,235
- Equity at exit
- $34,576
Cash invested: $111,972 (down + closing). Projections, not guarantees.
Landlord ↔ Tenant lean methodology
- Overall (STATE)
- 87 Strongly Landlord-Friendly
- State Texas
- 87 Strongly Landlord-Friendly · R+5
- County
- — inherits STATE
- City
- — inherits STATE
ZIP-level market 79606
- Rents YoY
- 40.7%
- Active inventory
- 288
- Price-to-rent
- 8.3×
Monthly cashflow live
- Estimated rent
- $4,007 medium interval (Pro) →
- Mortgage (P&I)
- −$2,097
- Tax from tax record
- −$547 /mo · $6,569/yr
- Insurance
- −$167
- HOA
- −$25
- Vacancy / Maint / Mgmt
- −$842
- Net cashflow
- $330
Break-even live
Sensitivity live
| Price | -10% $556 | -5% $443 | +0% $330 | +5% $216 | +10% $103 |
|---|---|---|---|---|---|
| Rent | -10% $13 | -5% $171 | +0% $330 | +5% $488 | +10% $646 |
| Rate | -1.0pp $531 | -0.5pp $431 | base $330 | +0.5pp $226 | +1.0pp $121 |
UW: 25.0% down · 7.5% · 30yr · 1.5% tax · 5.0% vac · 8.0% maint · 8.0% mgmt
Financing live
Cash to close
- Down payment
- $99,975
- Closing costs
- $11,997
- Reserves months
- —
- Total cash needed
- —
Loan-product check · same deal, 3 products live
Conventional
25% down · 7.5% · 30yr
- Down + closing
- —
- Monthly P&I
- —
- Monthly cashflow
- —
- DSCR
- —
- Eligible?
- —
Personal DTI + credit; lowest rate.
DSCR
20% down · 8.5% · 30yr
- Down + closing
- —
- Monthly P&I
- —
- Monthly cashflow
- —
- DSCR
- —
- Eligible?
- —
No personal income docs; deal must DSCR.
Hard money
10% down · 12.0% · 12mo
- Down + closing
- —
- Monthly P&I
- —
- Monthly cashflow
- —
- DSCR
- —
- Eligible?
- —
Short-term bridge; refi at stabilization.
Rent comps 4 comps
| Address | Beds | Baths | Sqft | Rent | $/sqft | DOM | Units | Dist |
|---|---|---|---|---|---|---|---|---|
| 5400 Ridgeline Dr Abilene, TX | 3.0 | 2.0 | 2571 | $6,000 | $2.33 | 25d | 1 | 0.47mi |
| 2418 Helena Cir Abilene, TX | 4.0 | 2.5 | 2478 | $3,700 | $1.49 | 11d | 1 | 0.91mi |
| 2510 Gilmer Ave Abilene, TX | 3.0 | 2.0 | 1974 | $2,995 | $1.52 | 44d | 1 | 0.95mi |
| 4617 Catclaw Dr Abilene, TX | 4.0 | 2.0 | 2263 | $2,500 | $1.10 | 14d | 1 | 1.08mi |
HOA detail
- Monthly dues
- $25 · $300/yr
Listing history 9 events
-
2026-05-06status Pending
-
2026-04-26historical Active Option Contract
-
2026-04-23status Active
-
2026-03-05historical Active Option Contract
-
2026-02-18$399,900 Active
-
2016-07-01historical
-
2016-04-29price $279,900
-
2016-01-14price $289,900
-
2015-08-25$299,900 Active
ⓘ Source: listings_history table (triggers on properties + properties_extension) + one-shot
backfill from property_details.listing_events for pre-trigger history.
Tax reassessment forecast TX · Resets to sale price
- Current annual tax
- $6,569 · $547/mo
- Projected year-2 tax
- $7,318 · $610/mo
- Expected delta
- +$749/yr (+$62/mo · 11.4%)
ⓘ Screening estimate from a state-policy table — verify with the county assessor before closing.
Nearby sold comps map
Loading sold comps map…
Walkable amenities ~0.75 mi
Loading nearby amenities…
Taxation est. · year 1
- Rental income
- $48,088
- − Mortgage interest
- −$22,401
- − Property taxes
- −$6,569
- − Insurance
- −$2,000
- − Repairs & maintenance
- −$3,847
- − Management
- −$3,847
- − HOA
- −$300
- − Depreciation
- −$11,633
- Taxable loss
- −$2,509
- Est. tax savings @ 24.0%
- +$602
- After-tax cash flow
- $4,558/yr
For passive investors: Depreciation is non-cash, so a rental often shows a tax loss while cash-flowing — sheltering income. Rental losses are passive: they offset passive income freely, and up to $25,000/yr can offset ordinary (W-2) income if you actively participate and your MAGI is under $100k (phasing out to $0 by $150k); unused losses carry forward. On sale, claimed depreciation is recaptured at up to 25%, and gains may owe capital-gains tax (a 1031 exchange can defer both). Figures are a year-1 estimate at your 24.0% rate — not tax advice; consult a CPA.
Schools (NCES district)
- District
- Abilene ISD
- NCES district ID
- 4807440
- Math proficiency
- 32% ▼ -11.00%
- Reading proficiency
- 34% ▼ -5.00%
- Median HH income
- $39,782
- Composite
- 27.71/100
- National rank
- #6909
- State rank
- #575 of 826 in TX
Livability — Abilene
- Score
- 75/100
- State rank
- #142
- US rank
- #4037
Category grades
Schools grade is shown separately in the Schools card above.
Census & demographics
- Census place
- Abilene, TX
- County
- Taylor County · 136,672 people
- City population
- 136,672
- Metro
- Abilene, TX
- Population (ZIP)
- 29,182
- Household income
- $79,196
- Rent vs Own
- Severe rent burden
- 1181.0
Population outlook (Taylor County) Hauer SSP2
- Today (2025)
- 145,270 people
- By 2030
- 150,050 · +3.3%
- By 2040
- 159,417 · +9.7%
- By 2050
- 168,883 · +16.3%
- By 2075
- 194,436 · +33.8%
- By 2100
- 203,163 · +39.9%
Race, ethnicity, and origin ACS 2023
- Neighborhood character
- Predominantly White (69%)
- Race & ethnicity
- White 69% Hispanic / Latino 19% Two or more races 11% Black 6% Asian 4%
- Hispanic origin (detail)
- Mexican 14%
- Common ancestry
- Italian 4% Slovak 2% Serbian 1%
- Foreign-born
- 7% · Canada, Vietnam
- Languages at home
- 86% English-only · Spanish 10% Tagalog/Filipino 1% Other Indo-European 1%
Political lean MEDSL · Taylor
- 2024 margin
- Solid R (+49.8) · D 24.6% · R 74.4% · Other 1.0%
- 2008→2024 swing
- -4.2pp toward R · 2008: -45.6pp · 2024: -49.8pp
- All cycles
- 2024: R+49.8 2020: R+45.3 2016: R+51.1 2012: R+53.6 2008: R+45.6
Not yet ingested
- Civics
- —
Market trends
- HPI YoY
- ▼ -167.33%
- Current HPI
- 179.2555
- Rent YoY
- ▲ 40.73%
- Metro
- Abilene, TX
- State GDP YoY
- ▲ 3.95%
- F500 in state
- 110
Industry mix (Fortune 500 HQ in TX)
| Industry | F500 HQs | Revenue |
|---|---|---|
| Energy | 16 | $1,198B |
|
||
| Technology | 5 | $198B |
|
||
| Engineering / Construction | 4 | $72B |
|
||
| Energy Services | 3 | $60B |
|
||
| Utilities | 3 | $41B |
|
||
| Healthcare | 2 | $330B |
|
||
Price history
+33.3% since first listed9 events — show timeline
- 2026-05-06 Pending — NTREIS
- 2026-04-26 Contingent — NTREIS
- 2026-04-23 Relisted — NTREIS
- 2026-03-05 Contingent — NTREIS
- 2026-02-18 Listed $399,900 NTREIS
- 2016-07-01 Listing Removed — NTREIS
- 2016-04-29 Price Changed $279,900 NTREIS
- 2016-01-14 Price Changed $289,900 NTREIS
- 2015-08-25 Listed $299,900 NTREIS
Property tax history
+4.6%/yrLatest (2015): $6,569 · +4.6% YoY. Source: county tax records.
Cash-flow waterfall
monthlySold comps — $/sqft
last 12 mo · ≤1 miLoading sold comps…