1950 Williams St · Williamsdale, OH
Flood risk 4/10 · Minor
- FEMA flood zone
- X (unshaded)
- Chance of flooding over 30 yrs
- 0.22%
- Est. flood insurance / yr
- $507 – $1,088
Fire risk 1/10 · Minimal
- Est. fire insurance / yr
- $713 – $1,323
Heat risk 4/10 · Minor
- Hot days now (above 103°F)
- 7 days/yr
- Hot days in 30 yrs
- 19 days/yr
Wind risk 2/10 · Minimal
- Chance of severe wind over 30 yrs
- 1.0%
Air-quality risk 3/10 · Minor
- Unhealthy air days now
- 2 days/yr
- Unhealthy air days in 30 yrs
- 3 days/yr
Risk factors via First Street. Map © Google.
Why this score? — see what drove the B- grade
The composite is a weighted blend of 9 inputs, each scored 0–100. Each bar is that input's sub-score; the figure is the points it added to the 100-point composite (weight × sub-score).
- Cash flow +30.0/30.0
- 1% rule +10.0/10.0
- DSCR +10.0/10.0
- ARV discount +7.5/15.0
- Livability +3.5/5.0
- Rent growth +3.2/5.0
- Condition / age +2.5/5.0
- Schools +2.4/10.0
- Appreciation +0.0/10.0
$59,900
🖨 Deal sheet 📄 Offer letter ✓ Due diligence
Listing remarks MLS
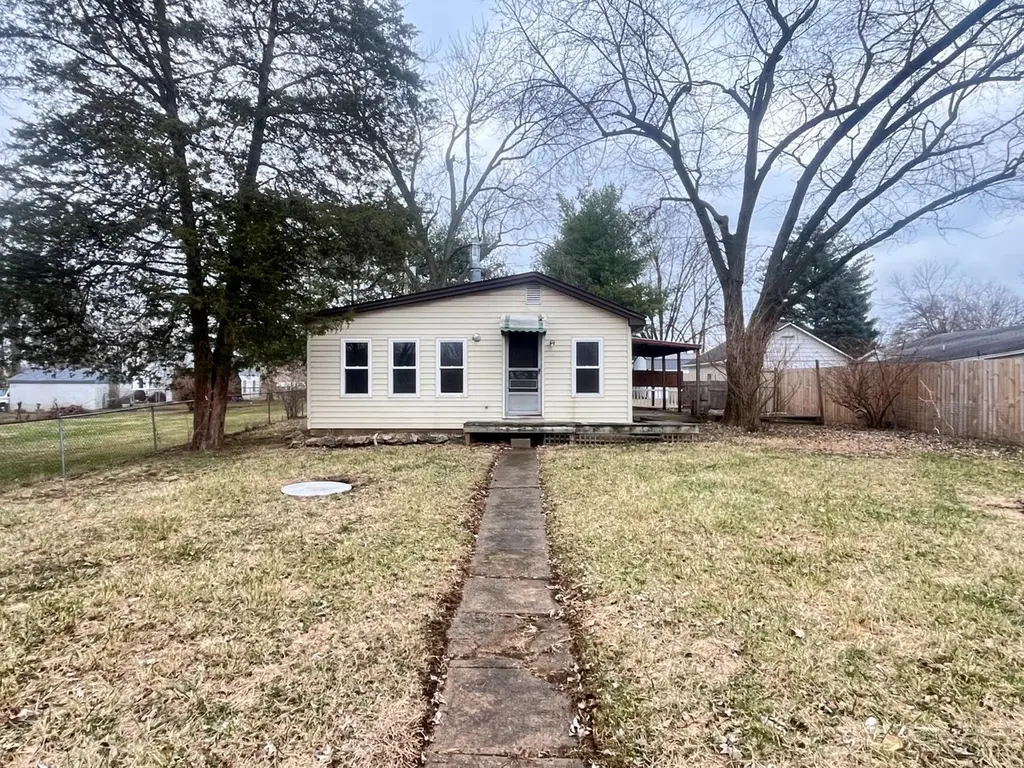
Incredible opportunity and tons of potential in this 3-bedroom ranch. The property sits on a large lot with a storage shed and parking on the street and in the rear. Newer vinyl windows and a covered deck located minutes from Spooky Nook. 1,056 sq ft. Bank owned foreclosure. Purchase agreements must be accompanied by a minimum earnest deposit equal to the greater of 2% of the gross sales price or $1,000. Property being sold as is.
Key facts
- Covered deck
- Newer vinyl windows
- Large lot
Tags
Neighborhood map
What this means for you Summary
Snapshot
- This is a 3-bed/1.0-bath single-family listed at $60k.
Deal economics
- At list price, monthly cash flow is $1k ($18k/yr) — positive.
- The deal already cash-flows at list — no discount required.
- Meets the 1% rule at list price ($2k rent vs $60k).
- Recommended offer: $53k (12.0% below list) — sets the bar for market timing.
Location & tenants
- Location reads 70/100 on livability (#485 in OH) — a middle-class / working-renter tenant base. Strengths: crime A+, employment A+, cost of living A+; Watch: schools D, amenities F, commute F.
- New Miami Local (suburban): math 19% / reading 39% proficiency, ranked #587 of 656 in OH (top 90%) — low school quality limits family demand, transient renter base, plan for 1-2y turnover; 60% free/reduced lunch — lower-income household profile, screen leases tightly.
- Market conditions: Rents rising (+3.0%/yr); 196 active listings in the ZIP; 2 comparable units currently listed for rent nearby; solid renter incomes; 1,163 units permitted in Butler County in 2024 (356 in 5+ unit buildings).
- This rent runs 32% of the median local income ($92k/yr) — at the standard rent-burdened threshold; future hikes will face affordability resistance.
Forward outlook
- Local home prices are declining (-3.0%/yr); year-one equity from $414 of loan paydown is wiped out by about $2k of value loss. Plan a longer hold.
- At projected returns (-3.0% appreciation + 3.0% rent growth), your $17k cash investment doubles in ~2 years — after that, you're playing with house money.
Negotiation context
- It's been on market 162 days — a 12% lower offer ($53k) is reasonable based on typical stale-listing flexibility.
- 3 sale attempts since 2y ago with the ask held roughly flat each time — persistent listings suggest the price (not the market) is what's stuck; bring a comps-based counter.
- Current owner paid $45k; 33% above their basis — modest negotiation headroom, anchor on the comps not their cost.
Risks & watch-outs
- Watch-outs: built in 1934 — expect roof / HVAC / electrical / plumbing capex.
Questions for the listing agent
- It's been on market 162 days. Have you received any prior offers? Is the seller open to a 12% concession, seller financing, or rate buy-down credit?
- Built in 1934 — when were the roof, HVAC, electrical panel, plumbing, and water heater last replaced?
- Why hasn't it sold? Are there any deal-killer items the seller is aware of (foundation, flood, title, zoning, code violations)?
- Is there a deadline driving the sale (1031 exchange, divorce, estate, relocation)? That informs how much negotiation room exists.
- Schools are D-rated, which usually means shorter tenancies and higher turnover. Who's the typical renter profile here, and what's been the actual vacancy rate?
- What's the average days-on-market for RENTAL listings here right now (not sales)? A rising rental-DOM trend means longer vacancies and softer asking-rent achievability than the comps imply.
- What's the recent tenant-quality profile in this submarket — average credit score on applications, eviction rate, late-payment / NSF rate, and stable-employment percentage? A property-management company in the area should have these aggregated.
- How much new for-sale + rental construction is in the pipeline within 1–3 miles? Heavy new supply typically softens prices + rents 12–24 months out; constrained supply supports both.
Investment metrics
- 1% rule
- 4.07% ✓
- Cap rate
- 35.98%
- Cash-on-cash
- 106.02%
- DSCR
- 5.72
- GRM
- 2.0
CMA / ARV
- ARV (median comp)
- $161,425
- List price
- $59,900
- Delta
- -62.89%
- Verdict
- UNDERPRICED
- Comps
- 20 within 1.0 mi
Show comp detail 11 sales within ~0.75 mi
| Address | Dist | Beds/Ba | Sqft | Sold | Price | $/sf | Match |
|---|---|---|---|---|---|---|---|
| 1938 Fenton St | 0.06mi | 3/1.0 | 984 (-7%) | 12mo | $175,000 | $178 | 76 |
| 3717 Hamilton Trenton Rd | 0.28mi | 3/1.0 | 1,135 (+8%) | 4mo | $216,000 | $190 | 71 |
| 2152 Clark Ave | 0.44mi | 3/1.0 | 1,052 (-0%) | 13mo | $184,000 | $175 | 68 |
| 173 Fox Ave | 0.24mi | 2/1.0 (-1) | 1,042 (-1%) | 20mo | $140,000 | $134 | 65 |
| 263 Whittaker Ave | 0.51mi | 3/1.0 | 974 (-8%) | 3mo | $130,500 | $134 | 61 |
| 2081 Caldwell St | 0.24mi | 3/1.0 | 936 (-11%) | 16mo | $185,000 | $198 | 57 |
| 2081 John St | 0.29mi | 3/1.0 | 975 (-8%) | 20mo | $120,000 | $123 | 57 |
| 3818 Trenton Rd | 0.43mi | 2/1.0 (-1) | 1,008 (-4%) | 13mo | $240,000 | $238 | 56 |
| 2147 Clark St | 0.42mi | 2/2.0 (-1) | 1,162 (+10%) | 8mo | $225,000 | $194 | 48 |
| 70 Augspurger Ave | 0.70mi | 3/1.5 | 948 (-10%) | 8mo | $145,000 | $153 | 42 |
| 116 Cain Ave | 0.40mi | 2/1.0 (-1) | 912 (-14%) | 18mo | $139,900 | $153 | 38 |
Match score weights: distance 35% · size 25% · config 20% · recency 20%. Top-matched comps best support the ARV.
Projected returns pro-forma
-3.0% appreciation · 2.95% rent growth · sell at horizon
- IRR
- —
- Equity multiple
- 6.04×
- Total profit
- $84,604
- Equity at exit
- $8,931
- IRR
- —
- Equity multiple
- 12.62×
- Total profit
- $194,923
- Equity at exit
- $5,179
Cash invested: $16,772 (down + closing). Projections, not guarantees.
Landlord ↔ Tenant lean methodology
- Overall (STATE)
- 73 Landlord-Friendly
- State Ohio
- 73 Landlord-Friendly · R+6
- County
- — inherits STATE
- City
- — inherits STATE
ZIP-level market 45011
- Rents YoY
- 3.0%
- Active inventory
- 196
- Price-to-rent
- 2.0×
Monthly cashflow live
- Estimated rent
- $2,440 medium interval (Pro) →
- Mortgage (P&I)
- −$314
- Tax from tax record
- −$107 /mo · $1,285/yr
- Insurance
- −$25
- HOA
- −$0
- Vacancy / Maint / Mgmt
- −$513
- Net cashflow
- $1,482
Break-even live
UW: 25.0% down · 7.5% · 30yr · 1.5% tax · 5.0% vac · 8.0% maint · 8.0% mgmt
Financing live
Cash to close
- Down payment
- $14,975
- Closing costs
- $1,797
- Reserves months
- —
- Total cash needed
- —
Loan-product check · same deal, 3 products live
Conventional
25% down · 7.5% · 30yr
- Down + closing
- —
- Monthly P&I
- —
- Monthly cashflow
- —
- DSCR
- —
- Eligible?
- —
Personal DTI + credit; lowest rate.
DSCR
20% down · 8.5% · 30yr
- Down + closing
- —
- Monthly P&I
- —
- Monthly cashflow
- —
- DSCR
- —
- Eligible?
- —
No personal income docs; deal must DSCR.
Hard money
10% down · 12.0% · 12mo
- Down + closing
- —
- Monthly P&I
- —
- Monthly cashflow
- —
- DSCR
- —
- Eligible?
- —
Short-term bridge; refi at stabilization.
Rent comps 2 comps
| Address | Beds | Baths | Sqft | Rent | $/sqft | DOM | Units | Dist |
|---|---|---|---|---|---|---|---|---|
| 285 Whitaker Ave Hamilton, OH | 2.0 | 1.0 | 790 | $2,995 | $3.79 | 1d | 1 | 0.46mi |
| 72 Brookhollow DR Hamilton, OH | 1.0–2.0 | 1.0 | 726 | $1,070 | $1.47 | 10d | 1 | 1.34mi |
Listing history 21 events
-
2026-06-18days on market $59,900 Active 162 DOM
-
2026-06-17days on market $59,900 Active 161 DOM
-
2026-06-16days on market $59,900 Active 160 DOM
-
2026-06-15days on market $59,900 Active 159 DOM
-
2026-06-13days on market $59,900 Active 157 DOM
-
2026-06-09days on market $59,900 Active 153 DOM
-
2026-06-08days on market $59,900 Active 152 DOM
-
2026-06-07days on market $59,900 Active 151 DOM
-
2026-06-05days on market $59,900 Active 148 DOM
-
2026-06-03days on market $59,900 Active 147 DOM
-
2026-06-02days on market $59,900 Active 146 DOM
-
2026-06-01days on market $59,900 Active 145 DOM
-
2026-05-31days on market $59,900 Active 144 DOM
-
2026-05-18historical Contingency Pending 434-char remark
Show marketing remark (434 chars)
Incredible opportunity and tons of potential in this 3-bedroom ranch. The property sits on a large lot with a storage shed and parking on the street and in the rear. Newer vinyl windows and a covered deck located minutes from Spooky Nook. 1,056 sq ft. Bank owned foreclosure. Purchase agreements must be accompanied by a minimum earnest deposit equal to the greater of 2% of the gross sales price or $1,000. Property being sold as is.
-
2026-05-12status Active 434-char remark
Show marketing remark (434 chars)
Incredible opportunity and tons of potential in this 3-bedroom ranch. The property sits on a large lot with a storage shed and parking on the street and in the rear. Newer vinyl windows and a covered deck located minutes from Spooky Nook. 1,056 sq ft. Bank owned foreclosure. Purchase agreements must be accompanied by a minimum earnest deposit equal to the greater of 2% of the gross sales price or $1,000. Property being sold as is.
-
2026-03-14historical Contingency Pending 434-char remark
Show marketing remark (434 chars)
Incredible opportunity and tons of potential in this 3-bedroom ranch. The property sits on a large lot with a storage shed and parking on the street and in the rear. Newer vinyl windows and a covered deck located minutes from Spooky Nook. 1,056 sq ft. Bank owned foreclosure. Purchase agreements must be accompanied by a minimum earnest deposit equal to the greater of 2% of the gross sales price or $1,000. Property being sold as is.
-
2026-01-07$59,900 Active 434-char remark
Show marketing remark (434 chars)
Incredible opportunity and tons of potential in this 3-bedroom ranch. The property sits on a large lot with a storage shed and parking on the street and in the rear. Newer vinyl windows and a covered deck located minutes from Spooky Nook. 1,056 sq ft. Bank owned foreclosure. Purchase agreements must be accompanied by a minimum earnest deposit equal to the greater of 2% of the gross sales price or $1,000. Property being sold as is.
-
2024-11-08soldstatus $45,000
-
2024-09-10historical 138-char remark
Show marketing remark (138 chars)
Attention investors and DIY enthusiasts! Multiple exit strategies: finish this remodel then either flip, rent or move in! Motivated Seller
-
2024-09-07historical Contingency Pending 138-char remark
Show marketing remark (138 chars)
Attention investors and DIY enthusiasts! Multiple exit strategies: finish this remodel then either flip, rent or move in! Motivated Seller
-
2024-08-28$74,900 Active 138-char remark
Show marketing remark (138 chars)
Attention investors and DIY enthusiasts! Multiple exit strategies: finish this remodel then either flip, rent or move in! Motivated Seller
ⓘ Source: listings_history table (triggers on properties + properties_extension) + one-shot
backfill from property_details.listing_events for pre-trigger history.
Tax reassessment forecast OH · Partial reset (capped growth)
- Current annual tax
- $1,285 · $107/mo
- Projected year-2 tax
- $1,285 · $107/mo
- Expected delta
- $0/yr ($0/mo · 0.0%)
ⓘ Screening estimate from a state-policy table — verify with the county assessor before closing.
Climate risk First Street
- Flood 4/10 Moderate FEMA zone X (unshaded) · 22% chance over 30 yrs
- Wildfire 1/10 Low
- Heat 4/10 Moderate 7 d/yr ≥103°F today · 19 d/yr by 30 yrs out
- Wind 2/10 Low 100% chance of damaging wind over 30 yrs
- Air quality 3/10 Moderate 2 unhealthy d/yr today · 3 by 30 yrs out
Nearby sold comps map
Loading sold comps map…
Walkable amenities ~0.75 mi
Loading nearby amenities…
Taxation est. · year 1
- Rental income
- $29,286
- − Mortgage interest
- −$3,355
- − Property taxes
- −$1,285
- − Insurance
- −$300
- − Repairs & maintenance
- −$2,343
- − Management
- −$2,343
- − Depreciation
- −$1,743
- Taxable income
- $17,917
- Est. tax owed @ 24.0%
- −$4,300
- After-tax cash flow
- $13,481/yr
For passive investors: Depreciation is non-cash, so a rental often shows a tax loss while cash-flowing — sheltering income. Rental losses are passive: they offset passive income freely, and up to $25,000/yr can offset ordinary (W-2) income if you actively participate and your MAGI is under $100k (phasing out to $0 by $150k); unused losses carry forward. On sale, claimed depreciation is recaptured at up to 25%, and gains may owe capital-gains tax (a 1031 exchange can defer both). Figures are a year-1 estimate at your 24.0% rate — not tax advice; consult a CPA.
Schools (NCES district)
- District
- New Miami Local
- NCES district ID
- 3904613
- Math proficiency
- 19% ▼ -26.00%
- Reading proficiency
- 39% ▼ -16.00%
- Median HH income
- $40,962
- Composite
- 24.43/100
- National rank
- #7679
- State rank
- #587 of 656 in OH
Livability — Williamsdale
- Score
- 70/100
- State rank
- #485
- US rank
- #8092
Category grades
Schools grade is shown separately in the Schools card above.
Census & demographics
- Census place
- Williamsdale, OH
- County
- Butler County · 381,674 people
- Metro
- Cincinnati, OH-KY-IN
- Population (ZIP)
- 75,864
- Household income
- $91,873
- Rent vs Own
- Severe rent burden
- 1795.0
Population outlook (Butler County) Hauer SSP2
- Today (2025)
- 387,706 people
- By 2030
- 392,028 · +1.1%
- By 2040
- 395,307 · +2.0%
- By 2050
- 391,116 · +0.9%
- By 2075
- 378,642 · -2.3%
- By 2100
- 343,248 · -11.5%
Race, ethnicity, and origin ACS 2023
- Neighborhood character
- Predominantly White (68%)
- Race & ethnicity
- White 68% Hispanic / Latino 12% Black 11% Two or more races 9% Asian 4%
- Hispanic origin (detail)
- Mexican 7%
- Common ancestry
- Romanian 2% Italian 2% Slovak 2%
- Foreign-born
- 11% · Canada, Vietnam, China
- Languages at home
- 86% English-only · Spanish 8% Other Indo-European 2% Vietnamese 1%
Political lean MEDSL · Butler
- 2024 margin
- Strong R (+26.3) · D 36.4% · R 62.7%
- 2008→2024 swing
- -3.6pp toward R · 2008: -22.6pp · 2024: -26.3pp
- All cycles
- 2024: R+26.3 2020: R+24.0 2016: R+28.3 2012: R+26.2 2008: R+22.6
Not yet ingested
- Civics
- —
Market trends
- HPI YoY
- ▼ -188.67%
- Current HPI
- 259.7868
- Rent YoY
- ▲ 2.95%
- Metro
- Cincinnati, OH-KY-IN
- State GDP YoY
- ▲ 1.98%
- F500 in state
- 48
Industry mix (Fortune 500 HQ in OH)
| Industry | F500 HQs | Revenue |
|---|---|---|
| Insurance | 3 | $145B |
|
||
| Industrial Machinery | 3 | $49B |
|
||
| Financial Services | 3 | $24B |
|
||
| Consumer Goods | 2 | $93B |
|
||
| Aerospace / Defense | 2 | $47B |
|
||
| Utilities | 2 | $33B |
|
||
Price history
-20.0% since first listed8 events — show timeline
- 2026-05-18 Contingent — Cincy MLS
- 2026-05-12 Relisted — Cincy MLS
- 2026-03-14 Contingent — Cincy MLS
- 2026-01-07 Listed $59,900 Cincy MLS
- 2024-11-08 Sold (Public Records) $45,000 Public Records
- 2024-09-10 Listing Removed — Cincy MLS
- 2024-09-07 Contingent — Cincy MLS
- 2024-08-28 Listed $74,900 Cincy MLS
Property tax history
+3.6%/yrLatest (2025): $1,285 · -1.3% YoY. Source: county tax records.
Cash-flow waterfall
monthlySold comps — $/sqft
last 12 mo · ≤1 miLoading sold comps…