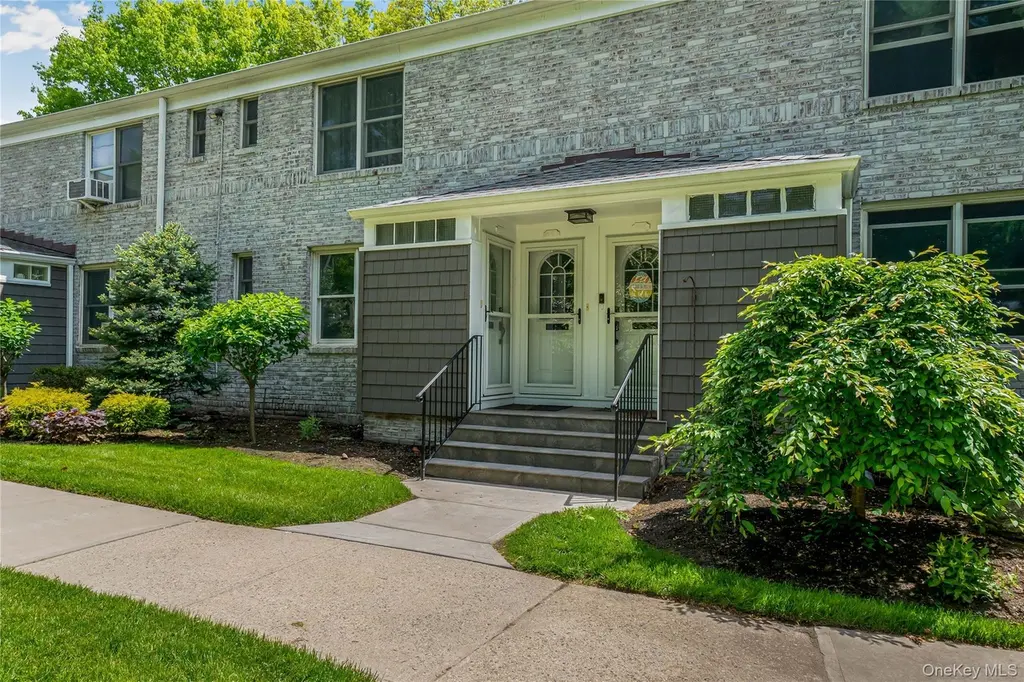
16 Glen Keith Rd Unit L · Glen Cove, NY
Flood risk 4/10 · Minor
- FEMA flood zone
- X (unshaded)
- Chance of flooding over 30 yrs
- 0.22%
- Est. flood insurance / yr
- $473 – $860
Fire risk 3/10 · Minor
- Est. fire insurance / yr
- $691 – $1,283
Heat risk 6/10 · Moderate
- Hot days now (above 97°F)
- 7 days/yr
- Hot days in 30 yrs
- 16 days/yr
Wind risk 6/10 · Moderate
- Chance of severe wind over 30 yrs
- 60.0%
Air-quality risk 5/10 · Moderate
- Unhealthy air days now
- 6 days/yr
- Unhealthy air days in 30 yrs
- 8 days/yr
Risk factors via First Street. Map © Google.
Why this score? — see what drove the D grade
The composite is a weighted blend of 9 inputs, each scored 0–100. Each bar is that input's sub-score; the figure is the points it added to the 100-point composite (weight × sub-score).
- Cash flow +11.8/30.0
- ARV discount +7.5/15.0
- Schools +4.7/10.0
- Rent growth +4.1/5.0
- Condition / age +4.0/5.0
- DSCR +3.5/10.0
- 1% rule +3.4/10.0
- Livability +3.2/5.0
- Appreciation +0.0/10.0
$365,000
🖨 Deal sheet 📄 Offer letter ✓ Due diligence
Listing remarks
Beautifully renovated 1-bedroom lower-level unit in the desirable Trousdell Village community of Glen Cove. This turnkey home offers a bright, open-concept layout with refinished hardwood floors, freshly painted walls, recessed lighting, and brand-new doors and hardware throughout. The modern kitchen features sleek cabinetry, quartz-style countertops, a stylish mosaic backsplash, stainless steel appliances, and a gas range. The spa-inspired bathroom is finished with marble-look tile, a custom niche, a contemporary vanity, and brushed-nickel fixtures. The bedroom is generously sized with large windows, ceiling fans, and serene, tree-lined views. Set within a meticulously maintained, pet-frie
Key facts
- Fitness center
- Modern kitchen
- Open-concept layout
Tags
Property features AI
Finance
- Other: Located in Nassau County
- HOA & community: Part of Trousdell Village association; Association provides parking; Association fee includes utilities
Exterior
- Parking: On-street parking; One parking space (total listed as 1)
- Utilities: Public sewer; Cable available; Electricity available; Phone service available
- Home design: Stock cooperative; 2 stories; Entry on first level
- Construction: Brick construction; Shingle siding
- Exterior features: Brick and shingle siding exterior; Not waterfront
Interior
- Kitchen: Gas oven
- Bathrooms: 1 full bathroom
- Heating & cooling: Hot water heating; Natural gas heating; Wall/window air conditioning units
- Interior features: First-floor bedroom; Natural woodwork
Neighborhood map
What this means for you Summary
Snapshot
- This is a 1-bed/1.0-bath condo listed at $365k. Condition is rated good.
Deal economics
- At list price, monthly cash flow is $-97 ($-1k/yr) — negative.
- To cash-flow at today's rent, offer at most $351k (3.8% below list).
- To meet the 1% rule (rent ≥ 1% of price), the offer needs to be $307k (15.9% below list).
- Recommended offer: $307k (15.9% below list) — sets the bar for 1% rule.
- Cap rate 6.0% vs local median 3.7% in Glen Cove — top-decile yield for the area; either an underpriced asset or a hidden risk that comps aren't pricing in. Stress-test before assuming the spread holds.
Location & tenants
- Location reads 65/100 on livability (#685 in NY) — a middle-class / working-renter tenant base. Strengths: crime A+, employment A+; Watch: housing C-, amenities F, commute F.
- Glen Cove City School District (suburban): math 50% / reading 55% proficiency, ranked #312 of 590 in NY (top 53%) — acceptable for families but not a draw, mixed tenant base, ~2y average lease.
- Zoned schools: Connolly School (math 37% / reading 42%, grade F, #1,444 of 2,108 statewide, top 71%, 305 students, 67% FRL); Robert M Finley Middle School (math 43% / reading 47%, grade D, #342 of 729 statewide, top 48%, 710 students, 70% FRL); Glen Cove High School (math 85% / reading 87%, grade A, #347 of 1,100 statewide, top 32%, 1,050 students, 55% FRL) — zoned schools average 64% FRL vs 45% district-wide (19 pts higher); higher-poverty schools than district average — tighter screening recommended.
- Market conditions: Rents rising fast (+6.4%/yr); 144 active listings in the ZIP; 17 comparable units currently listed for rent nearby; rentals at typical pace (median 21d on market — plan ~3-4 weeks tenant-placement turnaround); solid renter incomes; 824 units permitted in Nassau County in 2024 (153 in 5+ unit buildings).
- This rent runs 40% of the median local income ($93k/yr) — at the standard rent-burdened threshold; future hikes will face affordability resistance.
Forward outlook
- Local home prices are declining (-3.0%/yr); year-one equity from $3k of loan paydown is wiped out by about $11k of value loss. Plan a longer hold.
- Nassau County population projected at +7% by 2050 — modest demand growth; plan on rents tracking national, not racing it.
Negotiation context
- It's been on market 18 days — a 2% lower offer ($360k) is reasonable based on typical stale-listing flexibility.
Risks & watch-outs
- Watch-outs: built in 1950 — expect roof / HVAC / electrical / plumbing capex.
- Climate carrying-cost: major wind risk, 60% chance of damaging wind over 30y; extreme-heat days projected 7→16/yr by 2055 (HVAC capex compounding) — expect insurance premiums to compound above CPI over the hold.
Questions for the listing agent
- What do current leases actually rent for vs. the listed asking? Can we see a recent rent roll and the last 12 months of T-12 income?
- Built in 1950 — when were the roof, HVAC, electrical panel, plumbing, and water heater last replaced?
- Any open or pending special assessments — roof, HVAC, plumbing, elevator, façade? What's the per-unit balance and payoff schedule, and is the seller paying it off at close or rolling it to the buyer?
- Is there a deadline driving the sale (1031 exchange, divorce, estate, relocation)? That informs how much negotiation room exists.
- The area grade is low — what's the realistic commute time and amenity access for the typical tenant pool here? Any planned neighborhood developments (good or bad) we should know about?
- What's the average days-on-market for RENTAL listings here right now (not sales)? A rising rental-DOM trend means longer vacancies and softer asking-rent achievability than the comps imply.
- What's the recent tenant-quality profile in this submarket — average credit score on applications, eviction rate, late-payment / NSF rate, and stable-employment percentage? A property-management company in the area should have these aggregated.
- How much new apartment / multifamily construction is in the pipeline within 1–3 miles? Heavy new supply (>2% of stock underway) typically softens rents 12–24 months out; light construction supports rent growth.
Investment metrics
- 1% rule
- 0.84% ✗
- Cap rate
- 5.97%
- Cash-on-cash
- -1.14%
- DSCR
- 0.95
- GRM
- 9.9
CMA / ARV
No comps found within radius.
Projected returns pro-forma
-3.0% appreciation · 6.43% rent growth · sell at horizon
- IRR
- -14.4%
- Equity multiple
- 0.47×
- Total profit
- $-54,325
- Equity at exit
- $54,423
- IRR
- -0.8%
- Equity multiple
- 0.93×
- Total profit
- $-6,819
- Equity at exit
- $31,559
Cash invested: $102,200 (down + closing). Projections, not guarantees.
Landlord ↔ Tenant lean methodology
- Overall (STATE)
- 15 Strongly Tenant-Friendly
- State New York
- 15 Strongly Tenant-Friendly · D+10
- County
- — inherits STATE
- City
- — inherits STATE
ZIP-level market 11542
- Rents YoY
- 6.4%
- Active inventory
- 144
- Price-to-rent
- 9.9×
Monthly cashflow live
- Estimated rent
- $3,070 high interval (Pro) →
- Mortgage (P&I)
- −$1,914
- Tax est. 1.5%
- −$456 /mo · $5,475/yr
- Insurance
- −$152
- HOA
- −$0
- Vacancy / Maint / Mgmt
- −$645
- Net cashflow
- $-97
Break-even live
UW: 25.0% down · 7.5% · 30yr · 1.5% tax · 5.0% vac · 8.0% maint · 8.0% mgmt
Financing live
Cash to close
- Down payment
- $91,250
- Closing costs
- $10,950
- Reserves months
- —
- Total cash needed
- —
Loan-product check · same deal, 3 products live
Conventional
25% down · 7.5% · 30yr
- Down + closing
- —
- Monthly P&I
- —
- Monthly cashflow
- —
- DSCR
- —
- Eligible?
- —
Personal DTI + credit; lowest rate.
DSCR
20% down · 8.5% · 30yr
- Down + closing
- —
- Monthly P&I
- —
- Monthly cashflow
- —
- DSCR
- —
- Eligible?
- —
No personal income docs; deal must DSCR.
Hard money
10% down · 12.0% · 12mo
- Down + closing
- —
- Monthly P&I
- —
- Monthly cashflow
- —
- DSCR
- —
- Eligible?
- —
Short-term bridge; refi at stabilization.
Rent comps 17 comps
| Address | Beds | Baths | Sqft | Rent | $/sqft | DOM | Units | Dist |
|---|---|---|---|---|---|---|---|---|
| 400 Carney St Unit 403 Glen Cove, NY | 1.0 | 1.0 | 900 | $2,700 | $3.00 | 19d | 1 | 0.26mi |
| 63 Wolfle St Unit 2 Glen Cove, NY | 1.0 | 1.0 | 600 | $1,800 | $3.00 | 4d | 1 | 0.58mi |
| 15 Cherry Ln Unit A Glen Head, NY | 1.0 | 1.0 | 750 | $4,000 | $5.33 | 24d | 1 | 0.60mi |
| 55 Sea Cliff Ave Sea Cliff, NY | 1.0 | 1.0 | 700 | $3,200 | $4.57 | 24d | 1 | 0.64mi |
| 1100 Avalon Sq Glen Cove, NY | 2.0 | 1.0–2.0 | 952 | $3,492 | $3.67 | 1d | 1 | 0.75mi |
| 22B Town Path Unit 2 Glen Cove, NY | 2.0 | 1.0 | 900 | $3,000 | $3.33 | 22d | 1 | 0.80mi |
| 100 Village Sq Glen Cove, NY | 2.0 | 1.0–2.0 | 924 | $4,130 | $4.47 | 1d | 4 | 0.91mi |
| 12 Smith St Glen Cove, NY | 2.0 | 1.0 | 650 | $2,300 | $3.54 | 20d | 1 | 0.98mi |
| 350 Herb Hill Rd Glen Cove, NY | 2.0 | 1.0–2.0 | 918 | $4,456 | $4.85 | 1d | 5 | 1.00mi |
| 38 East Ave Unit second floor Glen Cove, NY | 2.0 | 1.0 | 900 | $2,500 | $2.78 | 24d | 1 | 1.00mi |
| 110 School St Unit 1 Glen Cove, NY | 2.0 | 1.0 | 1000 | $3,499 | $3.50 | 43d | 1 | 1.13mi |
| 27 Southridge Dr Unit 2 Glen Cove, NY | 2.0 | 1.0 | 800 | $3,000 | $3.75 | 43d | 1 | 1.17mi |
| 27 Southridge Dr Unit 1 Glen Cove, NY | 2.0 | 1.0 | 800 | $3,300 | $4.12 | 19d | 1 | 1.17mi |
| 86 McLoughlin St Unit D Glen Cove, NY | 2.0 | 1.0 | 722 | $2,700 | $3.74 | 43d | 1 | 1.20mi |
| 378 Sea Cliff Ave Unit 3 Sea Cliff, NY | 1.0 | 1.0 | 800 | $2,900 | $3.62 | 19d | 1 | 1.28mi |
| 13 Prospect St Glen Head, NY | 2.0 | 1.0 | 909 | $3,950 | $4.35 | 43d | 1 | 1.39mi |
| 1 Alvin St Unit 1 Glen Cove, NY | 2.0 | 1.0 | 950 | $3,350 | $3.53 | 3d | 1 | 1.40mi |
HOA detail condo
- Monthly dues
- $0 · $0/yr
- Likely covers
- gas
- Assessments
- None detected in remarks — confirm with the listing agent.
Listing history 14 events
-
2026-06-18days on market $365,000 Active 18 DOM
-
2026-06-17days on market $365,000 Active 17 DOM
-
2026-06-16days on market $365,000 Active 16 DOM
-
2026-06-15days on market $365,000 Active 15 DOM
-
2026-06-13days on market $365,000 Active 13 DOM
-
2026-06-13days on market $365,000 Active 12 DOM
-
2026-06-09days on market $365,000 Active 9 DOM
-
2026-06-08days on market $365,000 Active 8 DOM
-
2026-06-07days on market $365,000 Active 7 DOM
-
2026-06-04days on market $365,000 Active 4 DOM
-
2026-06-03days on market $365,000 Active 3 DOM
-
2026-06-02days on market $365,000 Active 2 DOM
-
2026-06-01remarks 699-char remark
-
2026-06-01$365,000 Active 1 DOM
ⓘ Source: listings_history table (triggers on properties + properties_extension) + one-shot
backfill from property_details.listing_events for pre-trigger history.
Climate risk First Street
- Flood 4/10 Moderate FEMA zone X (unshaded) · 22% chance over 30 yrs
- Wildfire 3/10 Moderate
- Heat 6/10 Major 7 d/yr ≥97°F today · 16 d/yr by 30 yrs out
- Wind 6/10 Major 60% chance of damaging wind over 30 yrs
- Air quality 5/10 Major 6 unhealthy d/yr today · 8 by 30 yrs out
Nearby sold comps map
Loading sold comps map…
Walkable amenities ~0.75 mi
Loading nearby amenities…
Taxation est. · year 1
- Rental income
- $36,840
- − Mortgage interest
- −$20,446
- − Property taxes
- −$5,475
- − Insurance
- −$1,825
- − Repairs & maintenance
- −$2,947
- − Management
- −$2,947
- − Depreciation
- −$10,618
- Taxable loss
- −$7,418
- Est. tax savings @ 24.0%
- +$1,780
- After-tax cash flow
- $615/yr
For passive investors: Depreciation is non-cash, so a rental often shows a tax loss while cash-flowing — sheltering income. Rental losses are passive: they offset passive income freely, and up to $25,000/yr can offset ordinary (W-2) income if you actively participate and your MAGI is under $100k (phasing out to $0 by $150k); unused losses carry forward. On sale, claimed depreciation is recaptured at up to 25%, and gains may owe capital-gains tax (a 1031 exchange can defer both). Figures are a year-1 estimate at your 24.0% rate — not tax advice; consult a CPA.
Condition & rehab AI · 12 photos
This beautifully renovated 1-bedroom lower-level unit in Trousdell Village offers a bright, open-concept layout with refinished hardwood floors and modern finishes. The home is move-in ready with minimal maintenance required.
Value-add opportunities
- Both Painting exterior brick — Enhances curb appeal and value
- Both Landscaping improvements — Enhances curb appeal and value
- Both Replace ceiling fans with modern fixtures — Modernizes space and adds value
Renovation cost estimate screening
Value-add ROI direction
- Both Painting exterior brick — Enhances curb appeal and value ↑
- Both Landscaping improvements — Enhances curb appeal and value ↑
- Both Replace ceiling fans with modern fixtures — Modernizes space and adds value ↑
ⓘ Cost ranges are severity-bucket heuristics (US national rule-of-thumb). Get contractor quotes + a written scope before underwriting a rehab budget.
Schools (NCES district)
- District
- Glen Cove City School District
- NCES district ID
- 3612180
- Math proficiency
- 50% ▼ -5.00%
- Reading proficiency
- 55% ▲ 6.00%
- Median HH income
- $70,021
- Composite
- 46.76/100
- National rank
- #2391
- State rank
- #312 of 590 in NY
Livability — Glen Cove
- Score
- 65/100
- State rank
- #685
- US rank
- #12441
Category grades
Schools grade is shown separately in the Schools card above.
Census & demographics
- Census place
- Glen Cove, NY
- County
- Nassau County · 653,051 people
- City population
- 28,965
- Metro
- New York-Newark-Jersey City, NY-NJ-PA
- Population (ZIP)
- 28,965
- Household income
- $93,242
- Rent vs Own
- Severe rent burden
- 1667.0
Population outlook (Nassau County) Hauer SSP2
- Today (2025)
- 1,409,302 people
- By 2030
- 1,431,482 · +1.6%
- By 2040
- 1,471,607 · +4.4%
- By 2050
- 1,502,845 · +6.6%
- By 2075
- 1,575,403 · +11.8%
- By 2100
- 1,554,356 · +10.3%
Race, ethnicity, and origin ACS 2023
- Neighborhood character
- Diverse neighborhood (Simpson 0.57)
- Race & ethnicity
- White 56% Hispanic / Latino 32% Two or more races 14% Asian 5% Black 4%
- Hispanic origin (detail)
- Mexican 2% Puerto Rican 4% Dominican 3%
- Common ancestry
- Romanian 5% Scotch-Irish 2% Italian 1%
- Foreign-born
- 28% · Canada, China, Jamaica
- Languages at home
- 60% English-only · Spanish 27% Other Indo-European 9% Chinese 1%
Political lean MEDSL · Nassau
- 2024 margin
- Toss-up / Even · D 47.9% · R 52.1%
- 2008→2024 swing
- -12.6pp toward R · 2008: 8.4pp · 2024: -4.2pp
- All cycles
- 2024: R+4.2 2020: D+9.5 2016: D+5.3 2012: D+6.7 2008: D+8.4
Not yet ingested
- Civics
- —
Market trends
- HPI YoY
- ▼ -377.99%
- Current HPI
- 275.1903
- Rent YoY
- ▲ 6.43%
- Metro
- New York-Newark-Jersey City, NY-NJ-PA
- State GDP YoY
- ▲ 2.60%
- F500 in state
- 92
Industry mix (Fortune 500 HQ in NY)
| Industry | F500 HQs | Revenue |
|---|---|---|
| Financial Services | 10 | $950B |
|
||
| Consumer Goods | 9 | $162B |
|
||
| Insurance | 4 | $225B |
|
||
| Telecommunications | 2 | $144B |
|
||
| Pharmaceuticals | 2 | $112B |
|
||
| Media / Entertainment | 2 | $69B |
|
||
Price history
1 event — show timeline
- 2026-05-31 Listed $365,000 OneKey® MLS as Distributed by MLS Grid
Cash-flow waterfall
monthlySold comps — $/sqft
last 12 mo · ≤1 miLoading sold comps…