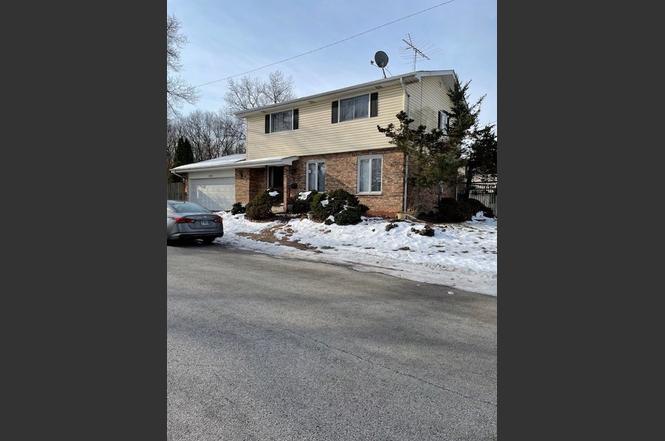
100 Michigan City Rd · Calumet City, IL
Flood risk 1/10 · Minimal
- FEMA flood zone
- X (unshaded)
- Chance of flooding over 30 yrs
- 0.0%
- Est. flood insurance / yr
- $473 – $860
Fire risk 1/10 · Minimal
- Est. fire insurance / yr
- $804 – $1,492
Heat risk 3/10 · Minor
- Hot days now (above 102°F)
- 7 days/yr
- Hot days in 30 yrs
- 15 days/yr
Wind risk 2/10 · Minimal
- Chance of severe wind over 30 yrs
- —
Air-quality risk 4/10 · Minor
- Unhealthy air days now
- 5 days/yr
- Unhealthy air days in 30 yrs
- 6 days/yr
Risk factors via First Street. Map © Google.
Why this score? — see what drove the B+ grade
The composite is a weighted blend of 9 inputs, each scored 0–100. Each bar is that input's sub-score; the figure is the points it added to the 100-point composite (weight × sub-score).
- Cash flow +30.0/30.0
- ARV discount +15.0/15.0
- 1% rule +10.0/10.0
- DSCR +10.0/10.0
- Rent growth +4.0/5.0
- Livability +3.6/5.0
- Condition / age +2.5/5.0
- Schools +1.0/10.0
- Appreciation +0.0/10.0
$143,000
🖨 Deal sheet (PDF) 📄 Offer letter ✓ Due diligence
Listing remarks
Welcome to this inviting home in a convenient Calumet City location. Enjoy bright living spaces, comfortable bedrooms, and a spacious yard perfect for outdoor activities. Close to parks, shopping, dining, and major highways, this property offers great potential for both homeowners and investors.
Key facts
- 7,000 sq ft lot
- 2 garage spots
- Built 1979
Property features AI
Finance
- Other: Fee simple ownership; Possession immediate
- HOA & community: No master association fee required
Exterior
- Parking: Attached garage (2 spaces); Two total parking spaces
- Utilities: Public water; Public sewer
- Home design: Detached single-family home; Two-story
- Construction: Brick construction; Estimated age 41–50 years
- Exterior features: Lot dimensions approximately 50 x 140; Lot smaller than 0.25 acre
Interior
- Kitchen: Kitchen (main level, 15 x 15)
- Bedrooms: Master bedroom (second level, with full bath); Bedroom 2 (second level, 12 x 12); Bedroom 3 (second level, 10 x 10); Bedroom 4 (second level, 15 x 10)
- Bathrooms: Two full bathrooms; One half bathroom
- Heating & cooling: Natural gas heating; Central air conditioning
- Interior features: Seven total rooms; Partially finished full basement
- Laundry & utility: Laundry room
Neighborhood map
What this means for you Summary
Snapshot
- This is a 3-bed/2.0-bath single-family listed at $143k.
Deal economics
- At list price, monthly cash flow is $871 ($10k/yr) — positive.
- The deal already cash-flows at list — no discount required.
- Meets the 1% rule at list price ($2k rent vs $143k).
- Recommended offer: $130k (9.0% below list) — sets the bar for market timing.
- Cap rate 13.6% vs local median 8.3% in Calumet City — top-decile yield for the area; either an underpriced asset or a hidden risk that comps aren't pricing in. Stress-test before assuming the spread holds.
Location & tenants
- Location reads 71/100 on livability (#330 in IL) — a middle-class / working-renter tenant base. Strengths: commute A+, cost of living A+, housing A+; Watch: employment C-, crime D-, amenities F.
- Thornton Fractional Twp Hsd 215 (suburban): math 9% / reading 13% proficiency, ranked #563 of 620 in IL (top 91%) — low school quality limits family demand, transient renter base, plan for 1-2y turnover.
- Zoned schools: Lincoln Elem School (math 7% / reading 14%, grade F, #1,473 of 2,056 statewide, top 72%, 772 students, 0% FRL); Thornton Fractnl No High School (math 6% / reading 10%, grade F, #587 of 693 statewide, top 85%, 1,383 students, 0% FRL).
- Market conditions: Rents rising fast (+6.2%/yr); 196 active listings in the ZIP; 3 comparable units currently listed for rent nearby; rentals leasing fast (median 1d on market — plan ~1-2 weeks tenant-placement turnaround); 6,272 units permitted in Cook County in 2024 (4,658 in 5+ unit buildings).
- At $2,353/mo this rent would consume 51% of the median local household income ($55k/yr) (locally 2415% of renters already pay >50% of income on rent) — very limited rent-growth headroom before tenants either downsize or default.
Forward outlook
- Local home prices are declining (-3.0%/yr); year-one equity from $989 of loan paydown is wiped out by about $4k of value loss. Plan a longer hold.
- At projected returns (-3.0% appreciation + 6.2% rent growth), your $40k cash investment doubles in ~5 years — after that, you're playing with house money.
Negotiation context
- It's been on market 108 days — a 9% lower offer ($130k) is reasonable based on typical stale-listing flexibility.
- 7 sale attempts since 9y ago; this cycle's ask is 186% above the opening price — seller raised mid-cycle; expect resistance to lowballs.
Questions for the listing agent
- It's been on market 108 days. Have you received any prior offers? Is the seller open to a 9% concession, seller financing, or rate buy-down credit?
- Built in 1979 — when were the roof, HVAC, electrical panel, plumbing, and water heater last replaced?
- Why hasn't it sold? Are there any deal-killer items the seller is aware of (foundation, flood, title, zoning, code violations)?
- Is there a deadline driving the sale (1031 exchange, divorce, estate, relocation)? That informs how much negotiation room exists.
- Schools are F-rated, which usually means shorter tenancies and higher turnover. Who's the typical renter profile here, and what's been the actual vacancy rate?
- Crime grade is D in this area — have there been break-ins, vandalism, or insurance claims at this property in the last 3 years? What carrier currently insures it and at what premium?
- What's the average days-on-market for RENTAL listings here right now (not sales)? A rising rental-DOM trend means longer vacancies and softer asking-rent achievability than the comps imply.
- What's the recent tenant-quality profile in this submarket — average credit score on applications, eviction rate, late-payment / NSF rate, and stable-employment percentage? A property-management company in the area should have these aggregated.
- How much new for-sale + rental construction is in the pipeline within 1–3 miles? Heavy new supply typically softens prices + rents 12–24 months out; constrained supply supports both.
Investment metrics
- 1% rule
- 1.65% ✓
- Cap rate
- 13.60%
- Cash-on-cash
- 26.09%
- DSCR
- 2.16
- GRM
- 5.1
CMA / ARV
- ARV (on-the-fly)
- $177,219
- Comps found
- 12
Show comp detail 12 sales within ~0.75 mi
| Address | Dist | Beds/Ba | Sqft | Sold | Price | $/sf | Match |
|---|---|---|---|---|---|---|---|
| 6360 Hohman Ave | 0.39mi | 3/1.5 | 1,833 (+0%) | 1mo | $160,000 | $87 | 78 |
| 42 Detroit St | 0.25mi | 3/1.5 | 1,724 (-6%) | 2mo | $103,000 | $60 | 75 |
| 1051 Burnham Ave | 0.62mi | 3/2.0 | 1,824 (-0%) | 0mo | $230,000 | $126 | 71 |
| 122 Elizabeth St | 0.28mi | 3/1.0 | 1,686 (-8%) | 5mo | $164,000 | $97 | 66 |
| 63 Kenwood St | 0.30mi | 4/2.0 (+1) | 1,964 (+8%) | 3mo | $234,000 | $119 | 66 |
| 4 Warren St | 0.51mi | 4/1.0 (+1) | 1,775 (-3%) | 7mo | $145,000 | $82 | 57 |
| 1304 Price Ave | 0.59mi | 2/2.0 (-1) | 1,800 (-2%) | 10mo | $85,000 | $47 | 56 |
| 228 Elizabeth St | 0.34mi | 4/2.0 (+1) | 2,029 (+11%) | 10mo | $270,000 | $133 | 53 |
| 6344 Jackson Ave | 0.74mi | 2/1.5 (-1) | 1,749 (-4%) | 4mo | $90,500 | $52 | 48 |
| 6220 Garfield Ave | 0.52mi | 4/2.5 (+1) | 2,074 (+14%) | 1mo | $189,000 | $91 | 45 |
| 6332 Jackson Ave | 0.73mi | 4/2.0 (+1) | 2,008 (+10%) | 3mo | $199,900 | $100 | 42 |
| 207 156th Pl | 0.68mi | 4/2.5 (+1) | 1,625 (-11%) | 3mo | $200,000 | $123 | 40 |
Match score weights: distance 35% · size 25% · config 20% · recency 20%. Top-matched comps best support the ARV.
Projected returns pro-forma
-3.0% appreciation · 6.17% rent growth · sell at horizon
- IRR
- 23.4%
- Equity multiple
- 2.00×
- Total profit
- $40,060
- Equity at exit
- $21,322
- IRR
- 33.3%
- Equity multiple
- 4.51×
- Total profit
- $140,347
- Equity at exit
- $12,364
Cash invested: $40,040 (down + closing). Projections, not guarantees.
Landlord ↔ Tenant lean methodology
- Overall (STATE)
- 43 Moderately Tenant-Leaning
- State Illinois
- 43 Moderately Tenant-Leaning · D+7
- County
- — inherits STATE
- City
- — inherits STATE
ZIP-level market 60409
- Home prices YoY
- -27.6%
- Rents YoY
- 6.2%
- Active inventory
- 196
- Price-to-rent
- 5.1×
Monthly cashflow live
- Estimated rent
- $2,353 medium interval (Pro) →
- Mortgage (P&I)
- −$750
- Tax est. 1.5%
- −$179 /mo · $2,145/yr
- Insurance
- −$60
- HOA
- −$0
- Vacancy / Maint / Mgmt
- −$494
- Net cashflow
- $871
Break-even live
Sensitivity live
| Price | -10% $969 | -5% $920 | +0% $871 | +5% $821 | +10% $772 |
|---|---|---|---|---|---|
| Rent | -10% $685 | -5% $778 | +0% $871 | +5% $964 | +10% $1,057 |
| Rate | -1.0pp $943 | -0.5pp $907 | base $871 | +0.5pp $834 | +1.0pp $796 |
UW: 25.0% down · 7.5% · 30yr · 1.5% tax · 5.0% vac · 8.0% maint · 8.0% mgmt
Financing live
Cash to close
- Down payment
- $35,750
- Closing costs
- $4,290
- Reserves months
- —
- Total cash needed
- —
Loan-product check · same deal, 3 products live
Conventional
25% down · 7.5% · 30yr
- Down + closing
- —
- Monthly P&I
- —
- Monthly cashflow
- —
- DSCR
- —
- Eligible?
- —
Personal DTI + credit; lowest rate.
DSCR
20% down · 8.5% · 30yr
- Down + closing
- —
- Monthly P&I
- —
- Monthly cashflow
- —
- DSCR
- —
- Eligible?
- —
No personal income docs; deal must DSCR.
Hard money
10% down · 12.0% · 12mo
- Down + closing
- —
- Monthly P&I
- —
- Monthly cashflow
- —
- DSCR
- —
- Eligible?
- —
Short-term bridge; refi at stabilization.
Rent comps 3 comps
| Address | Beds | Baths | Sqft | Rent | $/sqft | DOM | Units | Dist |
|---|---|---|---|---|---|---|---|---|
| 34 Elizabeth St Calumet City, IL | 3.0 | 1.0 | 1246 | $2,400 | $1.93 | 0d | 1 | 0.30mi |
| 252 Lawndale St Hammond, IN | 4.0 | 3.0 | 2016 | $2,600 | $1.29 | 3d | 1 | 1.05mi |
| 617 Kane St Hammond, IN | 4.0 | 2.0 | 2146 | $2,300 | $1.07 | 0d | 1 | 1.27mi |
Listing history 46 events
-
2026-06-21statusdays on market $143,000 Contingent - Continue to Show 108 DOM
-
2026-06-18days on market $143,000 Active 105 DOM
-
2026-06-17days on market $143,000 Active 104 DOM
-
2026-06-16days on market $143,000 Active 103 DOM
-
2026-06-15days on market $143,000 Active 102 DOM
-
2026-06-13days on market $143,000 Active 100 DOM
-
2026-06-09days on market $143,000 Active 96 DOM
-
2026-06-08days on market $143,000 Active 95 DOM
-
2026-06-07days on market $143,000 Active 94 DOM
-
2026-06-04days on market $143,000 Active 91 DOM
-
2026-06-03days on market $143,000 Active 90 DOM
-
2026-06-02days on market $143,000 Active 89 DOM
-
2026-06-01days on market $143,000 Active 88 DOM
-
2026-05-31days on market $143,000 Active 87 DOM
-
2026-04-28price $143,000
-
2026-04-02price $153,000
-
2026-03-05status Active
-
2026-03-05price $165,000
-
2025-12-17status Pending
-
2025-12-05status Pending
-
2025-12-05$50,000 Active
-
2025-11-19historical
-
2025-07-31price
-
2025-07-14price
-
2025-06-27Active
-
2023-08-14status Pending
-
2023-06-17historical Contingent - Continue to Show
-
2023-06-14historical
-
2023-06-12price
-
2023-06-10price
-
2023-06-09Active
-
2023-06-09historical
-
2023-04-03price
-
2021-12-15historical
-
2021-11-05price
-
2021-10-27Active
-
2018-10-02soldstatus $145,000
-
2018-09-28soldstatus $145,000 Closed Sale
-
2018-08-30historical Contingent
-
2018-08-07price $149,900
-
2018-04-02$159,900 New
-
2018-01-15historical
-
2017-10-25price
-
2017-07-21New
-
1991-10-02soldstatus $115,000
-
1979-09-12soldstatus $90,000
ⓘ Source: listings_history table (triggers on properties + properties_extension) + one-shot
backfill from property_details.listing_events for pre-trigger history.
Climate risk First Street
- Flood 1/10 Low FEMA zone X (unshaded) · 0% chance over 30 yrs
- Wildfire 1/10 Low
- Heat 3/10 Moderate 7 d/yr ≥102°F today · 15 d/yr by 30 yrs out
- Wind 2/10 Low
- Air quality 4/10 Moderate 5 unhealthy d/yr today · 6 by 30 yrs out
Nearby sold comps map
Loading sold comps map…
Walkable amenities ~0.75 mi
Loading nearby amenities…
Taxation est. · year 1
- Rental income
- $28,237
- − Mortgage interest
- −$8,010
- − Property taxes
- −$2,145
- − Insurance
- −$715
- − Repairs & maintenance
- −$2,259
- − Management
- −$2,259
- − Depreciation
- −$4,160
- Taxable income
- $8,689
- Est. tax owed @ 24.0%
- −$2,085
- After-tax cash flow
- $8,363/yr
For passive investors: Depreciation is non-cash, so a rental often shows a tax loss while cash-flowing — sheltering income. Rental losses are passive: they offset passive income freely, and up to $25,000/yr can offset ordinary (W-2) income if you actively participate and your MAGI is under $100k (phasing out to $0 by $150k); unused losses carry forward. On sale, claimed depreciation is recaptured at up to 25%, and gains may owe capital-gains tax (a 1031 exchange can defer both). Figures are a year-1 estimate at your 24.0% rate — not tax advice; consult a CPA.
Schools (NCES district)
- District
- Thornton Fractional Twp Hsd 215
- NCES district ID
- 1738940
- Math proficiency
- 9% ▼ -3.00%
- Reading proficiency
- 13% ▼ -3.00%
- Median HH income
- $48,207
- Composite
- 10.27/100
- National rank
- #9793
- State rank
- #563 of 620 in IL
Livability — Calumet City
- Score
- 71/100
- State rank
- #330
- US rank
- #6552
Category grades
Schools grade is shown separately in the Schools card above.
Census & demographics
- Census place
- Calumet City, IL
- County
- Cook County · 4,486,803 people
- City population
- 35,100
- Metro
- Chicago-Naperville-Elgin, IL-IN-WI
- Population (ZIP)
- 35,100
- Household income
- $55,369
- Rent vs Own
- Severe rent burden
- 2415.0
Population outlook (Cook County) Hauer SSP2
- Today (2025)
- 5,347,519 people
- By 2030
- 5,357,703 · +0.2%
- By 2040
- 5,324,924 · -0.4%
- By 2050
- 5,230,762 · -2.2%
- By 2075
- 4,785,735 · -10.5%
- By 2100
- 4,188,836 · -21.7%
Race, ethnicity, and origin ACS 2023
- Neighborhood character
- Predominantly Black (74%)
- Race & ethnicity
- Black 74% Hispanic / Latino 15% White 7% Two or more races 4%
- Hispanic origin (detail)
- Mexican 14%
- Common ancestry
- Romanian 2%
- Foreign-born
- 9% · Canada
- Languages at home
- 83% English-only · Spanish 14%
Political lean MEDSL · Cook
- 2024 margin
- Solid D (+42.0) · D 70.4% · R 28.4% · Other 1.2%
- 2008→2024 swing
- -11.4pp toward R · 2008: 53.4pp · 2024: 42.0pp
- All cycles
- 2024: D+42.0 2020: D+50.3 2016: D+53.0 2012: D+49.4 2008: D+53.4
Not yet ingested
- Civics
- —
Market trends
- HPI YoY
- ▼ -75.01%
- Current HPI
- 197.2137
- Rent YoY
- ▲ 6.17%
- Metro
- Chicago-Naperville-Elgin, IL-IN-WI
- State GDP YoY
- ▲ 1.59%
- F500 in state
- 60
Industry mix (Fortune 500 HQ in IL)
| Industry | F500 HQs | Revenue |
|---|---|---|
| Insurance | 4 | $201B |
|
||
| Consumer Goods | 4 | $87B |
|
||
| Industrial Machinery | 3 | $64B |
|
||
| Healthcare | 2 | $55B |
|
||
| Retail / Pharmacy | 1 | $148B |
|
||
| Agriculture / Food | 1 | $86B |
|
||
Price history
+58.9% since first listed32 events — show timeline
- 2026-04-28 Price Changed $143,000 MRED as Distributed by MLS Grid
- 2026-04-02 Price Changed $153,000 MRED as Distributed by MLS Grid
- 2026-03-05 Relisted — MRED as Distributed by MLS Grid
- 2026-03-05 Price Changed $165,000 MRED as Distributed by MLS Grid
- 2025-12-17 Pending — MRED as Distributed by MLS Grid
- 2025-12-05 Pending — MRED as Distributed by MLS Grid
- 2025-12-05 Listed $50,000 MRED as Distributed by MLS Grid
- 2025-11-19 Listing Removed — MRED as Distributed by MLS Grid
- 2025-07-31 Price Changed — MRED as Distributed by MLS Grid
- 2025-07-14 Price Changed — MRED as Distributed by MLS Grid
- 2025-06-27 Listed — MRED as Distributed by MLS Grid
- 2023-08-14 Pending — MRED as Distributed by MLS Grid
- 2023-06-17 Contingent — MRED as Distributed by MLS Grid
- 2023-06-14 Listing Removed — MRED as Distributed by MLS Grid
- 2023-06-12 Price Changed — MRED as Distributed by MLS Grid
- 2023-06-10 Price Changed — MRED as Distributed by MLS Grid
- 2023-06-09 Listing Removed — MRED as Distributed by MLS Grid
- 2023-06-09 Listed — MRED as Distributed by MLS Grid
- 2023-04-03 Price Changed — MRED as Distributed by MLS Grid
- 2021-12-15 Listing Removed — MRED as Distributed by MLS Grid
- 2021-11-05 Price Changed — MRED as Distributed by MLS Grid
- 2021-10-27 Listed — MRED as Distributed by MLS Grid
- 2018-10-02 Sold (Public Records) $145,000 Public Records
- 2018-09-28 Sold (MLS) $145,000 MRED as Distributed by MLS Grid
- 2018-08-30 Contingent — MRED as Distributed by MLS Grid
- 2018-08-07 Price Changed $149,900 MRED as Distributed by MLS Grid
- 2018-04-02 Listed $159,900 MRED as Distributed by MLS Grid
- 2018-01-15 Listing Removed — MRED as Distributed by MLS Grid
- 2017-10-25 Price Changed — MRED as Distributed by MLS Grid
- 2017-07-21 Listed — MRED as Distributed by MLS Grid
- 1991-10-02 Sold (Public Records) $115,000 Public Records
- 1979-09-12 Sold (Public Records) $90,000 Public Records
Property tax history
+4.4%/yrLatest (2023): $8,674 · +15.6% YoY. Source: county tax records.
Cash-flow waterfall
monthlySold comps — $/sqft
last 12 mo · ≤1 miLoading sold comps…