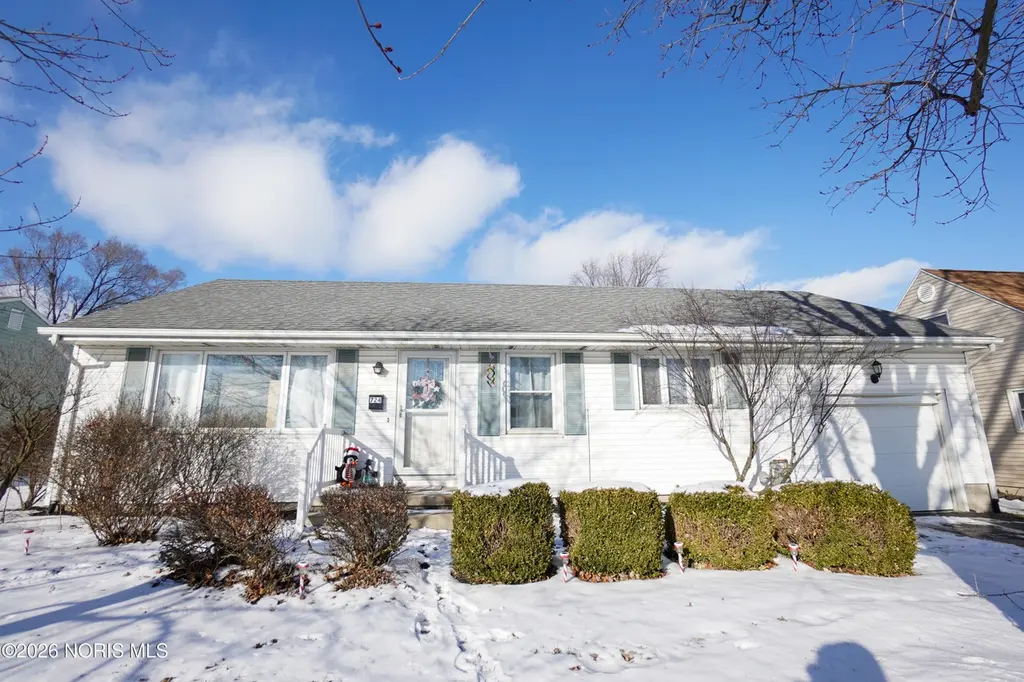
724 Edith Ave · Findlay, OH
Flood risk 1/10 · Minimal
- FEMA flood zone
- X (unshaded)
- Chance of flooding over 30 yrs
- 0.0%
- Est. flood insurance / yr
- $507 – $1,088
Fire risk 1/10 · Minimal
- Est. fire insurance / yr
- $713 – $1,323
Heat risk 3/10 · Minor
- Hot days now (above 98°F)
- 7 days/yr
- Hot days in 30 yrs
- 17 days/yr
Wind risk 2/10 · Minimal
- Chance of severe wind over 30 yrs
- —
Air-quality risk 2/10 · Minimal
- Unhealthy air days now
- 1 days/yr
- Unhealthy air days in 30 yrs
- 2 days/yr
Risk factors via First Street. Map © Google.
Why this score? — see what drove the D+ grade
The composite is a weighted blend of 9 inputs, each scored 0–100. Each bar is that input's sub-score; the figure is the points it added to the 100-point composite (weight × sub-score).
- Cash flow +14.6/30.0
- ARV discount +11.6/15.0
- Schools +4.7/10.0
- DSCR +4.5/10.0
- Livability +4.0/5.0
- Rent growth +3.9/5.0
- 1% rule +3.7/10.0
- Condition / age +2.5/5.0
- Appreciation +0.0/10.0
$190,000
🖨 Deal sheet 📄 Offer letter ✓ Due diligence
Listing remarks MLS
Welcome to 724 Edith Ave. This home is 3 bedrooms, 1 bathroom that features a Safe Step walk-in tub and fenced in back yard. New flooring in the living room and kitchen. Close to I-75 and shopping centers. This home is a must see! Schedule your showing today!
Key facts
- New flooring
- Close to i-75
- Fenced in back yard
Tags
Neighborhood map
What this means for you Summary
Snapshot
- This is a 2-bed/1.5-bath single-family listed at $190k.
Deal economics
- At list price, monthly cash flow is $45 ($543/yr) — positive.
- The deal already cash-flows at list — no discount required.
- To meet the 1% rule (rent ≥ 1% of price), the offer needs to be $165k (13.0% below list).
- Recommended offer: $165k (13.0% below list) — sets the bar for 1% rule.
- Cap rate 6.6% vs local median 5.0% in Findlay — top-decile yield for the area; either an underpriced asset or a hidden risk that comps aren't pricing in. Stress-test before assuming the spread holds.
Location & tenants
- Location reads 81/100 on livability (#98 in OH, #1,496 nationally) — a professional / high-income tenant draw. Strengths: amenities A+, cost of living A+, housing A+; Watch: employment D+, commute F.
- Findlay City (town): math 56% / reading 56% proficiency, ranked #357 of 656 in OH (top 54%) — acceptable for families but not a draw, mixed tenant base, ~2y average lease.
- Market conditions: Rents rising fast (+5.7%/yr); 219 active listings in the ZIP; 1 comparable units currently listed for rent nearby; 257 units permitted in Hancock County in 2024 (150 in 5+ unit buildings).
Forward outlook
- Local home prices are declining (-3.0%/yr); year-one equity from $1k of loan paydown is wiped out by about $6k of value loss. Plan a longer hold.
- Hancock County population projected to shrink 4% by 2050 — rents likely to lag national; underwrite the cash flow, not the appreciation.
Negotiation context
- It's been on market 137 days — a 12% lower offer ($167k) is reasonable based on typical stale-listing flexibility.
- 8 sale attempts since 5y ago with the ask held roughly flat each time — persistent listings suggest the price (not the market) is what's stuck; bring a comps-based counter.
- Current owner paid $165k; 15% above their basis — modest negotiation headroom, anchor on the comps not their cost.
Risks & watch-outs
- Watch-outs: built in 1958 — expect roof / HVAC / electrical / plumbing capex.
Questions for the listing agent
- It's been on market 137 days. Have you received any prior offers? Is the seller open to a 13% concession, seller financing, or rate buy-down credit?
- Built in 1958 — when were the roof, HVAC, electrical panel, plumbing, and water heater last replaced?
- Why hasn't it sold? Are there any deal-killer items the seller is aware of (foundation, flood, title, zoning, code violations)?
- Is there a deadline driving the sale (1031 exchange, divorce, estate, relocation)? That informs how much negotiation room exists.
- Schools are B-rated — typically a magnet for longer-tenancy family renters. What's the average tenant stay here, and is there a school-zone premium baked into asking?
- The area grade is low — what's the realistic commute time and amenity access for the typical tenant pool here? Any planned neighborhood developments (good or bad) we should know about?
- What's the average days-on-market for RENTAL listings here right now (not sales)? A rising rental-DOM trend means longer vacancies and softer asking-rent achievability than the comps imply.
- What's the recent tenant-quality profile in this submarket — average credit score on applications, eviction rate, late-payment / NSF rate, and stable-employment percentage? A property-management company in the area should have these aggregated.
- How much new for-sale + rental construction is in the pipeline within 1–3 miles? Heavy new supply typically softens prices + rents 12–24 months out; constrained supply supports both.
Investment metrics
- 1% rule
- 0.87% ✗
- Cap rate
- 6.58%
- Cash-on-cash
- 1.02%
- DSCR
- 1.05
- GRM
- 9.6
CMA / ARV
- ARV (median comp)
- $208,876
- List price
- $190,000
- Delta
- -9.04%
- Verdict
- FAIR
- Comps
- 20 within 1.0 mi
Show comp detail 12 sales within ~0.75 mi
| Address | Dist | Beds/Ba | Sqft | Sold | Price | $/sf | Match |
|---|---|---|---|---|---|---|---|
| 643 Edith Ave | 0.09mi | 3/2.0 (+1) | 1,212 (-1%) | 4mo | $190,000 | $157 | 83 |
| 528 Rector Ave | 0.28mi | 3/2.0 (+1) | 1,221 (-0%) | 2mo | $188,200 | $154 | 77 |
| 405 Clifton Ave | 0.45mi | 3/1.0 (+1) | 1,236 (+1%) | 2mo | $162,000 | $131 | 69 |
| 2616 Eton Pl | 0.47mi | 3/1.5 (+1) | 1,300 (+6%) | 4mo | $215,000 | $165 | 59 |
| 245 Edinborough Dr | 0.55mi | 3/1.0 (+1) | 1,275 (+4%) | 2mo | $176,900 | $139 | 59 |
| 2418 Hollybrook Dr | 0.53mi | 3/1.5 (+1) | 1,136 (-7%) | 1mo | $242,000 | $213 | 58 |
| 323 W Bigelow Ave | 0.65mi | 3/1.0 (+1) | 1,263 (+3%) | 0mo | $170,000 | $135 | 58 |
| 2419 Hollybrook Dr | 0.50mi | 3/1.5 (+1) | 1,107 (-10%) | 1mo | $255,000 | $230 | 55 |
| 120 W Melrose Ave | 0.63mi | 3/2.0 (+1) | 1,284 (+5%) | 2mo | $219,900 | $171 | 54 |
| 151 Monroe Ave | 0.64mi | 3/1.0 (+1) | 1,152 (-6%) | 0mo | $172,500 | $150 | 53 |
| 2215 Beecher St | 0.56mi | 3/2.0 (+1) | 1,383 (+13%) | 1mo | $254,000 | $184 | 45 |
| 145 Madison Ave | 0.70mi | 3/1.0 (+1) | 1,125 (-8%) | 4mo | $156,500 | $139 | 44 |
Match score weights: distance 35% · size 25% · config 20% · recency 20%. Top-matched comps best support the ARV.
Projected returns pro-forma
-3.0% appreciation · 5.68% rent growth · sell at horizon
- IRR
- -11.8%
- Equity multiple
- 0.56×
- Total profit
- $-23,337
- Equity at exit
- $28,330
- IRR
- 0.8%
- Equity multiple
- 1.06×
- Total profit
- $3,197
- Equity at exit
- $16,428
Cash invested: $53,200 (down + closing). Projections, not guarantees.
Landlord ↔ Tenant lean methodology
- Overall (STATE)
- 73 Landlord-Friendly
- State Ohio
- 73 Landlord-Friendly · R+6
- County
- — inherits STATE
- City
- — inherits STATE
ZIP-level market 45840
- Rents YoY
- 5.7%
- Active inventory
- 219
- Price-to-rent
- 9.6×
Monthly cashflow live
- Estimated rent
- $1,653 medium interval (Pro) →
- Mortgage (P&I)
- −$996
- Tax from tax record
- −$185 /mo · $2,216/yr
- Insurance
- −$79
- HOA
- −$0
- Vacancy / Maint / Mgmt
- −$347
- Net cashflow
- $45
Break-even live
UW: 25.0% down · 7.5% · 30yr · 1.5% tax · 5.0% vac · 8.0% maint · 8.0% mgmt
Financing live
Cash to close
- Down payment
- $47,500
- Closing costs
- $5,700
- Reserves months
- —
- Total cash needed
- —
Loan-product check · same deal, 3 products live
Conventional
25% down · 7.5% · 30yr
- Down + closing
- —
- Monthly P&I
- —
- Monthly cashflow
- —
- DSCR
- —
- Eligible?
- —
Personal DTI + credit; lowest rate.
DSCR
20% down · 8.5% · 30yr
- Down + closing
- —
- Monthly P&I
- —
- Monthly cashflow
- —
- DSCR
- —
- Eligible?
- —
No personal income docs; deal must DSCR.
Hard money
10% down · 12.0% · 12mo
- Down + closing
- —
- Monthly P&I
- —
- Monthly cashflow
- —
- DSCR
- —
- Eligible?
- —
Short-term bridge; refi at stabilization.
Rent comps 1 comps
| Address | Beds | Baths | Sqft | Rent | $/sqft | DOM | Units | Dist |
|---|---|---|---|---|---|---|---|---|
| 1001 Heartland Ct Findlay, OH | 2.0–3.0 | 2.0–2.5 | 1455 | $2,200 | $1.51 | 23d | 12 | 1.47mi |
Listing history 34 events
-
2026-06-19days on market $190,000 Active 137 DOM
-
2026-06-18days on market $190,000 Active 136 DOM
-
2026-06-17days on market $190,000 Active 135 DOM
-
2026-06-16days on market $190,000 Active 134 DOM
-
2026-06-15days on market $190,000 Active 133 DOM
-
2026-06-14days on market $190,000 Active 131 DOM
-
2026-06-12days on market $190,000 Active 130 DOM
-
2026-06-09days on market $190,000 Active 127 DOM
-
2026-06-08days on market $190,000 Active 126 DOM
-
2026-06-07days on market $190,000 Active 125 DOM
-
2026-06-05days on market $190,000 Active 122 DOM
-
2026-06-02days on market $190,000 Active 120 DOM
-
2026-06-01days on market $190,000 Active 119 DOM
-
2026-05-31days on market $190,000 Active 118 DOM
-
2026-05-30days on market $190,000 Active 117 DOM
-
2026-03-10price $190,000 260-char remark
Show marketing remark (264 chars)
Welcome to 724 Edith Ave. This home is 3 bedrooms, 1 bathroom that features a Safe Step walk-in tub and fenced in back yard. New flooring in the living room and kitchen. Close to I-75 and shopping centers. This home is a must see! Schedule your showing today!
-
2026-03-10price $190,000 264-char remark
Show marketing remark (264 chars)
Welcome to 724 Edith Ave. This home is 3 bedrooms, 1 bathroom that features a Safe Step walk-in tub and fenced in back yard. New flooring in the living room and kitchen. Close to I-75 and shopping centers. This home is a must see! Schedule your showing today!
-
2026-02-02$199,000 Active 260-char remark
Show marketing remark (264 chars)
Welcome to 724 Edith Ave. This home is 3 bedrooms, 1 bathroom that features a Safe Step walk-in tub and fenced in back yard. New flooring in the living room and kitchen. Close to I-75 and shopping centers. This home is a must see! Schedule your showing today!
-
2026-02-02$199,000 Active 264-char remark
Show marketing remark (264 chars)
Welcome to 724 Edith Ave. This home is 3 bedrooms, 1 bathroom that features a Safe Step walk-in tub and fenced in back yard. New flooring in the living room and kitchen. Close to I-75 and shopping centers. This home is a must see! Schedule your showing today!
-
2025-06-23status Active
-
2025-06-23status Active
-
2025-06-23historical
-
2025-05-23historical Active Under Contract
-
2025-05-23historical Contingent
-
2025-01-14$183,500 Active
-
2025-01-14$183,500 Active
-
2024-05-22historical
-
2024-04-03$179,900 Active
-
2024-03-26historical
-
2021-05-27soldstatus $165,000
-
2021-05-25soldstatus $165,000
-
2021-05-24price $165,000
-
2021-04-21$154,900
-
1992-06-01soldstatus $68,000
ⓘ Source: listings_history table (triggers on properties + properties_extension) + one-shot
backfill from property_details.listing_events for pre-trigger history.
Tax reassessment forecast OH · Partial reset (capped growth)
- Current annual tax
- $2,216 · $185/mo
- Projected year-2 tax
- $2,590 · $216/mo
- Expected delta
- +$374/yr (+$31/mo · 16.9%)
ⓘ Screening estimate from a state-policy table — verify with the county assessor before closing.
Climate risk First Street
- Flood 1/10 Low FEMA zone X (unshaded) · 0% chance over 30 yrs
- Wildfire 1/10 Low
- Heat 3/10 Moderate 7 d/yr ≥98°F today · 17 d/yr by 30 yrs out
- Wind 2/10 Low
- Air quality 2/10 Low 1 unhealthy d/yr today · 2 by 30 yrs out
Nearby sold comps map
Loading sold comps map…
Walkable amenities ~0.75 mi
Loading nearby amenities…
Taxation est. · year 1
- Rental income
- $19,831
- − Mortgage interest
- −$10,643
- − Property taxes
- −$2,216
- − Insurance
- −$950
- − Repairs & maintenance
- −$1,586
- − Management
- −$1,586
- − Depreciation
- −$5,527
- Taxable loss
- −$2,679
- Est. tax savings @ 24.0%
- +$643
- After-tax cash flow
- $1,186/yr
For passive investors: Depreciation is non-cash, so a rental often shows a tax loss while cash-flowing — sheltering income. Rental losses are passive: they offset passive income freely, and up to $25,000/yr can offset ordinary (W-2) income if you actively participate and your MAGI is under $100k (phasing out to $0 by $150k); unused losses carry forward. On sale, claimed depreciation is recaptured at up to 25%, and gains may owe capital-gains tax (a 1031 exchange can defer both). Figures are a year-1 estimate at your 24.0% rate — not tax advice; consult a CPA.
Schools (NCES district)
- District
- Findlay City
- NCES district ID
- 3910000
- Math proficiency
- 56% ▼ -11.00%
- Reading proficiency
- 56% ▼ -9.00%
- Median HH income
- $45,261
- Composite
- 47.31/100
- National rank
- #2300
- State rank
- #357 of 656 in OH
Livability — Findlay
- Score
- 81/100
- State rank
- #98
- US rank
- #1496
Category grades
Schools grade is shown separately in the Schools card above.
Census & demographics
- County
- Hancock County · 54,559 people
- City population
- 54,559
- Metro
- Findlay, OH
- Population (ZIP)
- 54,559
- Household income
- $68,083
- Rent vs Own
- Severe rent burden
- 1540.0
Population outlook (Hancock County) Hauer SSP2
- Today (2025)
- 77,526 people
- By 2030
- 77,777 · +0.3%
- By 2040
- 76,976 · -0.7%
- By 2050
- 74,479 · -3.9%
- By 2075
- 65,741 · -15.2%
- By 2100
- 52,942 · -31.7%
Race, ethnicity, and origin ACS 2023
- Neighborhood character
- Predominantly White (85%)
- Race & ethnicity
- White 85% Hispanic / Latino 6% Two or more races 5% Asian 2% Black 2%
- Hispanic origin (detail)
- Mexican 5%
- Common ancestry
- Romanian 3% Italian 2% Lithuanian 2%
- Foreign-born
- 4% · Canada, China
- Languages at home
- 94% English-only · Spanish 3% Other Asian/Pacific 1% Arabic 1%
Political lean MEDSL · Hancock
- 2024 margin
- Solid R (+38.4) · D 30.2% · R 68.7% · Other 1.1%
- 2008→2024 swing
- -15.3pp toward R · 2008: -23.1pp · 2024: -38.4pp
- All cycles
- 2024: R+38.4 2020: R+37.5 2016: R+40.8 2012: R+28.3 2008: R+23.1
Not yet ingested
- Civics
- —
Market trends
- HPI YoY
- ▼ -250.43%
- Current HPI
- 194.9132
- Rent YoY
- ▲ 5.68%
- Metro
- Findlay, OH
- State GDP YoY
- ▲ 1.98%
- F500 in state
- 48
Industry mix (Fortune 500 HQ in OH)
| Industry | F500 HQs | Revenue |
|---|---|---|
| Insurance | 3 | $145B |
|
||
| Industrial Machinery | 3 | $49B |
|
||
| Financial Services | 3 | $24B |
|
||
| Consumer Goods | 2 | $93B |
|
||
| Aerospace / Defense | 2 | $47B |
|
||
| Utilities | 2 | $33B |
|
||
Price history
+179.4% since first listed19 events — show timeline
- 2026-03-10 Price Changed $190,000 WCARE
- 2026-03-10 Price Changed $190,000 NORIS
- 2026-02-02 Listed $199,000 WCARE
- 2026-02-02 Listed $199,000 NORIS
- 2025-06-23 Relisted — WCARE
- 2025-06-23 Relisted — NORIS
- 2025-06-23 Listing Removed — NORIS
- 2025-05-23 Contingent — WCARE
- 2025-05-23 Contingent — NORIS
- 2025-01-14 Listed $183,500 WCARE
- 2025-01-14 Listed $183,500 NORIS
- 2024-05-22 Listing Removed — NORIS
- 2024-04-03 Listed $179,900 NORIS
- 2024-03-26 Coming Soon — NORIS
- 2021-05-27 Sold (Public Records) $165,000 Public Records
- 2021-05-25 Sold (MLS) $165,000 NORIS
- 2021-05-24 Price Changed $165,000 NORIS
- 2021-04-21 Listed $154,900 NORIS
- 1992-06-01 Sold (Public Records) $68,000 Public Records
Property tax history
+6.9%/yrLatest (2025): $2,216 · +14.8% YoY. Source: county tax records.
Cash-flow waterfall
monthlySold comps — $/sqft
last 12 mo · ≤1 miLoading sold comps…