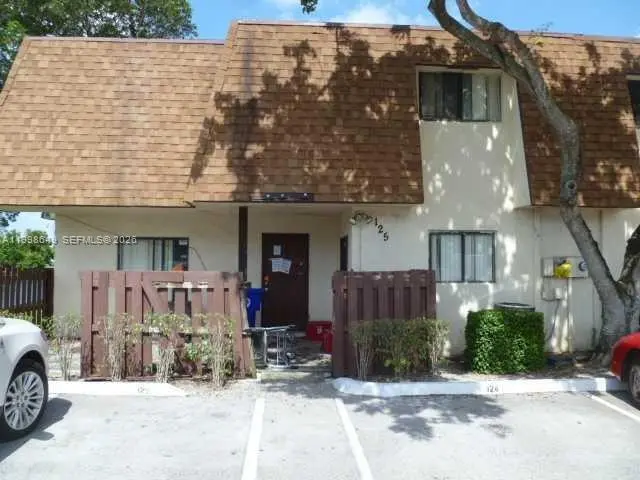
125 San Remo Blvd · North Lauderdale, FL
Flood risk 1/10 · Minimal
- FEMA flood zone
- X (shaded)
- Chance of flooding over 30 yrs
- 0.0%
- Est. flood insurance / yr
- $507 – $1,088
Fire risk 1/10 · Minimal
- Est. fire insurance / yr
- $947 – $1,759
Heat risk 10/10 · Severe
- Hot days now (above 106°F)
- 7 days/yr
- Hot days in 30 yrs
- 28 days/yr
Wind risk 10/10 · Severe
- Chance of severe wind over 30 yrs
- 99.0%
Air-quality risk 3/10 · Minor
- Unhealthy air days now
- 3 days/yr
- Unhealthy air days in 30 yrs
- 3 days/yr
Risk factors via First Street. Map © Google.
Why this score? — see what drove the C- grade
The composite is a weighted blend of 9 inputs, each scored 0–100. Each bar is that input's sub-score; the figure is the points it added to the 100-point composite (weight × sub-score).
- ARV discount +15.0/15.0
- Cash flow +13.4/30.0
- 1% rule +5.4/10.0
- DSCR +4.1/10.0
- Schools +4.1/10.0
- Livability +3.8/5.0
- Condition / age +2.5/5.0
- Rent growth +2.3/5.0
- Appreciation +0.0/10.0
$280,000
🖨 Deal sheet (PDF) 📄 Offer letter ✓ Due diligence
Listing remarks
Renovated 3 bedrooms 2.5 baths townhouse with private covered patio. Close to diversified plaza/shopping. Brand new kitchen with quartz countertops and huge island. Washer and dryer inside. Freshly Painted - Corner Unit with water view.
Key facts
- $145 HOA
- Garage
- Built 1984
Property features AI
Finance
- Financial info: Pets allowed with restrictions
- HOA & community: Monthly association fee of $145; Association amenities include elevator(s)
Exterior
- Parking: Assigned parking; Covered parking (1 space); 1-car garage
- Security: No security features provided
- Utilities: Cooling: Central Air
- Home design: Attached property; Entry level: ground floor; Resale property
- Construction: Stucco construction
- Exterior features: Fenced yard; Patio; Canal-front waterfront
Interior
- Kitchen: Electric range; Refrigerator
- Bedrooms: Primary bedroom on upper level
- Flooring: Ceramic tile; Parquet
- Bathrooms: 2 full bathrooms; 1 half bathroom
- Heating & cooling: Central air conditioning
- Interior features: Breakfast area; Combined living and dining room; Tub with shower; Upper-level primary bedroom
- Laundry & utility: Washer/dryer information not provided
Neighborhood map
What this means for you Summary
Snapshot
- This is a 3-bed/3.0-bath single-family listed at $280k.
Deal economics
- At list price, monthly cash flow is $8 ($91/yr) — positive.
- The deal already cash-flows at list — no discount required.
- Meets the 1% rule at list price ($3k rent vs $280k).
- Recommended offer: $263k (6.0% below list) — sets the bar for market timing.
- Cap rate 6.3% vs local median 4.3% in North Lauderdale — top-decile yield for the area; either an underpriced asset or a hidden risk that comps aren't pricing in. Stress-test before assuming the spread holds.
Location & tenants
- Location reads 76/100 on livability (#230 in FL, #3,635 nationally) — a middle-class / working-renter tenant base. Strengths: housing A+, health & safety A+, cost of living A; Watch: commute C-, employment D, amenities F.
- Broward (suburban): math 42% / reading 53% proficiency, ranked #46 of 73 in FL (top 63%) — families likely to look elsewhere, expect single-tenant / working-renter base with shorter leases.
- Zoned schools: Nova Blanche Forman Elementary (math 35% / reading 55%, grade D-, #1,271 of 2,144 statewide, top 60%, 769 students, 72% FRL); Nova Middle School (math 44% / reading 53%, grade C-, #274 of 571 statewide, top 50%, 1,284 students, 68% FRL); Nova High School (math 22% / reading 56%, grade F, #312 of 667 statewide, top 48%, 2,227 students, 59% FRL) — zoned schools average 66% FRL vs 51% district-wide (15 pts higher); higher-poverty schools than district average — tighter screening recommended.
- Market conditions: Rents soft (-0.7%/yr); 300 active listings in the ZIP; 40 comparable units currently listed for rent nearby; rentals at typical pace (median 26d on market — plan ~3-4 weeks tenant-placement turnaround); 2,111 units permitted in Broward County in 2024 (1,265 in 5+ unit buildings).
- At $2,905/mo this rent would consume 54% of the median local household income ($64k/yr) (locally 3073% of renters already pay >50% of income on rent) — very limited rent-growth headroom before tenants either downsize or default.
Forward outlook
- Local home prices are declining (-3.0%/yr); year-one equity from $2k of loan paydown is wiped out by about $8k of value loss. Plan a longer hold.
- Broward County population projected at +34% by 2050 — long-run rental-demand tailwind backs the buy-and-hold thesis.
Negotiation context
- It's been on market 72 days — a 6% lower offer ($263k) is reasonable based on typical stale-listing flexibility.
- Current owner paid $68k; list at $280k implies a 312% gain — meaningful room to come down on a strong offer.
Risks & watch-outs
- Climate carrying-cost: severe wind risk, 99% chance of damaging wind over 30y; extreme-heat days projected 7→28/yr by 2055 (HVAC capex compounding) — expect insurance premiums to compound above CPI over the hold.
Questions for the listing agent
- It's been on market 72 days. Have you received any prior offers? Is the seller open to a 6% concession, seller financing, or rate buy-down credit?
- What does the HOA fee cover, when was the last increase, and are there any pending special assessments or reserve-fund shortfalls?
- Why hasn't it sold? Are there any deal-killer items the seller is aware of (foundation, flood, title, zoning, code violations)?
- Is there a deadline driving the sale (1031 exchange, divorce, estate, relocation)? That informs how much negotiation room exists.
- What's the average days-on-market for RENTAL listings here right now (not sales)? A rising rental-DOM trend means longer vacancies and softer asking-rent achievability than the comps imply.
- What's the recent tenant-quality profile in this submarket — average credit score on applications, eviction rate, late-payment / NSF rate, and stable-employment percentage? A property-management company in the area should have these aggregated.
- How much new for-sale + rental construction is in the pipeline within 1–3 miles? Heavy new supply typically softens prices + rents 12–24 months out; constrained supply supports both.
Investment metrics
- 1% rule
- 1.04% ✓
- Cap rate
- 6.33%
- Cash-on-cash
- 0.12%
- DSCR
- 1.01
- GRM
- 8.0
CMA / ARV
- ARV (on-the-fly)
- $404,064
- Comps found
- 3
Show comp detail 3 sales within ~0.75 mi
| Address | Dist | Beds/Ba | Sqft | Sold | Price | $/sf | Match |
|---|---|---|---|---|---|---|---|
| 6502 Boulevard Of Champions | 0.21mi | 3/2.0 | 1,300 (-7%) | 2mo | $409,000 | $315 | 72 |
| 739 Holly St | 0.23mi | 3/2.0 | 1,470 (+5%) | 8mo | $424,000 | $288 | 71 |
| 6490 SW 8th St | 0.71mi | 2/2.0 (-1) | 1,267 (-10%) | 15mo | $360,000 | $284 | 29 |
Match score weights: distance 35% · size 25% · config 20% · recency 20%. Top-matched comps best support the ARV.
Projected returns pro-forma
-3.0% appreciation · 0.0% rent growth · sell at horizon
- IRR
- -20.1%
- Equity multiple
- 0.32×
- Total profit
- $-53,142
- Equity at exit
- $41,749
- IRR
- -23.5%
- Equity multiple
- 0.01×
- Total profit
- $-77,494
- Equity at exit
- $24,209
Cash invested: $78,400 (down + closing). Projections, not guarantees.
Landlord ↔ Tenant lean methodology
- Overall (STATE)
- 87 Strongly Landlord-Friendly
- State Florida
- 87 Strongly Landlord-Friendly · R+3
- County
- — inherits STATE
- City
- — inherits STATE
ZIP-level market 33068
- Rents YoY
- -0.7%
- Active inventory
- 300
- Price-to-rent
- 8.0×
Monthly cashflow live
- Estimated rent
- $2,905 high interval (Pro) →
- Mortgage (P&I)
- −$1,468
- Tax from tax record
- −$557 /mo · $6,685/yr
- Insurance
- −$117
- HOA
- −$145
- Vacancy / Maint / Mgmt
- −$610
- Net cashflow
- $8
Break-even live
Sensitivity live
| Price | -10% $166 | -5% $87 | +0% $8 | +5% $-72 | +10% $-151 |
|---|---|---|---|---|---|
| Rent | -10% $-222 | -5% $-107 | +0% $8 | +5% $122 | +10% $237 |
| Rate | -1.0pp $149 | -0.5pp $79 | base $8 | +0.5pp $-65 | +1.0pp $-139 |
UW: 25.0% down · 7.5% · 30yr · 1.5% tax · 5.0% vac · 8.0% maint · 8.0% mgmt
Financing live
Cash to close
- Down payment
- $70,000
- Closing costs
- $8,400
- Reserves months
- —
- Total cash needed
- —
Loan-product check · same deal, 3 products live
Conventional
25% down · 7.5% · 30yr
- Down + closing
- —
- Monthly P&I
- —
- Monthly cashflow
- —
- DSCR
- —
- Eligible?
- —
Personal DTI + credit; lowest rate.
DSCR
20% down · 8.5% · 30yr
- Down + closing
- —
- Monthly P&I
- —
- Monthly cashflow
- —
- DSCR
- —
- Eligible?
- —
No personal income docs; deal must DSCR.
Hard money
10% down · 12.0% · 12mo
- Down + closing
- —
- Monthly P&I
- —
- Monthly cashflow
- —
- DSCR
- —
- Eligible?
- —
Short-term bridge; refi at stabilization.
Rent comps 40 comps
| Address | Beds | Baths | Sqft | Rent | $/sqft | DOM | Units | Dist |
|---|---|---|---|---|---|---|---|---|
| 129 San Remo Blvd #129 North Lauderdale, FL | 3.0 | 2.5 | 1403 | $2,600 | $1.85 | 26d | 1 | 0.00mi |
| 1368 Seaview North Lauderdale, FL | 4.0 | 3.0 | 1492 | $3,400 | $2.28 | 26d | 1 | 0.09mi |
| 224 San Remo Blvd Unit 224 North Lauderdale, FL | 3.0 | 2.5 | 1289 | $2,900 | $2.25 | 26d | 1 | 0.09mi |
| 1358 Silverado North Lauderdale, FL | 4.0 | 2.5 | 1380 | $3,475 | $2.52 | 23d | 1 | 0.12mi |
| 253 San Remo Blvd #253 North Lauderdale, FL | 3.0 | 2.5 | 1403 | $2,300 | $1.64 | 26d | 1 | 0.13mi |
| 6511 SW 15th Ct Pompano Beach, FL | 4.0 | 2.0 | 1190 | $3,250 | $2.73 | 26d | 1 | 0.19mi |
| 915 E Maple St North Lauderdale, FL | 3.0 | 2.0 | 1470 | $3,350 | $2.28 | 15d | 1 | 0.25mi |
| 1034 W Jasmine Ln North Lauderdale, FL | 3.0 | 2.0 | 1470 | $2,850 | $1.94 | 26d | 1 | 0.30mi |
| 1038 W Jasmine Ln North Lauderdale, FL | 3.0 | 2.0 | 1470 | $3,000 | $2.04 | 6d | 1 | 0.32mi |
| 1720 SW 64th Ter North Lauderdale, FL | 3.0 | 2.0 | 1248 | $3,600 | $2.88 | 13d | 1 | 0.35mi |
| 6872 SW 15th St Pompano Beach, FL | 2.0 | 1.0 | 919 | $2,400 | $2.61 | 15d | 1 | 0.38mi |
| 6533 Harbour Rd North Lauderdale, FL | 4.0 | 2.0 | 1180 | $3,850 | $3.26 | 26d | 1 | 0.40mi |
| 6551 Boulevard of Champions #6551 North Lauderdale, FL | 4.0 | 2.5 | 1472 | $2,600 | $1.77 | 9d | 1 | 0.41mi |
| 6551 Boulevard of Champions #6551 North Lauderdale, FL | 4.0 | 2.5 | 1472 | $2,600 | $1.77 | 26d | 1 | 0.41mi |
| 5413 SW 14th St North Lauderdale, FL | 3.0 | 2.5 | 1462 | $3,000 | $2.05 | 26d | 1 | 0.48mi |
| 6473 SW 19th St Pompano Beach, FL | 4.0 | 2.0 | 1484 | $2,800 | $1.89 | 26d | 1 | 0.48mi |
| 5600 SW 12th St North Lauderdale, FL | 1.0–3.0 | 1.0–2.0 | 892 | $2,795 | $3.13 | 20d | 3 | 0.51mi |
| 6081 SW 19th St North Lauderdale, FL | 2.0 | 2.5 | 1161 | $2,499 | $2.15 | 26d | 1 | 0.51mi |
| 6081 SW 19th St North Lauderdale, FL | 2.0 | 2.5 | 1161 | $2,290 | $1.97 | 6d | 1 | 0.51mi |
| 1937 SW 60th Ter #1937 North Lauderdale, FL | 3.0 | 2.5 | 1640 | $2,650 | $1.62 | 26d | 1 | 0.55mi |
| 6009 SW 19th St North Lauderdale, FL | 3.0 | 2.0 | 1600 | $2,900 | $1.81 | 19d | 1 | 0.55mi |
| 6009 SW 19th St Unit 6009 North Lauderdale, FL | 4.0 | 2.5 | 1640 | $2,900 | $1.77 | 0d | 1 | 0.55mi |
| 6009 SW 19th St Unit 6009 North Lauderdale, FL | 4.0 | 2.5 | 1640 | $2,900 | $1.77 | 19d | 1 | 0.55mi |
| 6870 SW 18th Ct #6870 Pompano Beach, FL | 4.0 | 2.0 | 1346 | $3,700 | $2.75 | 26d | 1 | 0.56mi |
| 1407 S Santa Catalina Cir North Lauderdale, FL | 2.0 | 2.5 | 1224 | $2,140 | $1.75 | 26d | 1 | 0.56mi |
| 6060 SW 19th Ct North Lauderdale, FL | 2.0 | 3.0 | 1120 | $2,200 | $1.96 | 26d | 1 | 0.57mi |
| 1904 SW 60th Ave North Lauderdale, FL | 3.0 | 2.5 | 1640 | $2,900 | $1.77 | 5d | 1 | 0.57mi |
| 1904 SW 60th Ave North Lauderdale, FL | 3.0 | 2.0 | 1600 | $2,900 | $1.81 | 19d | 1 | 0.57mi |
| 1904 SW 60th Ave North Lauderdale, FL | 3.0 | 2.5 | 1640 | $2,900 | $1.77 | 18d | 1 | 0.57mi |
| 1200 SW 52nd Ave North Lauderdale, FL | 3.0 | 2.0 | 1027 | $2,100 | $2.04 | 26d | 1 | 0.58mi |
| 1956 SW 60th Ter Unit 1956 North Lauderdale, FL | 3.0 | 2.5 | 1640 | $2,600 | $1.59 | 14d | 1 | 0.58mi |
| 1958 SW 60th Ter Unit 1958 North Lauderdale, FL | 3.0 | 2.5 | 1640 | $2,600 | $1.59 | 26d | 1 | 0.59mi |
| 1958 SW 60th Ter Unit 1958 North Lauderdale, FL | 3.0 | 2.5 | 1640 | $2,450 | $1.49 | 0d | 1 | 0.59mi |
| 6481 Kimberly Blvd North Lauderdale, FL | 3.0 | 2.0 | 1728 | $3,650 | $2.11 | 26d | 1 | 0.59mi |
| 1304 N Santa Catalina Cir #1304 North Lauderdale, FL | 2.0 | 2.5 | 1224 | $2,100 | $1.72 | 26d | 1 | 0.59mi |
| 6812 Rio Pinar Unit 1 North Lauderdale, FL | 3.0 | 2.0 | 1610 | $3,500 | $2.17 | 18d | 1 | 0.60mi |
| 6812 Rio Pinar North Lauderdale, FL | 3.0 | 2.0 | 1610 | $3,500 | $2.17 | 12d | 1 | 0.60mi |
| 6812 Rio Pinar Unit 1 North Lauderdale, FL | 3.0 | 2.0 | 1610 | $3,500 | $2.17 | 23d | 1 | 0.60mi |
| 6963 SW 19th St Pompano Beach, FL | 2.0 | 1.0 | 1054 | $1,700 | $1.61 | 26d | 1 | 0.61mi |
| 1700 S State Road 7 North Lauderdale, FL | 1.0–3.0 | 1.0–2.0 | 1118 | $3,335 | $2.98 | 0d | 15 | 0.63mi |
HOA detail
- Monthly dues
- $145 · $1,740/yr
- Likely covers
- water
Listing history 19 events
-
2026-06-21days on market $280,000 Active 72 DOM
-
2026-06-18days on market $280,000 Active 69 DOM
-
2026-06-17days on market $280,000 Active 68 DOM
-
2026-06-16days on market $280,000 Active 67 DOM
-
2026-06-15days on market $280,000 Active 66 DOM
-
2026-06-13days on market $280,000 Active 64 DOM
-
2026-06-09days on market $280,000 Active 60 DOM
-
2026-06-08days on market $280,000 Active 59 DOM
-
2026-06-07days on market $280,000 Active 58 DOM
-
2026-06-04days on market $280,000 Active 55 DOM
-
2026-06-03days on market $280,000 Active 54 DOM
-
2026-06-02days on market $280,000 Active 53 DOM
-
2026-06-01days on market $280,000 Active 52 DOM
-
2026-05-31days on market $280,000 Active 51 DOM
-
2026-04-10$280,000 Active
-
2013-04-15soldstatus $68,000
-
2004-10-11soldstatus $110,000
-
1996-06-14soldstatus $69,900
-
1984-08-01soldstatus $65,000
ⓘ Source: listings_history table (triggers on properties + properties_extension) + one-shot
backfill from property_details.listing_events for pre-trigger history.
Tax reassessment forecast FL · Resets to sale price
- Current annual tax
- $6,685 · $557/mo
- Projected year-2 tax
- $6,685 · $557/mo
- Expected delta
- $0/yr ($0/mo · 0.0%)
ⓘ Screening estimate from a state-policy table — verify with the county assessor before closing.
Climate risk First Street
- Flood 1/10 Low FEMA zone X (shaded) · 0% chance over 30 yrs
- Wildfire 1/10 Low
- Heat 10/10 Extreme 7 d/yr ≥106°F today · 28 d/yr by 30 yrs out
- Wind 10/10 Extreme 99% chance of damaging wind over 30 yrs
- Air quality 3/10 Moderate 3 unhealthy d/yr today · 3 by 30 yrs out
Nearby sold comps map
Loading sold comps map…
Walkable amenities ~0.75 mi
Loading nearby amenities…
Taxation est. · year 1
- Rental income
- $34,856
- − Mortgage interest
- −$15,684
- − Property taxes
- −$6,685
- − Insurance
- −$1,400
- − Repairs & maintenance
- −$2,788
- − Management
- −$2,788
- − HOA
- −$1,740
- − Depreciation
- −$8,145
- Taxable loss
- −$4,376
- Est. tax savings @ 24.0%
- +$1,050
- After-tax cash flow
- $1,141/yr
For passive investors: Depreciation is non-cash, so a rental often shows a tax loss while cash-flowing — sheltering income. Rental losses are passive: they offset passive income freely, and up to $25,000/yr can offset ordinary (W-2) income if you actively participate and your MAGI is under $100k (phasing out to $0 by $150k); unused losses carry forward. On sale, claimed depreciation is recaptured at up to 25%, and gains may owe capital-gains tax (a 1031 exchange can defer both). Figures are a year-1 estimate at your 24.0% rate — not tax advice; consult a CPA.
Schools (NCES district)
- District
- Broward
- NCES district ID
- 1200180
- Math proficiency
- 42% ▼ -18.00%
- Reading proficiency
- 53% ▼ -5.00%
- Median HH income
- $52,139
- Composite
- 40.88/100
- National rank
- #3621
- State rank
- #46 of 73 in FL
Livability — North Lauderdale
- Score
- 76/100
- State rank
- #230
- US rank
- #3635
Category grades
Schools grade is shown separately in the Schools card above.
Census & demographics
- Census place
- North Lauderdale, FL
- County
- Broward County · 1,963,430 people
- City population
- 54,439
- Metro
- Miami-Fort Lauderdale-Pompano Beach, FL
- Population (ZIP)
- 54,439
- Household income
- $64,051
- Rent vs Own
- Severe rent burden
- 3073.0
Population outlook (Broward County) Hauer SSP2
- Today (2025)
- 2,207,033 people
- By 2030
- 2,360,704 · +7.0%
- By 2040
- 2,661,208 · +20.6%
- By 2050
- 2,946,698 · +33.5%
- By 2075
- 3,602,273 · +63.2%
- By 2100
- 3,970,984 · +79.9%
Race, ethnicity, and origin ACS 2023
- Neighborhood character
- Diverse neighborhood (Simpson 0.61)
- Race & ethnicity
- Black 58% Hispanic / Latino 21% Two or more races 13% White 11% Asian 4%
- Hispanic origin (detail)
- Mexican 3% Puerto Rican 4% Cuban 1% Dominican 3%
- Common ancestry
- Hispanic 17% Estonian 1% Lithuanian 1%
- Foreign-born
- 47% · Canada, Jamaica, Vietnam
- Languages at home
- 59% English-only · Spanish 19% French/Haitian/Cajun 15% Other Indo-European 2%
Political lean MEDSL · Broward
- 2024 margin
- D (+17.0) · D 58.0% · R 41.0%
- 2008→2024 swing
- -17.8pp toward R · 2008: 34.7pp · 2024: 17.0pp
- All cycles
- 2024: D+17.0 2020: D+29.8 2016: D+35.0 2012: D+34.9 2008: D+34.7
Not yet ingested
- Civics
- —
Market trends
- HPI YoY
- ▼ -317.60%
- Current HPI
- 426.2972
- Rent YoY
- ▼ -0.74%
- Metro
- Miami-Fort Lauderdale-Pompano Beach, FL
- State GDP YoY
- ▲ 3.28%
- F500 in state
- 36
Industry mix (Fortune 500 HQ in FL)
| Industry | F500 HQs | Revenue |
|---|---|---|
| Industrial Technology | 2 | $29B |
|
||
| Insurance | 2 | $17B |
|
||
| Retail | 1 | $60B |
|
||
| Technology Distribution | 1 | $58B |
|
||
| Homebuilding | 1 | $35B |
|
||
| Technology Manufacturing | 1 | $35B |
|
||
Price history
+330.8% since first listed5 events — show timeline
- 2026-04-10 Listed $280,000 MARMLS
- 2013-04-15 Sold (Public Records) $68,000 Public Records
- 2004-10-11 Sold (Public Records) $110,000 Public Records
- 1996-06-14 Sold (Public Records) $69,900 Public Records
- 1984-08-01 Sold (Public Records) $65,000 Public Records
Property tax history
+9.8%/yrLatest (2025): $6,685 · +7.8% YoY. Source: county tax records.
Cash-flow waterfall
monthlySold comps — $/sqft
last 12 mo · ≤1 miLoading sold comps…