290 240th Ave #4 · Arnolds Park, IA
Flood risk 1/10 · Minimal
- FEMA flood zone
- X (unshaded)
- Chance of flooding over 30 yrs
- 0.0%
- Est. flood insurance / yr
- $473 – $860
Fire risk 5/10 · Moderate
- Est. fire insurance / yr
- $902 – $1,676
Heat risk 2/10 · Minimal
- Hot days now (above 98°F)
- 7 days/yr
- Hot days in 30 yrs
- 16 days/yr
Wind risk 2/10 · Minimal
- Chance of severe wind over 30 yrs
- —
Air-quality risk 1/10 · Minimal
- Unhealthy air days now
- 0 days/yr
- Unhealthy air days in 30 yrs
- 0 days/yr
Risk factors via First Street. Map © Google.
Why this score? — see what drove the D grade
The composite is a weighted blend of 9 inputs, each scored 0–100. Each bar is that input's sub-score; the figure is the points it added to the 100-point composite (weight × sub-score).
- ARV discount +15.0/15.0
- Appreciation +10.0/10.0
- Schools +6.7/10.0
- Livability +3.9/5.0
- Rent growth +2.5/5.0
- Condition / age +2.5/5.0
- Cash flow +0.0/30.0
- 1% rule +0.0/10.0
- DSCR +0.0/10.0
$349,000
🖨 Deal sheet (PDF) 📄 Offer letter ✓ Due diligence
Listing remarks MLS
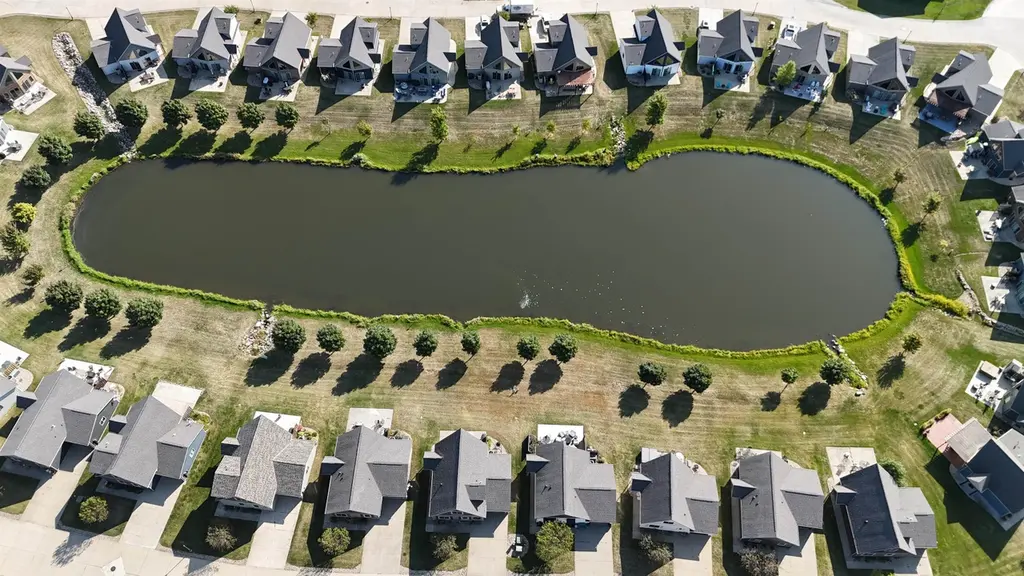
Enjoy resort living at its best in this 2-bedroom, 2-bath Bridges Bay cabin perfectly positioned on the pond with peaceful water views right from your living space. Vaulted ceilings with extra windows in the vault flood the cabin with natural light, creating an open, airy feel you don’t usually get in these units. Step outside and you’re just moments from everything Bridges Bay is known for: indoor and outdoor water parks, fitness center, arcade, docks, Waterfront Grill, and Bracco’s—all within easy walking distance. Whether you’re looking for a turn-key rental or a fun family escape, this pond-front location sets it apart from the rest.
Key facts
- Fitness center
- Peaceful water views
- Pond front location
Tags
Neighborhood map
What this means for you Summary
Snapshot
- This is a 2-bed/2.0-bath condo listed at $349k.
Deal economics
- At list price, monthly cash flow is $-2k ($-27k/yr) — negative.
- To cash-flow at today's rent, offer at most $25k (92.9% below list).
- To meet the 1% rule (rent ≥ 1% of price), the offer needs to be $87k (75.0% below list).
- Recommended offer: $25k (92.9% below list) — sets the bar for cash-flow.
Location & tenants
- Location reads 78/100 on livability (#140 in IA, #2,548 nationally) — a middle-class / working-renter tenant base. Strengths: crime A+, housing A+, health & safety A; Watch: amenities F, commute F.
- Okoboji Community School District (town): math 78% / reading 80% proficiency, ranked #40 of 289 in IA (top 14%) — strong family-tenant draw, lease renewals of 3-5y typical.
- Zoned schools: Okoboji Elementary School (math 82% / reading 67%, grade A, #131 of 616 statewide, top 27%, 533 students, 40% FRL); Okoboji Middle School (math 83% / reading 82%, grade A+, #16 of 246 statewide, top 8%, 346 students, 36% FRL); Okoboji High School (math 68% / reading 85%, grade A-, #73 of 336 statewide, top 22%, 365 students, 37% FRL).
- Market conditions: 81 active listings in the ZIP; 295 units permitted in Dickinson County in 2024 (16 in 5+ unit buildings).
Forward outlook
- In year one you build about $37k of equity ($2k loan paydown + $35k appreciation (10.0% local appreciation)).
- Dickinson County population projected at +12% by 2050 — modest demand growth; plan on rents tracking national, not racing it.
- By year 2, paydown + projected appreciation supports a ~$60k cash-out refi (75% LTV) — recoverable capital for the next deal without selling this one.
Negotiation context
- It's been on market 118 days — a 9% lower offer ($318k) is reasonable based on typical stale-listing flexibility.
Risks & watch-outs
- Watch-outs: HOA is 59% of rent.
- Climate carrying-cost: moderate wildfire risk — expect insurance premiums to compound above CPI over the hold.
Questions for the listing agent
- What do current leases actually rent for vs. the listed asking? Can we see a recent rent roll and the last 12 months of T-12 income?
- It's been on market 118 days. Have you received any prior offers? Is the seller open to a 93% concession, seller financing, or rate buy-down credit?
- What does the HOA fee cover, when was the last increase, and are there any pending special assessments or reserve-fund shortfalls?
- Any open or pending special assessments — roof, HVAC, plumbing, elevator, façade? What's the per-unit balance and payoff schedule, and is the seller paying it off at close or rolling it to the buyer?
- Why hasn't it sold? Are there any deal-killer items the seller is aware of (foundation, flood, title, zoning, code violations)?
- Is there a deadline driving the sale (1031 exchange, divorce, estate, relocation)? That informs how much negotiation room exists.
- Schools are A-rated — typically a magnet for longer-tenancy family renters. What's the average tenant stay here, and is there a school-zone premium baked into asking?
- The area grade is low — what's the realistic commute time and amenity access for the typical tenant pool here? Any planned neighborhood developments (good or bad) we should know about?
- What's the average days-on-market for RENTAL listings here right now (not sales)? A rising rental-DOM trend means longer vacancies and softer asking-rent achievability than the comps imply.
- What's the recent tenant-quality profile in this submarket — average credit score on applications, eviction rate, late-payment / NSF rate, and stable-employment percentage? A property-management company in the area should have these aggregated.
- How much new apartment / multifamily construction is in the pipeline within 1–3 miles? Heavy new supply (>2% of stock underway) typically softens rents 12–24 months out; light construction supports rent growth.
Investment metrics
- 1% rule
- 0.25% ✗
- Cap rate
- -1.41%
- Cash-on-cash
- -27.52%
- DSCR
- -0.22
- GRM
- 33.3
CMA / ARV
- ARV (median comp)
- $463,848
- List price
- $349,000
- Delta
- -24.76%
- Verdict
- UNDERPRICED
- Comps
- 2 within 1.0 mi
Projected returns pro-forma
10.0% appreciation · 3.0% rent growth · sell at horizon
- IRR
- 5.7%
- Equity multiple
- 1.49×
- Total profit
- $47,660
- Equity at exit
- $314,407
- IRR
- 8.5%
- Equity multiple
- 3.59×
- Total profit
- $253,269
- Equity at exit
- $678,030
Cash invested: $97,720 (down + closing). Projections, not guarantees.
Landlord ↔ Tenant lean methodology
- Overall (STATE)
- 83 Strongly Landlord-Friendly
- State Iowa
- 83 Strongly Landlord-Friendly · R+6
- County
- — inherits STATE
- City
- — inherits STATE
ZIP-level market 51331
- Home prices YoY
- 10.3%
- Active inventory
- 81
- Price-to-rent
- 33.3×
Monthly cashflow live
- Estimated rent
- $874 medium interval (Pro) →
- Mortgage (P&I)
- −$1,830
- Tax est. 1.5%
- −$436 /mo · $5,235/yr
- Insurance
- −$145
- HOA
- −$520
- Vacancy / Maint / Mgmt
- −$184
- Net cashflow
- $-2,241
Break-even live
Sensitivity live
| Price | -10% $-2,000 | -5% $-2,121 | +0% $-2,241 | +5% $-2,362 | +10% $-2,482 |
|---|---|---|---|---|---|
| Rent | -10% $-2,310 | -5% $-2,276 | +0% $-2,241 | +5% $-2,207 | +10% $-2,172 |
| Rate | -1.0pp $-2,066 | -0.5pp $-2,152 | base $-2,241 | +0.5pp $-2,332 | +1.0pp $-2,424 |
UW: 25.0% down · 7.5% · 30yr · 1.5% tax · 5.0% vac · 8.0% maint · 8.0% mgmt
Financing live
Cash to close
- Down payment
- $87,250
- Closing costs
- $10,470
- Reserves months
- —
- Total cash needed
- —
Loan-product check · same deal, 3 products live
Conventional
25% down · 7.5% · 30yr
- Down + closing
- —
- Monthly P&I
- —
- Monthly cashflow
- —
- DSCR
- —
- Eligible?
- —
Personal DTI + credit; lowest rate.
DSCR
20% down · 8.5% · 30yr
- Down + closing
- —
- Monthly P&I
- —
- Monthly cashflow
- —
- DSCR
- —
- Eligible?
- —
No personal income docs; deal must DSCR.
Hard money
10% down · 12.0% · 12mo
- Down + closing
- —
- Monthly P&I
- —
- Monthly cashflow
- —
- DSCR
- —
- Eligible?
- —
Short-term bridge; refi at stabilization.
HOA detail condo
- Monthly dues
- $520 · $6,240/yr
- Likely covers
- watergym
- Assessments
- None detected in remarks — confirm with the listing agent.
Listing history 15 events
-
2026-06-17status $349,000 Pending 118 DOM
-
2026-06-16days on market $349,000 Active 118 DOM
-
2026-06-15days on market $349,000 Active 117 DOM
-
2026-06-13days on market $349,000 Active 115 DOM
-
2026-06-12days on market $349,000 Active 114 DOM
-
2026-06-09days on market $349,000 Active 111 DOM
-
2026-06-08days on market $349,000 Active 110 DOM
-
2026-06-07days on market $349,000 Active 109 DOM
-
2026-06-07days on market $349,000 Active 108 DOM
-
2026-06-04days on market $349,000 Active 105 DOM
-
2026-06-02days on market $349,000 Active 104 DOM
-
2026-06-01days on market $349,000 Active 103 DOM
-
2026-05-31days on market $349,000 Active 102 DOM
-
2026-05-31days on market $349,000 Active 101 DOM
-
2026-02-18$349,000 Active 675-char remark
Show marketing remark (675 chars)
Enjoy resort living at its best in this 2-bedroom, 2-bath Bridges Bay cabin perfectly positioned on the pond with peaceful water views right from your living space. Vaulted ceilings with extra windows in the vault flood the cabin with natural light, creating an open, airy feel you don’t usually get in these units. Step outside and you’re just moments from everything Bridges Bay is known for: indoor and outdoor water parks, fitness center, arcade, docks, Waterfront Grill, and Bracco’s—all within easy walking distance. Whether you’re looking for a turn-key rental or a fun family escape, this pond-front location sets it apart from the rest.
ⓘ Source: listings_history table (triggers on properties + properties_extension) + one-shot
backfill from property_details.listing_events for pre-trigger history.
Climate risk First Street
- Flood 1/10 Low FEMA zone X (unshaded) · 0% chance over 30 yrs
- Wildfire 5/10 Major
- Heat 2/10 Low 7 d/yr ≥98°F today · 16 d/yr by 30 yrs out
- Wind 2/10 Low
- Air quality 1/10 Low 0 unhealthy d/yr today · 0 by 30 yrs out
Nearby sold comps map
Loading sold comps map…
Walkable amenities ~0.75 mi
Loading nearby amenities…
Taxation est. · year 1
- Rental income
- $10,490
- − Mortgage interest
- −$19,549
- − Property taxes
- −$5,235
- − Insurance
- −$1,745
- − Repairs & maintenance
- −$839
- − Management
- −$839
- − HOA
- −$6,240
- − Depreciation
- −$10,153
- Taxable loss
- −$34,110
- Est. tax savings @ 24.0%
- +$8,187
- After-tax cash flow
- $-18,709/yr
For passive investors: Depreciation is non-cash, so a rental often shows a tax loss while cash-flowing — sheltering income. Rental losses are passive: they offset passive income freely, and up to $25,000/yr can offset ordinary (W-2) income if you actively participate and your MAGI is under $100k (phasing out to $0 by $150k); unused losses carry forward. On sale, claimed depreciation is recaptured at up to 25%, and gains may owe capital-gains tax (a 1031 exchange can defer both). Figures are a year-1 estimate at your 24.0% rate — not tax advice; consult a CPA.
Schools (NCES district)
- District
- Okoboji Community School District
- NCES district ID
- 1900021
- Math proficiency
- 78% ▲ 8.00%
- Reading proficiency
- 80% ▲ 6.00%
- Median HH income
- $50,522
- Composite
- 66.88/100
- National rank
- #403
- State rank
- #40 of 289 in IA
Livability — Arnolds Park
- Score
- 78/100
- State rank
- #140
- US rank
- #2548
Category grades
Schools grade is shown separately in the Schools card above.
Census & demographics
- Census place
- Arnolds Park, IA
- City population
- 920
- Population (ZIP)
- 920
Population outlook (Dickinson County) Hauer SSP2
- Today (2025)
- 18,133 people
- By 2030
- 18,610 · +2.6%
- By 2040
- 19,456 · +7.3%
- By 2050
- 20,307 · +12.0%
- By 2075
- 23,155 · +27.7%
- By 2100
- 24,449 · +34.8%
Race, ethnicity, and origin ACS 2023
- Neighborhood character
- Predominantly White (98%)
- Race & ethnicity
- White 98% Two or more races 1%
- Common ancestry
- Portuguese 8% Slovak 3% Iranian 3%
- Foreign-born
- 1%
- Languages at home
- 99% English-only · Other Indo-European 1%
Political lean MEDSL · Dickinson
- 2024 margin
- Solid R (+40.0) · D 29.5% · R 69.5% · Other 1.1%
- 2008→2024 swing
- -34.6pp toward R · 2008: -5.4pp · 2024: -40.0pp
- All cycles
- 2024: R+40.0 2020: R+33.6 2016: R+36.0 2012: R+18.0 2008: R+5.4
Not yet ingested
- Civics
- —
Market trends
- HPI YoY
- ▲ 19.42%
- Current HPI
- 207.79
- Rent YoY
- —
- Metro
- —
- State GDP YoY
- ▲ 2.48%
- F500 in state
- 4
Industry mix (Fortune 500 HQ in IA)
| Industry | F500 HQs | Revenue |
|---|---|---|
| Financial Services | 1 | $16B |
|
||
| Retail / Convenience | 1 | $15B |
|
||
Price history
1 event — show timeline
- 2026-02-18 Listed $349,000 Iowa Great Lakes BOR
Cash-flow waterfall
monthlySold comps — $/sqft
last 12 mo · ≤1 miLoading sold comps…