636 98th Ave N · Naples Park, FL
Flood risk 4/10 · Minor
- FEMA flood zone
- X (unshaded)
- Chance of flooding over 30 yrs
- 0.22%
- Est. flood insurance / yr
- $507 – $1,088
Fire risk 1/10 · Minimal
- Est. fire insurance / yr
- $947 – $1,759
Heat risk 10/10 · Severe
- Hot days now (above 107°F)
- 7 days/yr
- Hot days in 30 yrs
- 30 days/yr
Wind risk 10/10 · Severe
- Chance of severe wind over 30 yrs
- 99.0%
Air-quality risk 2/10 · Minimal
- Unhealthy air days now
- 1 days/yr
- Unhealthy air days in 30 yrs
- 1 days/yr
Risk factors via First Street. Map © Google.
Why this score? — see what drove the D grade
The composite is a weighted blend of 9 inputs, each scored 0–100. Each bar is that input's sub-score; the figure is the points it added to the 100-point composite (weight × sub-score).
- Cash flow +13.0/30.0
- ARV discount +7.5/15.0
- Schools +5.0/10.0
- Rent growth +4.7/5.0
- DSCR +3.9/10.0
- Livability +3.2/5.0
- 1% rule +2.9/10.0
- Condition / age +2.5/5.0
- Appreciation +0.0/10.0
$769,000
🖨 Deal sheet (PDF) 📄 Offer letter ✓ Due diligence
Listing remarks MLS
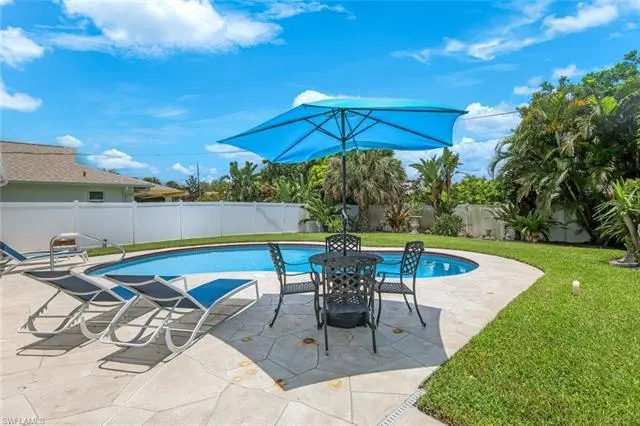
* New Roof ~ around 2019/2020 * New Water Pipes through out the house (2021) * New HVAC System (2021) * Hurricane Impacted Windows Beautiful 3 bedroom, 2 baths and 1 car garage with a pool with and a beautiful fenced yard! Tile through the house. Location is great! Close to Gulf of Mexico and lots of wonderful shopping plazas and restaurants.
Key facts
- No hoa fees
- Short-term rentals
- Renovated pool home
Tags
Property features AI
Finance
- HOA & community: No HOA maintenance or community amenities; Non-gated community
Exterior
- Parking: Attached 1-car garage; Paved driveway
- Security: Security system; Entry keypad; Impact-resistant doors and windows
- Utilities: Central water; Central sewer; Cable available
- Home design: Single-family home; 1 story / ranch; South rear exposure; Residential property
- Construction: Concrete block construction; Stucco exterior; Shingle roof; Built in 1973
- Exterior features: Private below-ground concrete pool (equipment stays); Fence / completely fenced yard; Patio; Sprinkler (automatic); Landscaped view
Interior
- Kitchen: Pantry; Dishwasher; Microwave; Range; Refrigerator; Eat-in kitchen / dining (family)
- Bedrooms: 3 bedrooms (split bedroom floor plan)
- Flooring: Tile flooring
- Bathrooms: 2 full bathrooms; Master bathroom with tub and shower combo
- Heating & cooling: Central electric heat; Central electric cooling
- Interior features: Cable prewire; High-speed internet available; Pantry; Smoke detectors; Window coverings; Open porch/lanai; Family room; Turnkey furnished
- Laundry & utility: Washer; Dryer; Laundry located in garage; Auto garage door
Neighborhood map
What this means for you Summary
Snapshot
- This is a 3-bed/2.0-bath single-family listed at $769k.
Deal economics
- At list price, monthly cash flow is $-42 ($-508/yr) — negative.
- To cash-flow at today's rent, offer at most $762k (1.0% below list).
- To meet the 1% rule (rent ≥ 1% of price), the offer needs to be $605k (21.3% below list).
- Recommended offer: $605k (21.3% below list) — sets the bar for 1% rule.
Location & tenants
- Location reads 64/100 on livability (#696 in FL) — a middle-class / working-renter tenant base. Strengths: crime A+, housing A-, employment B+; Watch: health & safety D, amenities F, commute F.
- Collier (suburban): math 60% / reading 56% proficiency, ranked #16 of 73 in FL (top 22%) — acceptable for families but not a draw, mixed tenant base, ~2y average lease.
- Zoned schools: Naples Park Elementary School (math 67% / reading 57%, grade B, #608 of 2,144 statewide, top 29%, 395 students, 48% FRL); Pine Ridge Middle School (math 74% / reading 70%, grade A, #52 of 571 statewide, top 10%, 832 students, 31% FRL); Barron Collier High School (math 62% / reading 68%, grade B, #76 of 667 statewide, top 11%, 1,650 students, 26% FRL) — zoned schools average 35% FRL vs 55% district-wide (20 pts lower); this property's tenant base skews higher-income than the district average.
- Market conditions: Rents rising fast (+8.7%/yr); 684 active listings in the ZIP; 40 comparable units currently listed for rent nearby; rentals at typical pace (median 25d on market — plan ~3-4 weeks tenant-placement turnaround); high-income renter base; 3,520 units permitted in Collier County in 2024 (959 in 5+ unit buildings).
- At $6,051/mo this rent would consume 61% of the median local household income ($119k/yr) (locally 237% of renters already pay >50% of income on rent) — very limited rent-growth headroom before tenants either downsize or default.
Forward outlook
- Local home prices are declining (-3.0%/yr); year-one equity from $5k of loan paydown is wiped out by about $23k of value loss. Plan a longer hold.
- Collier County population projected at +30% by 2050 — long-run rental-demand tailwind backs the buy-and-hold thesis.
Negotiation context
- It's been on market 370 days — a 12% lower offer ($677k) is reasonable based on typical stale-listing flexibility.
- 4 sale attempts since 4y ago with the ask held roughly flat each time — persistent listings suggest the price (not the market) is what's stuck; bring a comps-based counter.
Risks & watch-outs
- Climate carrying-cost: severe wind risk, 99% chance of damaging wind over 30y; extreme-heat days projected 7→30/yr by 2055 (HVAC capex compounding) — expect insurance premiums to compound above CPI over the hold.
Questions for the listing agent
- What do current leases actually rent for vs. the listed asking? Can we see a recent rent roll and the last 12 months of T-12 income?
- It's been on market 370 days. Have you received any prior offers? Is the seller open to a 21% concession, seller financing, or rate buy-down credit?
- Built in 1973 — when were the roof, HVAC, electrical panel, plumbing, and water heater last replaced?
- Why hasn't it sold? Are there any deal-killer items the seller is aware of (foundation, flood, title, zoning, code violations)?
- Is there a deadline driving the sale (1031 exchange, divorce, estate, relocation)? That informs how much negotiation room exists.
- Schools are F-rated, which usually means shorter tenancies and higher turnover. Who's the typical renter profile here, and what's been the actual vacancy rate?
- The area grade is low — what's the realistic commute time and amenity access for the typical tenant pool here? Any planned neighborhood developments (good or bad) we should know about?
- What's the average days-on-market for RENTAL listings here right now (not sales)? A rising rental-DOM trend means longer vacancies and softer asking-rent achievability than the comps imply.
- What's the recent tenant-quality profile in this submarket — average credit score on applications, eviction rate, late-payment / NSF rate, and stable-employment percentage? A property-management company in the area should have these aggregated.
- How much new for-sale + rental construction is in the pipeline within 1–3 miles? Heavy new supply typically softens prices + rents 12–24 months out; constrained supply supports both.
Investment metrics
- 1% rule
- 0.79% ✗
- Cap rate
- 6.23%
- Cash-on-cash
- -0.24%
- DSCR
- 0.99
- GRM
- 10.6
CMA / ARV
No comps found within radius.
Projected returns pro-forma
-3.0% appreciation · 8.0% rent growth · sell at horizon
- IRR
- -11.7%
- Equity multiple
- 0.56×
- Total profit
- $-95,543
- Equity at exit
- $114,660
- IRR
- 3.1%
- Equity multiple
- 1.27×
- Total profit
- $58,009
- Equity at exit
- $66,489
Cash invested: $215,320 (down + closing). Projections, not guarantees.
Landlord ↔ Tenant lean methodology
- Overall (STATE)
- 87 Strongly Landlord-Friendly
- State Florida
- 87 Strongly Landlord-Friendly · R+3
- County
- — inherits STATE
- City
- — inherits STATE
ZIP-level market 34108
- Rents YoY
- 8.7%
- Active inventory
- 684
- Price-to-rent
- 10.6×
Monthly cashflow live
- Estimated rent
- $6,051 high interval (Pro) →
- Mortgage (P&I)
- −$4,033
- Tax from tax record
- −$469 /mo · $5,631/yr
- Insurance
- −$320
- HOA
- −$0
- Vacancy / Maint / Mgmt
- −$1,271
- Net cashflow
- $-42
Break-even live
Sensitivity live
| Price | -10% $393 | -5% $175 | +0% $-42 | +5% $-260 | +10% $-478 |
|---|---|---|---|---|---|
| Rent | -10% $-520 | -5% $-281 | +0% $-42 | +5% $197 | +10% $436 |
| Rate | -1.0pp $345 | -0.5pp $153 | base $-42 | +0.5pp $-242 | +1.0pp $-444 |
UW: 25.0% down · 7.5% · 30yr · 1.5% tax · 5.0% vac · 8.0% maint · 8.0% mgmt
Financing live
Cash to close
- Down payment
- $192,250
- Closing costs
- $23,070
- Reserves months
- —
- Total cash needed
- —
Loan-product check · same deal, 3 products live
Conventional
25% down · 7.5% · 30yr
- Down + closing
- —
- Monthly P&I
- —
- Monthly cashflow
- —
- DSCR
- —
- Eligible?
- —
Personal DTI + credit; lowest rate.
DSCR
20% down · 8.5% · 30yr
- Down + closing
- —
- Monthly P&I
- —
- Monthly cashflow
- —
- DSCR
- —
- Eligible?
- —
No personal income docs; deal must DSCR.
Hard money
10% down · 12.0% · 12mo
- Down + closing
- —
- Monthly P&I
- —
- Monthly cashflow
- —
- DSCR
- —
- Eligible?
- —
Short-term bridge; refi at stabilization.
Rent comps 40 comps
| Address | Beds | Baths | Sqft | Rent | $/sqft | DOM | Units | Dist |
|---|---|---|---|---|---|---|---|---|
| 625 97th Ave N Naples, FL | 3.0 | 2.0 | 1496 | $3,800 | $2.54 | 25d | 1 | 0.01mi |
| 668 97th Ave N Unit A Naples, FL | 2.0 | 1.0 | 775 | $4,500 | $5.81 | 25d | 1 | 0.09mi |
| 645 95th Ave N Unit 1 Naples, FL | 3.0 | 2.0 | 957 | $2,750 | $2.87 | 15d | 1 | 0.13mi |
| 630 95th Ave N Unit S Naples, FL | 3.0 | 2.0 | 1411 | $5,500 | $3.90 | 25d | 1 | 0.16mi |
| 630 95th Ave N Unit A Naples, FL | 3.0 | 2.0 | 1411 | $2,995 | $2.12 | 25d | 1 | 0.16mi |
| 663 100th Ave N Naples, FL | 2.0 | 1.0 | 1000 | $2,650 | $2.65 | 25d | 1 | 0.20mi |
| 671 100th Ave N Naples, FL | 3.0 | 2.0 | 1164 | $5,500 | $4.73 | 25d | 1 | 0.21mi |
| 671 94th Ave N Naples, FL | 3.0 | 2.0 | 1464 | $6,800 | $4.64 | 25d | 1 | 0.21mi |
| 534 96th Ave N Naples, FL | 3.0 | 2.0 | 1198 | $8,500 | $7.10 | 25d | 1 | 0.26mi |
| 717 95th Ave N Unit 1 Naples, FL | 2.0 | 1.0 | 1500 | $2,100 | $1.40 | 25d | 1 | 0.26mi |
| 595 93rd Ave N Naples, FL | 2.0 | 2.0 | 1374 | $5,000 | $3.64 | 25d | 1 | 0.26mi |
| 531 99th Ave N Naples, FL | 2.0 | 1.0 | 794 | $2,000 | $2.52 | 25d | 1 | 0.28mi |
| 517 98th Ave N Naples, FL | 3.0 | 2.0 | 1350 | $4,750 | $3.52 | 25d | 1 | 0.28mi |
| 650 93rd Ave N Unit 1073498P Naples, FL | 3.0 | 2.0 | 1442 | $5,136 | $3.56 | 15d | 1 | 0.29mi |
| 604 102nd Ave N Naples, FL | 3.0 | 2.0 | 1197 | $3,150 | $2.63 | 15d | 1 | 0.29mi |
| 536 101st Ave N Naples, FL | 3.0 | 1.0 | 1016 | $2,500 | $2.46 | 15d | 1 | 0.32mi |
| 547 101st Ave N Naples, FL | 2.0 | 1.0 | 768 | $2,750 | $3.58 | 25d | 1 | 0.32mi |
| 691 102nd Ave N Naples, FL | 3.0 | 2.0 | 1311 | $7,000 | $5.34 | 25d | 1 | 0.34mi |
| 650 103rd Ave N Naples, FL | 3.0 | 2.0 | 1025 | $2,700 | $2.63 | 25d | 1 | 0.34mi |
| 757 95th Ave N Naples, FL | 2.0 | 2.0 | 1100 | $2,150 | $1.95 | 25d | 1 | 0.34mi |
| 751 100th Ave N Naples, FL | 2.0 | 1.0 | 912 | $4,000 | $4.39 | 25d | 1 | 0.35mi |
| 757 101st Ave N Naples, FL | 3.0 | 2.0 | 1366 | $3,900 | $2.86 | 25d | 1 | 0.40mi |
| 522 Beachwalk Cir Naples, FL | 2.0 | 2.0 | 1359 | $6,000 | $4.42 | 25d | 1 | 0.41mi |
| 521 102nd Ave N Naples, FL | 3.0 | 2.0 | 1432 | $5,000 | $3.49 | 15d | 1 | 0.41mi |
| 532 103rd Ave N Naples, FL | 3.0 | 2.0 | 1326 | $8,000 | $6.03 | 25d | 1 | 0.42mi |
| 791 94th Ave N Naples, FL | 3.0 | 2.0 | 1400 | $9,000 | $6.43 | 25d | 1 | 0.44mi |
| 857 Reef Point Cir Naples, FL | 2.0 | 2.0 | 1359 | $7,500 | $5.52 | 25d | 1 | 0.45mi |
| 559 Beachwalk Cir Unit U204 Naples, FL | 3.0 | 2.0 | 1472 | $7,500 | $5.10 | 15d | 1 | 0.45mi |
| 559 Beachwalk Cir Apt 203U Naples, FL | 2.0 | 2.0 | 1350 | $7,000 | $5.19 | 15d | 1 | 0.45mi |
| 549 Beachwalk Cir Naples, FL | 2.0 | 2.0 | 1359 | $7,500 | $5.52 | 25d | 1 | 0.45mi |
| 565 Beachwalk Cir Unit T-102 Naples, FL | 2.0 | 2.0 | 1350 | $7,300 | $5.41 | 15d | 1 | 0.45mi |
| 565 Beachwalk Cir Unit T104 Naples, FL | 3.0 | 2.0 | 1450 | $6,750 | $4.66 | 15d | 1 | 0.45mi |
| 577 Beachwalk Cir Unit R202 Naples, FL | 2.0 | 2.0 | 1350 | $5,000 | $3.70 | 15d | 1 | 0.45mi |
| 661 Windsurf Ln Unit A-202 Naples, FL | 2.0 | 2.0 | 1350 | $7,500 | $5.56 | 15d | 1 | 0.46mi |
| 829 Reef Point Cir Unit 46 Naples, FL | 2.0 | 2.0 | 1359 | $7,500 | $5.52 | 25d | 1 | 0.47mi |
| 10022 8th St N Unit B Naples, FL | 2.0 | 2.0 | 1249 | $2,225 | $1.78 | 15d | 1 | 0.48mi |
| 10022 8th St N Unit 22 Naples, FL | 2.0 | 2.0 | 1250 | $2,250 | $1.80 | 25d | 1 | 0.48mi |
| 749 91st Ave N Naples, FL | 3.0 | 3.0 | 1417 | $3,750 | $2.65 | 15d | 1 | 0.48mi |
| 589 Beachwalk Cir Unit P-203 Naples, FL | 2.0 | 2.0 | 1350 | $8,000 | $5.93 | 15d | 1 | 0.48mi |
| 613 Beachwalk Cir Unit J Naples, FL | 2.0 | 2.0 | 1350 | $7,500 | $5.56 | 15d | 1 | 0.48mi |
Listing history 31 events
-
2026-06-22pricedays on market $769,000 Active 370 DOM
-
2026-06-18days on market $789,000 Active 367 DOM
-
2026-06-17days on market $789,000 Active 366 DOM
-
2026-06-16days on market $789,000 Active 365 DOM
-
2026-06-15days on market $789,000 Active 364 DOM
-
2026-06-10days on market $789,000 Active 359 DOM
-
2026-06-09days on market $789,000 Active 358 DOM
-
2026-06-08days on market $789,000 Active 357 DOM
-
2026-06-07days on market $789,000 Active 356 DOM
-
2026-06-02days on market $789,000 Active 351 DOM
-
2026-06-01days on market $789,000 Active 350 DOM
-
2026-05-31days on market $789,000 Active 349 DOM
-
2026-05-30days on market $789,000 Active 348 DOM
-
2025-12-31price $789,000
-
2025-06-16$799,000 Active
-
2025-03-14historical
-
2025-02-04price $819,000
-
2024-11-20price $839,000
-
2024-10-14price $898,000
-
2024-08-28status Active
-
2024-08-19historical
-
2024-06-20price $919,000
-
2024-04-05$949,000 Active
-
2022-06-13soldstatus $875,000
-
2022-06-07soldstatus $875,000 Sold 353-char remark
Show marketing remark (353 chars)
* New Roof ~ around 2019/2020 * New Water Pipes through out the house (2021) * New HVAC System (2021) * Hurricane Impacted Windows Beautiful 3 bedroom, 2 baths and 1 car garage with a pool with and a beautiful fenced yard! Tile through the house. Location is great! Close to Gulf of Mexico and lots of wonderful shopping plazas and restaurants.
-
2022-05-15status Pending 353-char remark
Show marketing remark (353 chars)
* New Roof ~ around 2019/2020 * New Water Pipes through out the house (2021) * New HVAC System (2021) * Hurricane Impacted Windows Beautiful 3 bedroom, 2 baths and 1 car garage with a pool with and a beautiful fenced yard! Tile through the house. Location is great! Close to Gulf of Mexico and lots of wonderful shopping plazas and restaurants.
-
2022-05-11$875,000 Active 353-char remark
Show marketing remark (353 chars)
* New Roof ~ around 2019/2020 * New Water Pipes through out the house (2021) * New HVAC System (2021) * Hurricane Impacted Windows Beautiful 3 bedroom, 2 baths and 1 car garage with a pool with and a beautiful fenced yard! Tile through the house. Location is great! Close to Gulf of Mexico and lots of wonderful shopping plazas and restaurants.
-
2003-07-31soldstatus $233,000
-
2003-04-02soldstatus $187,500
-
2000-05-17soldstatus $140,000
-
1989-04-01soldstatus $77,300
ⓘ Source: listings_history table (triggers on properties + properties_extension) + one-shot
backfill from property_details.listing_events for pre-trigger history.
Tax reassessment forecast FL · Resets to sale price
- Current annual tax
- $5,631 · $469/mo
- Projected year-2 tax
- $6,383 · $532/mo
- Expected delta
- +$752/yr (+$63/mo · 13.4%)
ⓘ Screening estimate from a state-policy table — verify with the county assessor before closing.
Climate risk First Street
- Flood 4/10 Moderate FEMA zone X (unshaded) · 22% chance over 30 yrs
- Wildfire 1/10 Low
- Heat 10/10 Extreme 7 d/yr ≥107°F today · 30 d/yr by 30 yrs out
- Wind 10/10 Extreme 99% chance of damaging wind over 30 yrs
- Air quality 2/10 Low 1 unhealthy d/yr today · 1 by 30 yrs out
Nearby sold comps map
Loading sold comps map…
Walkable amenities ~0.75 mi
Loading nearby amenities…
Taxation est. · year 1
- Rental income
- $72,608
- − Mortgage interest
- −$43,076
- − Property taxes
- −$5,631
- − Insurance
- −$3,845
- − Repairs & maintenance
- −$5,809
- − Management
- −$5,809
- − Depreciation
- −$22,371
- Taxable loss
- −$13,932
- Est. tax savings @ 24.0%
- +$3,344
- After-tax cash flow
- $2,835/yr
For passive investors: Depreciation is non-cash, so a rental often shows a tax loss while cash-flowing — sheltering income. Rental losses are passive: they offset passive income freely, and up to $25,000/yr can offset ordinary (W-2) income if you actively participate and your MAGI is under $100k (phasing out to $0 by $150k); unused losses carry forward. On sale, claimed depreciation is recaptured at up to 25%, and gains may owe capital-gains tax (a 1031 exchange can defer both). Figures are a year-1 estimate at your 24.0% rate — not tax advice; consult a CPA.
Schools (NCES district)
- District
- Collier
- NCES district ID
- 1200330
- Math proficiency
- 60% ▼ -4.00%
- Reading proficiency
- 56% ▼ -2.00%
- Median HH income
- $58,275
- Composite
- 50.23/100
- National rank
- #1892
- State rank
- #16 of 73 in FL
Livability — Naples Park
- Score
- 64/100
- State rank
- #696
- US rank
- #14564
Category grades
Schools grade is shown separately in the Schools card above.
Census & demographics
- Census place
- Naples Park, FL
- County
- Collier County · 396,295 people
- Metro
- Naples-Marco Island, FL
- Population (ZIP)
- 16,237
- Household income
- $119,212
- Rent vs Own
- Severe rent burden
- 237.0
Population outlook (Collier County) Hauer SSP2
- Today (2025)
- 420,858 people
- By 2030
- 450,054 · +6.9%
- By 2040
- 502,232 · +19.3%
- By 2050
- 544,932 · +29.5%
- By 2075
- 627,203 · +49.0%
- By 2100
- 659,015 · +56.6%
Race, ethnicity, and origin ACS 2023
- Neighborhood character
- Predominantly White (87%)
- Race & ethnicity
- White 87% Hispanic / Latino 8% Two or more races 7% Asian 1% Black 1%
- Hispanic origin (detail)
- Mexican 2% Cuban 3%
- Common ancestry
- Romanian 5% Lithuanian 3% Slovak 3%
- Foreign-born
- 16% · Canada, Dominican Republic, South Korea
- Languages at home
- 86% English-only · Spanish 6% Russian/Polish/Slavic 2% Other Indo-European 2%
Political lean MEDSL · Collier
- 2024 margin
- Solid R (+33.1) · D 33.1% · R 66.2%
- 2008→2024 swing
- -10.6pp toward R · 2008: -22.5pp · 2024: -33.1pp
- All cycles
- 2024: R+33.1 2020: R+24.7 2016: R+26.0 2012: R+30.1 2008: R+22.5
Not yet ingested
- Civics
- —
Market trends
- HPI YoY
- ▼ -587.97%
- Current HPI
- 275.1872
- Rent YoY
- ▲ 8.74%
- Metro
- Naples-Marco Island, FL
- State GDP YoY
- ▲ 3.28%
- F500 in state
- 36
Industry mix (Fortune 500 HQ in FL)
| Industry | F500 HQs | Revenue |
|---|---|---|
| Industrial Technology | 2 | $29B |
|
||
| Insurance | 2 | $17B |
|
||
| Retail | 1 | $60B |
|
||
| Technology Distribution | 1 | $58B |
|
||
| Homebuilding | 1 | $35B |
|
||
| Technology Manufacturing | 1 | $35B |
|
||
Price history
+920.7% since first listed18 events — show timeline
- 2025-12-31 Price Changed $789,000 NAPLESMLS
- 2025-06-16 Listed $799,000 NAPLESMLS
- 2025-03-14 Listing Removed — NAPLESMLS
- 2025-02-04 Price Changed $819,000 NAPLESMLS
- 2024-11-20 Price Changed $839,000 NAPLESMLS
- 2024-10-14 Price Changed $898,000 NAPLESMLS
- 2024-08-28 Relisted — NAPLESMLS
- 2024-08-19 Listing Removed — NAPLESMLS
- 2024-06-20 Price Changed $919,000 NAPLESMLS
- 2024-04-05 Listed $949,000 NAPLESMLS
- 2022-06-13 Sold (Public Records) $875,000 Public Records
- 2022-06-07 Sold (MLS) $875,000 NAPLESMLS
- 2022-05-15 Pending — NAPLESMLS
- 2022-05-11 Listed $875,000 NAPLESMLS
- 2003-07-31 Sold (Public Records) $233,000 Public Records
- 2003-04-02 Sold (Public Records) $187,500 Public Records
- 2000-05-17 Sold (Public Records) $140,000 Public Records
- 1989-04-01 Sold (Public Records) $77,300 Public Records
Property tax history
+9.3%/yrLatest (2025): $5,631 · -9.5% YoY. Source: county tax records.
Cash-flow waterfall
monthlySold comps — $/sqft
last 12 mo · ≤1 miLoading sold comps…