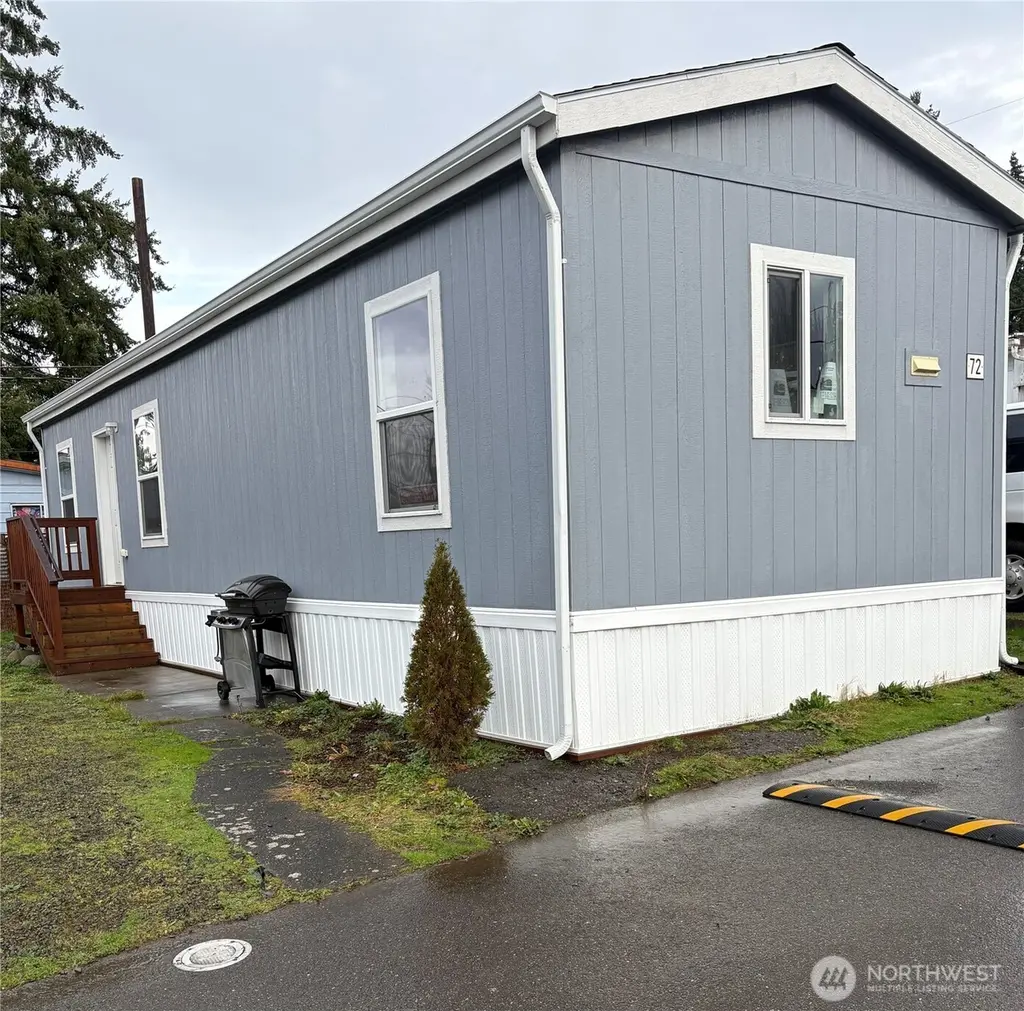
4024 NW Country Ln #72 · Kitsap Lake, WA
Flood risk 1/10 · Minimal
- FEMA flood zone
- X (unshaded)
- Chance of flooding over 30 yrs
- 0.0%
- Est. flood insurance / yr
- $507 – $1,088
Fire risk 2/10 · Minimal
- Est. fire insurance / yr
- $604 – $1,122
Heat risk 3/10 · Minor
- Hot days now (above 86°F)
- 7 days/yr
- Hot days in 30 yrs
- 16 days/yr
Wind risk 1/10 · Minimal
- Chance of severe wind over 30 yrs
- —
Air-quality risk 7/10 · Major
- Unhealthy air days now
- 10 days/yr
- Unhealthy air days in 30 yrs
- 10 days/yr
Risk factors via First Street. Map © Google.
Why this score? — see what drove the B grade
The composite is a weighted blend of 9 inputs, each scored 0–100. Each bar is that input's sub-score; the figure is the points it added to the 100-point composite (weight × sub-score).
- Cash flow +30.0/30.0
- 1% rule +10.0/10.0
- DSCR +10.0/10.0
- ARV discount +7.5/15.0
- Schools +5.5/10.0
- Condition / age +4.0/5.0
- Rent growth +2.6/5.0
- Livability +2.5/5.0
- Appreciation +0.0/10.0
$57,000
🖨 Deal sheet 📄 Offer letter ✓ Due diligence
Listing remarks
Welcome to Country Lane Mobile Home Park! Discover the perfect blend of affordable living, convenience, and comfort in this all ages community. Ideally situated near all that Bremerton has to offer. Step into this 2023 manufactured home boasting 3 bedrooms, and 1 bath. The cozy kitchen/dining room is a wonderful gathering place. You'll find all appliances included along with washer and dryer hookups. This well equipped home is ready for its new owner, making it a fantastic buy. Don't miss this opportunity to make it yours. Close to parks, trails, schools, Kitsap mall and so much more. .. .
Key facts
- Close to parks
- Close to schools
- Close to trails
Tags
Neighborhood map
What this means for you Summary
Snapshot
- This is a 3-bed/1.0-bath manufactured listed at $57k. Condition is rated good.
Deal economics
- At list price, monthly cash flow is $1k ($13k/yr) — positive.
- The deal already cash-flows at list — no discount required.
- Meets the 1% rule at list price ($2k rent vs $57k).
- Recommended offer: $50k (12.0% below list) — sets the bar for market timing.
Location & tenants
- Location reads: area grade B — affects rentability + tenant quality, not the cash-flow math above.
- Central Kitsap School District (urban): math 55% / reading 67% proficiency, ranked #49 of 291 in WA (top 17%) — acceptable for families but not a draw, mixed tenant base, ~2y average lease.
- Market conditions: Rents flat; 349 active listings in the ZIP; 3 comparable units currently listed for rent nearby; rentals leasing fast (median 14d on market — plan ~1-2 weeks tenant-placement turnaround); solid renter incomes; 1,294 units permitted in Kitsap County in 2024 (302 in 5+ unit buildings).
Forward outlook
- Local home prices are declining (-3.0%/yr); year-one equity from $394 of loan paydown is wiped out by about $2k of value loss. Plan a longer hold.
- Kitsap County population projected at +8% by 2050 — modest demand growth; plan on rents tracking national, not racing it.
- At projected returns (-3.0% appreciation + 0.3% rent growth), your $16k cash investment doubles in ~2 years — after that, you're playing with house money.
Negotiation context
- It's been on market 124 days — a 12% lower offer ($50k) is reasonable based on typical stale-listing flexibility.
- 2 sale attempts since 2y ago; this cycle's ask has dropped $13k (19%) from the opening price — seller is motivated, your offer sets the floor, not the list.
Questions for the listing agent
- It's been on market 124 days. Have you received any prior offers? Is the seller open to a 12% concession, seller financing, or rate buy-down credit?
- Why hasn't it sold? Are there any deal-killer items the seller is aware of (foundation, flood, title, zoning, code violations)?
- Is there a deadline driving the sale (1031 exchange, divorce, estate, relocation)? That informs how much negotiation room exists.
- What's the average days-on-market for RENTAL listings here right now (not sales)? A rising rental-DOM trend means longer vacancies and softer asking-rent achievability than the comps imply.
- What's the recent tenant-quality profile in this submarket — average credit score on applications, eviction rate, late-payment / NSF rate, and stable-employment percentage? A property-management company in the area should have these aggregated.
- How much new for-sale + rental construction is in the pipeline within 1–3 miles? Heavy new supply typically softens prices + rents 12–24 months out; constrained supply supports both.
Investment metrics
- 1% rule
- 3.31% ✓
- Cap rate
- 29.40%
- Cash-on-cash
- 82.54%
- DSCR
- 4.67
- GRM
- 2.5
CMA / ARV
- ARV (median comp)
- $215,775
- List price
- $57,000
- Delta
- -73.58%
- Verdict
- UNDERPRICED
- Comps
- 1 within 2.0 mi
Projected returns pro-forma
-3.0% appreciation · 0.28% rent growth · sell at horizon
- IRR
- 79.7%
- Equity multiple
- 4.49×
- Total profit
- $55,677
- Equity at exit
- $8,499
- IRR
- 82.5%
- Equity multiple
- 8.46×
- Total profit
- $119,077
- Equity at exit
- $4,928
Cash invested: $15,960 (down + closing). Projections, not guarantees.
Landlord ↔ Tenant lean methodology
- Overall (STATE)
- 28 Tenant-Leaning
- State Washington
- 28 Tenant-Leaning · D+8
- County
- — inherits STATE
- City
- — inherits STATE
ZIP-level market 98312
- Rents YoY
- 0.3%
- Active inventory
- 349
- Price-to-rent
- 2.5×
Monthly cashflow live
- Estimated rent
- $1,888 medium interval (Pro) →
- Mortgage (P&I)
- −$299
- Tax est. 1.5%
- −$71 /mo · $855/yr
- Insurance
- −$24
- HOA
- −$0
- Vacancy / Maint / Mgmt
- −$397
- Net cashflow
- $1,098
Break-even live
UW: 25.0% down · 7.5% · 30yr · 1.5% tax · 5.0% vac · 8.0% maint · 8.0% mgmt
Financing live
Cash to close
- Down payment
- $14,250
- Closing costs
- $1,710
- Reserves months
- —
- Total cash needed
- —
Loan-product check · same deal, 3 products live
Conventional
25% down · 7.5% · 30yr
- Down + closing
- —
- Monthly P&I
- —
- Monthly cashflow
- —
- DSCR
- —
- Eligible?
- —
Personal DTI + credit; lowest rate.
DSCR
20% down · 8.5% · 30yr
- Down + closing
- —
- Monthly P&I
- —
- Monthly cashflow
- —
- DSCR
- —
- Eligible?
- —
No personal income docs; deal must DSCR.
Hard money
10% down · 12.0% · 12mo
- Down + closing
- —
- Monthly P&I
- —
- Monthly cashflow
- —
- DSCR
- —
- Eligible?
- —
Short-term bridge; refi at stabilization.
Rent comps 3 comps
| Address | Beds | Baths | Sqft | Rent | $/sqft | DOM | Units | Dist |
|---|---|---|---|---|---|---|---|---|
| 3000 Northlake Way NW Bremerton, WA | 2.0 | 1.0 | 729 | $1,400 | $1.92 | 43d | 1 | 0.43mi |
| 3405 Northlake Way NW Unit 3 Bremerton, WA | 2.0 | 1.0 | 748 | $1,500 | $2.01 | 13d | 1 | 0.62mi |
| 3000 Austin Dr Bremerton, WA | 1.0–3.0 | 1.0–2.0 | 950 | $2,150 | $2.26 | 13d | 10 | 0.77mi |
Listing history 19 events
-
2026-06-18days on market $57,000 Active 124 DOM
-
2026-06-17days on market $57,000 Active 123 DOM
-
2026-06-16days on market $57,000 Active 122 DOM
-
2026-06-15days on market $57,000 Active 121 DOM
-
2026-06-14days on market $57,000 Active 119 DOM
-
2026-06-13days on market $57,000 Active 118 DOM
-
2026-06-10days on market $57,000 Active 116 DOM
-
2026-06-09days on market $57,000 Active 115 DOM
-
2026-06-08days on market $57,000 Active 114 DOM
-
2026-06-07pricedays on market $57,000 Active 113 DOM
-
2026-06-05days on market $62,000 Active 110 DOM
-
2026-06-02days on market $62,000 Active 108 DOM
-
2026-06-01days on market $62,000 Active 107 DOM
-
2026-05-31days on market $62,000 Active 106 DOM
-
2026-05-30days on market $62,000 Active 105 DOM
-
2026-03-20price $62,000
-
2026-02-14$70,000 Active
-
2024-01-26soldstatus $82,500
-
2024-01-26$82,500
ⓘ Source: listings_history table (triggers on properties + properties_extension) + one-shot
backfill from property_details.listing_events for pre-trigger history.
Climate risk First Street
- Flood 1/10 Low FEMA zone X (unshaded) · 0% chance over 30 yrs
- Wildfire 2/10 Low
- Heat 3/10 Moderate 7 d/yr ≥86°F today · 16 d/yr by 30 yrs out
- Wind 1/10 Low
- Air quality 7/10 Severe 10 unhealthy d/yr today · 10 by 30 yrs out
Nearby sold comps map
Loading sold comps map…
Walkable amenities ~0.75 mi
Loading nearby amenities…
Taxation est. · year 1
- Rental income
- $22,658
- − Mortgage interest
- −$3,193
- − Property taxes
- −$855
- − Insurance
- −$285
- − Repairs & maintenance
- −$1,813
- − Management
- −$1,813
- − Depreciation
- −$1,658
- Taxable income
- $13,042
- Est. tax owed @ 24.0%
- −$3,130
- After-tax cash flow
- $10,043/yr
For passive investors: Depreciation is non-cash, so a rental often shows a tax loss while cash-flowing — sheltering income. Rental losses are passive: they offset passive income freely, and up to $25,000/yr can offset ordinary (W-2) income if you actively participate and your MAGI is under $100k (phasing out to $0 by $150k); unused losses carry forward. On sale, claimed depreciation is recaptured at up to 25%, and gains may owe capital-gains tax (a 1031 exchange can defer both). Figures are a year-1 estimate at your 24.0% rate — not tax advice; consult a CPA.
Condition & rehab AI · 12 photos
This 2023 manufactured home is in good condition with modern updates and a move-in-ready appearance.
Value-add opportunities
- Resale paint exterior — enhances curb appeal
- Rental replace carpet — improves comfort and reduces maintenance
Renovation cost estimate screening
Value-add ROI direction
- Resale paint exterior — enhances curb appeal ↑
- Rental replace carpet — improves comfort and reduces maintenance ↑
ⓘ Cost ranges are severity-bucket heuristics (US national rule-of-thumb). Get contractor quotes + a written scope before underwriting a rehab budget.
Schools (NCES district)
- District
- Central Kitsap School District
- NCES district ID
- 5301080
- Math proficiency
- 55% ▲ 1.00%
- Reading proficiency
- 67% ▬ 0.00%
- Median HH income
- $64,825
- Composite
- 54.87/100
- National rank
- #2813
- State rank
- #49 of 291 in WA
Livability — Kitsap Lake
No livability data for this city. (Only ~50 U.S. cities are tracked.)
Census & demographics
- Census place
- Kitsap Lake, WA
- County
- Kitsap County · 243,099 people
- Metro
- Bremerton-Silverdale-Port Orchard, WA
- Population (ZIP)
- 36,307
- Household income
- $90,449
- Rent vs Own
- Severe rent burden
- 993.0
Population outlook (Kitsap County) Hauer SSP2
- Today (2025)
- 277,525 people
- By 2030
- 285,040 · +2.7%
- By 2040
- 294,957 · +6.3%
- By 2050
- 300,622 · +8.3%
- By 2075
- 315,580 · +13.7%
- By 2100
- 304,340 · +9.7%
Race, ethnicity, and origin ACS 2023
- Neighborhood character
- Predominantly White (68%)
- Race & ethnicity
- White 68% Two or more races 13% Hispanic / Latino 12% Asian 4% Black 4% Native American 1%
- Hispanic origin (detail)
- Mexican 6% Puerto Rican 1%
- Common ancestry
- Italian 7% Portuguese 5% Slovak 4%
- Foreign-born
- 6% · Canada, China
- Languages at home
- 91% English-only · Spanish 4% Tagalog/Filipino 2% Other Asian/Pacific 1%
Political lean MEDSL · Kitsap
- 2024 margin
- Strong D (+20.9) · D 58.8% · R 37.9% · Other 3.3%
- 2008→2024 swing
- +8.6pp toward D · 2008: 12.3pp · 2024: 20.9pp
- All cycles
- 2024: D+20.9 2020: D+18.1 2016: D+11.6 2012: D+11.1 2008: D+12.3
Not yet ingested
- Civics
- —
Market trends
- HPI YoY
- ▼ -436.68%
- Current HPI
- 379.2342
- Rent YoY
- ▲ 0.28%
- Metro
- Bremerton-Silverdale-Port Orchard, WA
- State GDP YoY
- ▲ 4.65%
- F500 in state
- 22
Industry mix (Fortune 500 HQ in WA)
| Industry | F500 HQs | Revenue |
|---|---|---|
| Retail | 2 | $269B |
|
||
| Technology / Retail | 1 | $638B |
|
||
| Technology | 1 | $245B |
|
||
| Telecommunications | 1 | $38B |
|
||
| Food / Beverage | 1 | $36B |
|
||
| Automotive / Trucks | 1 | $34B |
|
||
Price history
-24.8% since first listed4 events — show timeline
- 2026-03-20 Price Changed $62,000 NWMLS as Distributed by MLS Grid
- 2026-02-14 Listed $70,000 NWMLS as Distributed by MLS Grid
- 2024-01-26 Listed $82,500 NWMLS as Distributed by MLS Grid
- 2024-01-26 Sold (MLS) $82,500 NWMLS as Distributed by MLS Grid
Cash-flow waterfall
monthlySold comps — $/sqft
last 12 mo · ≤1 miLoading sold comps…