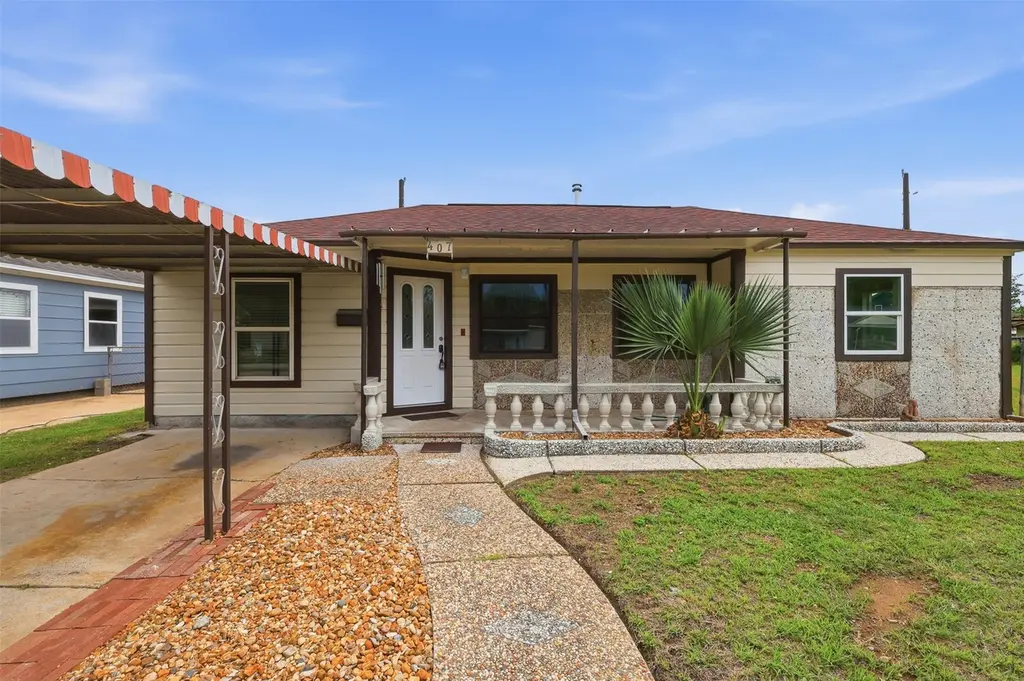
407 Meters St · Houston, TX
Flood risk 4/10 · Minor
- FEMA flood zone
- X (unshaded)
- Chance of flooding over 30 yrs
- 0.22%
- Est. flood insurance / yr
- $507 – $1,088
Fire risk 1/10 · Minimal
- Est. fire insurance / yr
- $1,222 – $2,270
Heat risk 9/10 · Severe
- Hot days now (above 110°F)
- 7 days/yr
- Hot days in 30 yrs
- 23 days/yr
Wind risk 9/10 · Severe
- Chance of severe wind over 30 yrs
- 99.0%
Air-quality risk 3/10 · Minor
- Unhealthy air days now
- 2 days/yr
- Unhealthy air days in 30 yrs
- 3 days/yr
Risk factors via First Street. Map © Google.
Why this score? — see what drove the B grade
The composite is a weighted blend of 9 inputs, each scored 0–100. Each bar is that input's sub-score; the figure is the points it added to the 100-point composite (weight × sub-score).
- Cash flow +30.0/30.0
- 1% rule +10.0/10.0
- DSCR +10.0/10.0
- Appreciation +10.0/10.0
- Livability +3.7/5.0
- Rent growth +3.6/5.0
- Schools +2.7/10.0
- Condition / age +2.5/5.0
- ARV discount +0.0/15.0
$205,000
🖨 Deal sheet 📄 Offer letter ✓ Due diligence
Listing remarks
Charming 3-bedroom, 1.5-bath home offering a functional layout and inviting spaces both inside and out. The kitchen features warm wood cabinetry, ample storage, and a convenient layout that opens to the main living areas. A bright dining space with large windows fills the home with natural light, complemented by attractive flooring throughout. All three bedrooms provide comfortable living space, while the full bath and additional half bath add convenience for daily living and guests. Step outside to enjoy a spacious yard with plenty of room for entertaining, gardening, or relaxing. The property also includes a covered carport and extended driveway for additional parking. This home combines
Key facts
- Large windows
- Warm wood cabinetry
- Bright dining space
Tags
Property features AI
Finance
- Financial info: Lease not considered
Exterior
- Utilities: Public water
- Home design: Residential property; Single-level entry with rooms on multiple levels
- Construction: Built in 1952; Cement siding; Slab foundation; Composition roof
- Exterior features: Cleared lot; Other lot features
Interior
- Kitchen: Gas cooktop; Gas oven
- Bedrooms: Primary bedroom on the first level (13 x 13); Bedroom on the second level (10 x 10); Bedroom on the third level (13 x 13); Total of 5 rooms
- Bathrooms: 1 full bathroom; 1 half bathroom (second level)
- Heating & cooling: Central heating (electric); Central air conditioning (electric)
- Interior features: Seller disclosure available
Neighborhood map
What this means for you Summary
Snapshot
- This is a 4-bed/1.0-bath single-family listed at $205k.
Deal economics
- At list price, monthly cash flow is $2k ($19k/yr) — positive.
- The deal already cash-flows at list — no discount required.
- Meets the 1% rule at list price ($4k rent vs $205k).
- Recommended offer: $202k (1.5% below list) — sets the bar for market timing.
Location & tenants
- Location reads 74/100 on livability (#184 in TX, #4,771 nationally) — a middle-class / working-renter tenant base. Strengths: amenities A+, cost of living A+, housing A+; Watch: crime F.
- Houston ISD (urban): math 27% / reading 35% proficiency, ranked #593 of 826 in TX (top 72%) — families likely to look elsewhere, expect single-tenant / working-renter base with shorter leases; 71% free/reduced lunch — lower-income household profile, screen leases tightly.
- Zoned schools: Scroggins El (math 22% / reading 22%, grade F, #3,333 of 4,322 statewide, top 80%, 335 students, 98% FRL); Mcreynolds Middle (math 10% / reading 17%, grade F, #1,602 of 1,662 statewide, top 97%, 398 students, 98% FRL); Wheatley H S (math 17% / reading 19%, grade F, #1,445 of 1,632 statewide, top 89%, 643 students, 95% FRL) — zoned schools average 97% FRL vs 71% district-wide (26 pts higher); higher-poverty schools than district average — tighter screening recommended.
- Zoned-school proficiency averages 18% at this address vs 31% district-wide (-13 pts) — the specific schools serving this property underperform the Houston ISD average; the district grade overstates school quality for this exact location.
- Market conditions: Rents rising fast (+4.3%/yr); 337 active listings in the ZIP; 3 comparable units currently listed for rent nearby; rentals leasing fast (median 6d on market — plan ~1-2 weeks tenant-placement turnaround); 29,883 units permitted in Harris County in 2024 (8,621 in 5+ unit buildings).
Forward outlook
- In year one you build about $22k of equity ($1k loan paydown + $20k appreciation (10.0% local appreciation)).
- Harris County population projected at +47% by 2050 — long-run rental-demand tailwind backs the buy-and-hold thesis.
- At projected returns (10.0% appreciation + 4.3% rent growth), your $57k cash investment doubles in ~2 years — after that, you're playing with house money.
- By year 2, paydown + projected appreciation supports a ~$35k cash-out refi (75% LTV) — recoverable capital for the next deal without selling this one.
Negotiation context
- It's been on market 24 days — a 2% lower offer ($202k) is reasonable based on typical stale-listing flexibility.
- 2 sale attempts with the ask held roughly flat each time — persistent listings suggest the price (not the market) is what's stuck; bring a comps-based counter.
Risks & watch-outs
- Watch-outs: built in 1952 — expect roof / HVAC / electrical / plumbing capex.
- Climate carrying-cost: severe wind risk, 99% chance of damaging wind over 30y; extreme-heat days projected 7→23/yr by 2055 (HVAC capex compounding) — expect insurance premiums to compound above CPI over the hold.
Questions for the listing agent
- Built in 1952 — when were the roof, HVAC, electrical panel, plumbing, and water heater last replaced?
- Is there a deadline driving the sale (1031 exchange, divorce, estate, relocation)? That informs how much negotiation room exists.
- Schools are D-rated, which usually means shorter tenancies and higher turnover. Who's the typical renter profile here, and what's been the actual vacancy rate?
- Crime grade is F in this area — have there been break-ins, vandalism, or insurance claims at this property in the last 3 years? What carrier currently insures it and at what premium?
- What's the average days-on-market for RENTAL listings here right now (not sales)? A rising rental-DOM trend means longer vacancies and softer asking-rent achievability than the comps imply.
- What's the recent tenant-quality profile in this submarket — average credit score on applications, eviction rate, late-payment / NSF rate, and stable-employment percentage? A property-management company in the area should have these aggregated.
- How much new for-sale + rental construction is in the pipeline within 1–3 miles? Heavy new supply typically softens prices + rents 12–24 months out; constrained supply supports both.
Investment metrics
- 1% rule
- 1.90% ✓
- Cap rate
- 15.73%
- Cash-on-cash
- 33.72%
- DSCR
- 2.50
- GRM
- 4.4
CMA / ARV
- ARV (median comp)
- $163,517
- List price
- $205,000
- Delta
- 25.37%
- Verdict
- OVERPRICED
- Comps
- 18 within 1.0 mi
Show comp detail 8 sales within ~0.75 mi
| Address | Dist | Beds/Ba | Sqft | Sold | Price | $/sf | Match |
|---|---|---|---|---|---|---|---|
| 7316 Victoria St | 0.30mi | 3/2.0 (-1) | 1,200 (+2%) | 1mo | $225,000 | $188 | 73 |
| 426 Meters St | 0.06mi | 3/1.0 (-1) | 1,114 (-5%) | 16mo | $220,000 | $197 | 70 |
| 7422 Gainesville St | 0.32mi | 3/1.0 (-1) | 1,272 (+8%) | 16mo | $117,000 | $92 | 54 |
| 7510 Market St | 0.65mi | 3/1.0 (-1) | 1,160 (-2%) | 19mo | $155,000 | $134 | 46 |
| 6921 Hershe St | 0.60mi | 3/1.0 (-1) | 1,032 (-12%) | 5mo | $108,000 | $105 | 42 |
| 6723 Corpus Christi | 0.69mi | 3/1.0 (-1) | 1,080 (-8%) | 13mo | $180,000 | $167 | 38 |
| 7017 Hershe St | 0.55mi | 3/1.0 (-1) | 1,075 (-9%) | 23mo | $150,000 | $140 | 36 |
| 6921 Brownwood St | 0.63mi | 3/2.0 (-1) | 1,100 (-7%) | 20mo | $215,000 | $195 | 34 |
Match score weights: distance 35% · size 25% · config 20% · recency 20%. Top-matched comps best support the ARV.
Projected returns pro-forma
10.0% appreciation · 4.27% rent growth · sell at horizon
- IRR
- 50.9%
- Equity multiple
- 4.82×
- Total profit
- $219,492
- Equity at exit
- $184,680
- IRR
- 45.1%
- Equity multiple
- 11.04×
- Total profit
- $576,487
- Equity at exit
- $398,270
Cash invested: $57,400 (down + closing). Projections, not guarantees.
Landlord ↔ Tenant lean methodology
- Overall (STATE)
- 87 Strongly Landlord-Friendly
- State Texas
- 87 Strongly Landlord-Friendly · R+5
- County
- — inherits STATE
- City
- — inherits STATE
ZIP-level market 77020
- Home prices YoY
- 29.1%
- Rents YoY
- 4.3%
- Active inventory
- 337
- Price-to-rent
- 4.4×
Monthly cashflow live
- Estimated rent
- $3,885 medium interval (Pro) →
- Mortgage (P&I)
- −$1,075
- Tax from tax record
- −$296 /mo · $3,551/yr
- Insurance
- −$85
- HOA
- −$0
- Vacancy / Maint / Mgmt
- −$816
- Net cashflow
- $1,613
Break-even live
UW: 25.0% down · 7.5% · 30yr · 1.5% tax · 5.0% vac · 8.0% maint · 8.0% mgmt
Financing live
Cash to close
- Down payment
- $51,250
- Closing costs
- $6,150
- Reserves months
- —
- Total cash needed
- —
Loan-product check · same deal, 3 products live
Conventional
25% down · 7.5% · 30yr
- Down + closing
- —
- Monthly P&I
- —
- Monthly cashflow
- —
- DSCR
- —
- Eligible?
- —
Personal DTI + credit; lowest rate.
DSCR
20% down · 8.5% · 30yr
- Down + closing
- —
- Monthly P&I
- —
- Monthly cashflow
- —
- DSCR
- —
- Eligible?
- —
No personal income docs; deal must DSCR.
Hard money
10% down · 12.0% · 12mo
- Down + closing
- —
- Monthly P&I
- —
- Monthly cashflow
- —
- DSCR
- —
- Eligible?
- —
Short-term bridge; refi at stabilization.
Rent comps 3 comps
| Address | Beds | Baths | Sqft | Rent | $/sqft | DOM | Units | Dist |
|---|---|---|---|---|---|---|---|---|
| 1023 Hahlo St Houston, TX | 4.0 | 2.0 | 1434 | $1,775 | $1.24 | 5d | 1 | 1.37mi |
| 2105 Sam Wilson St Houston, TX | 3.0 | 2.5 | 1416 | $6,750 | $4.77 | 44d | 1 | 1.41mi |
| 5605 Mulvey St Unit 1019610P Houston, TX | 3.0 | 2.5 | 1410 | $4,237 | $3.00 | 3d | 1 | 1.42mi |
Listing history 13 events
-
2026-06-13days on market $205,000 Pending 24 DOM
-
2026-06-10days on market $205,000 Pending 21 DOM
-
2026-06-08days on market $205,000 Pending 20 DOM
-
2026-06-07statusdays on market $205,000 Pending 19 DOM
-
2026-06-04days on market $205,000 Active 16 DOM
-
2026-06-01days on market $205,000 Active 13 DOM
-
2026-05-31days on market $205,000 Active 12 DOM
-
2026-05-15historical
-
2026-04-23$205,000 Active
-
2026-04-21historical
-
2010-05-11soldstatus
-
2004-02-26soldstatus
-
1999-02-28soldstatus
ⓘ Source: listings_history table (triggers on properties + properties_extension) + one-shot
backfill from property_details.listing_events for pre-trigger history.
Tax reassessment forecast TX · Resets to sale price
- Current annual tax
- $3,551 · $296/mo
- Projected year-2 tax
- $3,752 · $313/mo
- Expected delta
- +$201/yr (+$17/mo · 5.6%)
ⓘ Screening estimate from a state-policy table — verify with the county assessor before closing.
Climate risk First Street
- Flood 4/10 Moderate FEMA zone X (unshaded) · 22% chance over 30 yrs
- Wildfire 1/10 Low
- Heat 9/10 Extreme 7 d/yr ≥110°F today · 23 d/yr by 30 yrs out
- Wind 9/10 Extreme 99% chance of damaging wind over 30 yrs
- Air quality 3/10 Moderate 2 unhealthy d/yr today · 3 by 30 yrs out
Nearby sold comps map
Loading sold comps map…
Walkable amenities ~0.75 mi
Loading nearby amenities…
Taxation est. · year 1
- Rental income
- $46,623
- − Mortgage interest
- −$11,483
- − Property taxes
- −$3,551
- − Insurance
- −$1,025
- − Repairs & maintenance
- −$3,730
- − Management
- −$3,730
- − Depreciation
- −$5,964
- Taxable income
- $17,141
- Est. tax owed @ 24.0%
- −$4,114
- After-tax cash flow
- $15,242/yr
For passive investors: Depreciation is non-cash, so a rental often shows a tax loss while cash-flowing — sheltering income. Rental losses are passive: they offset passive income freely, and up to $25,000/yr can offset ordinary (W-2) income if you actively participate and your MAGI is under $100k (phasing out to $0 by $150k); unused losses carry forward. On sale, claimed depreciation is recaptured at up to 25%, and gains may owe capital-gains tax (a 1031 exchange can defer both). Figures are a year-1 estimate at your 24.0% rate — not tax advice; consult a CPA.
Schools (NCES district)
- District
- Houston ISD
- NCES district ID
- 4823640
- Math proficiency
- 27% ▼ -18.00%
- Reading proficiency
- 35% ▼ -6.00%
- Median HH income
- $46,054
- Composite
- 26.63/100
- National rank
- #7173
- State rank
- #593 of 826 in TX
Livability — Houston
- Score
- 74/100
- State rank
- #184
- US rank
- #4771
Category grades
Schools grade is shown separately in the Schools card above.
Census & demographics
- Census place
- Houston, TX
- County
- Harris County · 4,702,590 people
- City population
- 3,226,434
- Metro
- Houston-The Woodlands-Sugar Land, TX
- Population (ZIP)
- 23,686
- Household income
- $50,119
- Rent vs Own
- Severe rent burden
- 969.0
Population outlook (Harris County) Hauer SSP2
- Today (2025)
- 5,571,493 people
- By 2030
- 6,089,821 · +9.3%
- By 2040
- 7,142,806 · +28.2%
- By 2050
- 8,185,864 · +46.9%
- By 2075
- 10,574,329 · +89.8%
- By 2100
- 12,109,958 · +117.4%
Race, ethnicity, and origin ACS 2023
- Neighborhood character
- Predominantly Hispanic (69%)
- Race & ethnicity
- Hispanic / Latino 69% Black 24% Two or more races 22% White 5% Asian 1%
- Hispanic origin (detail)
- Mexican 60%
- Common ancestry
- Swiss 1%
- Foreign-born
- 23% · Canada
- Languages at home
- 39% English-only · Spanish 59% Other Indo-European 1%
Political lean MEDSL · Harris
- 2024 margin
- Lean D (+5.5) · D 52.0% · R 46.4% · Other 1.6%
- 2008→2024 swing
- +3.9pp toward D · 2008: 1.6pp · 2024: 5.5pp
- All cycles
- 2024: D+5.5 2020: D+13.3 2016: D+12.4 2012: D+0.1 2008: D+1.6
Not yet ingested
- Civics
- —
Market trends
- HPI YoY
- ▲ 55.64%
- Current HPI
- 246.5578
- Rent YoY
- ▲ 4.27%
- Metro
- Houston-The Woodlands-Sugar Land, TX
- State GDP YoY
- ▲ 3.95%
- F500 in state
- 110
Industry mix (Fortune 500 HQ in TX)
| Industry | F500 HQs | Revenue |
|---|---|---|
| Energy | 16 | $1,198B |
|
||
| Technology | 5 | $198B |
|
||
| Engineering / Construction | 4 | $72B |
|
||
| Energy Services | 3 | $60B |
|
||
| Utilities | 3 | $41B |
|
||
| Healthcare | 2 | $330B |
|
||
Price history
+0.0% since first listed9 events — show timeline
- 2026-06-12 Pending — HARMLS
- 2026-06-04 Pending — HARMLS
- 2026-05-19 Listed $205,000 HARMLS
- 2026-05-15 Listing Removed — HARMLS
- 2026-04-23 Listed $205,000 HARMLS
- 2026-04-21 Coming Soon — HARMLS
- 2010-05-11 Sold (Public Records) — Public Records
- 2004-02-26 Sold (Public Records) — Public Records
- 1999-02-28 Sold (Public Records) — Public Records
Property tax history
+11.6%/yrLatest (2025): $3,551 · +1.6% YoY. Source: county tax records.
Cash-flow waterfall
monthlySold comps — $/sqft
last 12 mo · ≤1 miLoading sold comps…