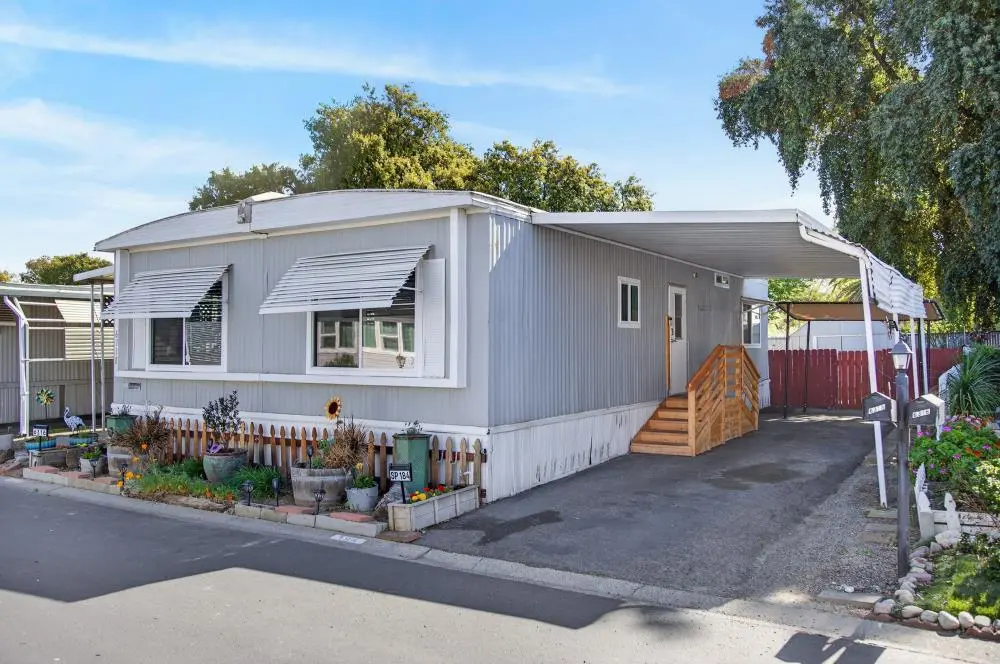
6318 Marshall Dr · Foothill Farms, CA
Flood risk 1/10 · Minimal
- FEMA flood zone
- X (unshaded)
- Chance of flooding over 30 yrs
- 0.0%
- Est. flood insurance / yr
- $507 – $1,088
Fire risk 1/10 · Minimal
- Est. fire insurance / yr
- $659 – $1,223
Heat risk 7/10 · Major
- Hot days now (above 102°F)
- 7 days/yr
- Hot days in 30 yrs
- 16 days/yr
Wind risk 1/10 · Minimal
- Chance of severe wind over 30 yrs
- —
Air-quality risk 10/10 · Severe
- Unhealthy air days now
- 34 days/yr
- Unhealthy air days in 30 yrs
- 38 days/yr
Risk factors via First Street. Map © Google.
Why this score? — see what drove the B+ grade
The composite is a weighted blend of 9 inputs, each scored 0–100. Each bar is that input's sub-score; the figure is the points it added to the 100-point composite (weight × sub-score).
- Cash flow +30.0/30.0
- ARV discount +13.6/15.0
- 1% rule +10.0/10.0
- DSCR +10.0/10.0
- Rent growth +4.1/5.0
- Livability +3.2/5.0
- Schools +3.1/10.0
- Condition / age +2.5/5.0
- Appreciation +0.0/10.0
$75,000
🖨 Deal sheet 📄 Offer letter ✓ Due diligence
Listing remarks
This charming 2-bed, 1-bath home in the sought-after Hillsdale 55+ Community offers 1,056 square feet of comfortable living space with one of the largest backyards in the park. The kitchen features refreshed cabinetry and granite-style countertops. Newer laminate flooring flows through the kitchen and main living areas, while new carpet keeps the bedrooms and living room fresh. The bright, open living room connects easily to the dining area and kitchen for a natural everyday flow. A dedicated laundry space with upper cabinetry keeps things tidy and functional. Step outside to a generously sized, fenced backyard with mature trees, raised garden beds, two storage sheds, and a patio perfect fo
Key facts
- Largest backyards
- Refreshed cabinetry
- Fenced backyard
Tags
Neighborhood map
What this means for you Summary
Snapshot
- This is a 2-bed/1.0-bath manufactured listed at $75k.
Deal economics
- At list price, monthly cash flow is $883 ($11k/yr) — positive.
- The deal already cash-flows at list — no discount required.
- Meets the 1% rule at list price ($2k rent vs $75k).
- Recommended offer: $70k (6.0% below list) — sets the bar for market timing.
- Cap rate 20.4% vs local median 3.9% in Foothill Farms — top-decile yield for the area; either an underpriced asset or a hidden risk that comps aren't pricing in. Stress-test before assuming the spread holds.
Location & tenants
- Location reads 64/100 on livability (#433 in CA) — a middle-class / working-renter tenant base. Strengths: housing A+, schools A; Watch: employment D+, crime F, amenities F.
- Twin Rivers Unified (suburban): math 29% / reading 37% proficiency, ranked #970 of 1,400 in CA (top 69%) — families likely to look elsewhere, expect single-tenant / working-renter base with shorter leases; 76% free/reduced lunch — lower-income household profile, screen leases tightly.
- Market conditions: Rents rising fast (+6.5%/yr); 130 active listings in the ZIP; 40 comparable units currently listed for rent nearby; rentals leasing fast (median 2d on market — plan ~1-2 weeks tenant-placement turnaround); 6,825 units permitted in Sacramento County in 2024 (1,752 in 5+ unit buildings).
- This rent runs 31% of the median local income ($68k/yr) — at the standard rent-burdened threshold; future hikes will face affordability resistance.
Forward outlook
- Local home prices are declining (-3.0%/yr); year-one equity from $519 of loan paydown is wiped out by about $2k of value loss. Plan a longer hold.
- Sacramento County population projected at +17% by 2050 — long-run rental-demand tailwind backs the buy-and-hold thesis.
- At projected returns (-3.0% appreciation + 6.5% rent growth), your $21k cash investment doubles in ~3 years — after that, you're playing with house money.
Negotiation context
- It's been on market 70 days — a 6% lower offer ($70k) is reasonable based on typical stale-listing flexibility.
Risks & watch-outs
- Climate carrying-cost: extreme-heat days projected 7→16/yr by 2055 (HVAC capex compounding) — expect insurance premiums to compound above CPI over the hold.
Questions for the listing agent
- It's been on market 70 days. Have you received any prior offers? Is the seller open to a 6% concession, seller financing, or rate buy-down credit?
- Built in 1972 — when were the roof, HVAC, electrical panel, plumbing, and water heater last replaced?
- Why hasn't it sold? Are there any deal-killer items the seller is aware of (foundation, flood, title, zoning, code violations)?
- Is there a deadline driving the sale (1031 exchange, divorce, estate, relocation)? That informs how much negotiation room exists.
- Schools are A-rated — typically a magnet for longer-tenancy family renters. What's the average tenant stay here, and is there a school-zone premium baked into asking?
- Crime grade is F in this area — have there been break-ins, vandalism, or insurance claims at this property in the last 3 years? What carrier currently insures it and at what premium?
- What's the average days-on-market for RENTAL listings here right now (not sales)? A rising rental-DOM trend means longer vacancies and softer asking-rent achievability than the comps imply.
- What's the recent tenant-quality profile in this submarket — average credit score on applications, eviction rate, late-payment / NSF rate, and stable-employment percentage? A property-management company in the area should have these aggregated.
- How much new for-sale + rental construction is in the pipeline within 1–3 miles? Heavy new supply typically softens prices + rents 12–24 months out; constrained supply supports both.
Investment metrics
- 1% rule
- 2.37% ✓
- Cap rate
- 20.42%
- Cash-on-cash
- 50.46%
- DSCR
- 3.25
- GRM
- 3.5
CMA / ARV
- ARV (median comp)
- $86,834
- List price
- $75,000
- Delta
- -13.63%
- Verdict
- UNDERPRICED
- Comps
- 4 within 1.0 mi
Show comp detail 8 sales within ~0.75 mi
| Address | Dist | Beds/Ba | Sqft | Sold | Price | $/sf | Match |
|---|---|---|---|---|---|---|---|
| 4603 Long Branch Dr #166 | 0.10mi | 2/2.0 | 1,056 (0%) | 13mo | $87,500 | $83 | 80 |
| 6300 Stagecoach Dr | 0.13mi | 2/2.0 | 1,120 (+6%) | 7mo | $90,000 | $80 | 74 |
| 6339 Marshall Dr #146 | 0.06mi | 2/2.0 | 1,080 (+2%) | 23mo | $89,000 | $82 | 70 |
| 6206 Gold Dust Dr | 0.28mi | 2/2.0 | 1,058 (+0%) | 16mo | $105,000 | $99 | 69 |
| 6346 Marshall Dr | 0.08mi | 2/2.0 | 940 (-11%) | 11mo | $49,999 | $53 | 65 |
| 6318 Bonanza | 0.06mi | 2/2.0 | 960 (-9%) | 18mo | $110,000 | $115 | 63 |
| 6324 Bonanza Dr | 0.04mi | 2/1.0 | 1,200 (+14%) | 20mo | $110,000 | $92 | 58 |
| 6256 Stagecoach Dr #89 | 0.17mi | 3/2.0 (+1) | 1,213 (+15%) | 18mo | $125,000 | $103 | 43 |
Match score weights: distance 35% · size 25% · config 20% · recency 20%. Top-matched comps best support the ARV.
Projected returns pro-forma
-3.0% appreciation · 6.52% rent growth · sell at horizon
- IRR
- 52.2%
- Equity multiple
- 3.41×
- Total profit
- $50,623
- Equity at exit
- $11,183
- IRR
- 58.9%
- Equity multiple
- 7.92×
- Total profit
- $145,312
- Equity at exit
- $6,485
Cash invested: $21,000 (down + closing). Projections, not guarantees.
Landlord ↔ Tenant lean methodology
- Overall (STATE)
- 18 Strongly Tenant-Friendly
- State California
- 18 Strongly Tenant-Friendly · D+13
- County
- — inherits STATE
- City
- — inherits STATE
ZIP-level market 95842
- Home prices YoY
- -30.3%
- Rents YoY
- 6.5%
- Active inventory
- 130
- Price-to-rent
- 3.5×
Monthly cashflow live
- Estimated rent
- $1,774 high interval (Pro) →
- Mortgage (P&I)
- −$393
- Tax est. 1.5%
- −$94 /mo · $1,125/yr
- Insurance
- −$31
- HOA
- −$0
- Vacancy / Maint / Mgmt
- −$373
- Net cashflow
- $883
Break-even live
UW: 25.0% down · 7.5% · 30yr · 1.5% tax · 5.0% vac · 8.0% maint · 8.0% mgmt
Financing live
Cash to close
- Down payment
- $18,750
- Closing costs
- $2,250
- Reserves months
- —
- Total cash needed
- —
Loan-product check · same deal, 3 products live
Conventional
25% down · 7.5% · 30yr
- Down + closing
- —
- Monthly P&I
- —
- Monthly cashflow
- —
- DSCR
- —
- Eligible?
- —
Personal DTI + credit; lowest rate.
DSCR
20% down · 8.5% · 30yr
- Down + closing
- —
- Monthly P&I
- —
- Monthly cashflow
- —
- DSCR
- —
- Eligible?
- —
No personal income docs; deal must DSCR.
Hard money
10% down · 12.0% · 12mo
- Down + closing
- —
- Monthly P&I
- —
- Monthly cashflow
- —
- DSCR
- —
- Eligible?
- —
Short-term bridge; refi at stabilization.
Rent comps 40 comps
| Address | Beds | Baths | Sqft | Rent | $/sqft | DOM | Units | Dist |
|---|---|---|---|---|---|---|---|---|
| 5966 Walerga Rd #4 Sacramento, CA | 2.0 | 1.0 | 924 | $1,550 | $1.68 | 1d | 1 | 0.31mi |
| 5954 Walerga Rd #1 Sacramento, CA | 2.0 | 1.0 | 800 | $1,345 | $1.68 | 1d | 1 | 0.32mi |
| 5954 Walerga Rd #3 Sacramento, CA | 2.0 | 1.0 | 840 | $1,395 | $1.66 | 10d | 1 | 0.32mi |
| 5948 Walerga Rd #3 Sacramento, CA | 2.0 | 1.0 | 840 | $1,395 | $1.66 | 1d | 1 | 0.32mi |
| 6200 Osullivan Ln Sacramento, CA | 2.0 | 2.0 | 1316 | $1,775 | $1.35 | 7d | 1 | 0.34mi |
| 4440 Oakhollow Dr Sacramento, CA | 1.0–2.0 | 1.0 | 842 | $1,590 | $1.89 | 1d | 8 | 0.35mi |
| 5674 Hillsdale Blvd Sacramento, CA | 2.0 | 1.5 | 933 | $1,600 | $1.71 | 1d | 1 | 0.65mi |
| 4758 Greenholme Dr Sacramento, CA | 2.0 | 1.0 | 924 | $1,595 | $1.73 | 43d | 1 | 0.70mi |
| 5800 Hamilton St Sacramento, CA | 1.0–2.0 | 1.0–2.0 | 823 | $1,770 | $2.15 | 1d | 4 | 0.70mi |
| 5614 Hillsdale Blvd Unit A Sacramento, CA | 2.0 | 1.5 | 933 | $1,450 | $1.55 | 21d | 1 | 0.73mi |
| 4549 Greenholme Dr #2 Sacramento, CA | 2.0 | 1.0 | 840 | $2,000 | $2.38 | 3d | 1 | 0.74mi |
| 4358 Greenholme Dr #9 Sacramento, CA | 1.0 | 1.0 | 844 | $1,695 | $2.01 | 3d | 1 | 0.79mi |
| 5600 Walerga Rd #4 Sacramento, CA | 2.0 | 1.0 | 924 | $1,700 | $1.84 | 1d | 1 | 0.79mi |
| 5233 Calistoga Way Sacramento, CA | 3.0 | 2.0 | 1200 | $2,495 | $2.08 | 1d | 1 | 0.85mi |
| 5525 Missie Way Unit 8346003001/85 Sacramento, CA | 2.0 | 1.0 | 1000 | $1,985 | $1.99 | 1d | 1 | 0.88mi |
| 4215 Palm Ave Sacramento, CA | 1.0–2.0 | 1.0–2.0 | 775 | $1,660 | $2.14 | 1d | 3 | 0.88mi |
| 5109 Andrea Blvd Sacramento, CA | 2.0 | 1.0 | 828 | $1,769 | $2.14 | 1d | 2 | 0.89mi |
| 6830 Walerga Rd Sacramento, CA | 2.0 | 1.0–2.0 | 836 | $1,752 | $2.09 | 1d | 6 | 0.90mi |
| 4815 Mary Kate Dr Sacramento, CA | 2.0 | 2.0 | 1100 | $1,850 | $1.68 | 43d | 1 | 0.93mi |
| 4821 Mary Kate Dr Unit 4823 Sacramento, CA | 2.0 | 2.0 | 1050 | $1,675 | $1.60 | 1d | 1 | 0.93mi |
| 6037 N Haven Dr North Highlands, CA | 3.0 | 1.0 | 884 | $2,150 | $2.43 | 1d | 1 | 0.95mi |
| 5443 College Oak Dr Sacramento, CA | 1.0–2.0 | 1.0–2.0 | 821 | $1,850 | $2.25 | 43d | 3 | 1.00mi |
| 6629 Medora Dr North Highlands, CA | 3.0 | 2.0 | 1090 | $1,995 | $1.83 | 43d | 1 | 1.01mi |
| 6841 Concert Way Sacramento, CA | 2.0 | 2.0 | 1000 | $1,995 | $2.00 | 1d | 1 | 1.01mi |
| 6625 Medora Dr North Highlands, CA | 3.0 | 1.0 | 972 | $2,100 | $2.16 | 10d | 1 | 1.01mi |
| 5417 Olympic Way Sacramento, CA | 2.0 | 1.0 | 920 | $1,795 | $1.95 | 14d | 1 | 1.03mi |
| 5516 Palmdale Way Sacramento, CA | 3.0 | 2.0 | 1115 | $2,250 | $2.02 | 20d | 1 | 1.03mi |
| 5415 College Oak Dr Sacramento, CA | 1.0–2.0 | 1.0–2.0 | 850 | $1,725 | $2.03 | 1d | 3 | 1.07mi |
| Venuto Way North Highlands, CA | 2.0 | 1.0 | 906 | $2,095 | $2.31 | 10d | 2 | 1.12mi |
| 5733 San Vincente Way North Highlands, CA | 3.0 | 1.0 | 925 | $2,195 | $2.37 | 2d | 1 | 1.14mi |
| 5500 Foothill Garden Ct Sacramento, CA | 1.0 | 1.0 | 750 | $1,472 | $1.96 | 1d | 2 | 1.16mi |
| 4901 Adorn Ct Sacramento, CA | 3.0 | 2.0 | 1361 | $2,450 | $1.80 | 1d | 1 | 1.16mi |
| 5520 Harrison St North Highlands, CA | 2.0 | 1.0 | 735 | $1,478 | $2.01 | 7d | 1 | 1.16mi |
| 5840 Garfield Ave Sacramento, CA | 2.0 | 1.0 | 850 | $1,545 | $1.82 | 1d | 2 | 1.18mi |
| 5341 Walnut Ave Sacramento, CA | 1.0–2.0 | 1.0 | 750 | $1,795 | $2.39 | 1d | 6 | 1.18mi |
| 5587 Keoncrest Cir Unit 2 Sacramento, CA | 2.0 | 1.5 | 900 | $2,000 | $2.22 | 1d | 1 | 1.20mi |
| 5501 Keoncrest Cir Unit 1 Sacramento, CA | 2.0 | 1.0 | 750 | $1,300 | $1.73 | 1d | 1 | 1.21mi |
| 5922 Petaluma Ct Sacramento, CA | 2.0 | 2.0 | 1048 | $2,075 | $1.98 | 1d | 1 | 1.21mi |
| 7200 Pepperwood Knoll Ln Sacramento, CA | 1.0–2.0 | 1.0–2.0 | 854 | $1,855 | $2.17 | 1d | 3 | 1.22mi |
| 5625 San Vincente Way North Highlands, CA | 3.0 | 1.0 | 875 | $2,150 | $2.46 | 1d | 1 | 1.23mi |
Listing history 5 events
-
2026-06-07status $75,000 Pending 70 DOM
-
2026-06-03days on market $75,000 Active 70 DOM
-
2026-06-02days on market $75,000 Active 69 DOM
-
2026-06-01days on market $75,000 Active 68 DOM
-
2026-05-31days on market $75,000 Active 67 DOM
ⓘ Source: listings_history table (triggers on properties + properties_extension) + one-shot
backfill from property_details.listing_events for pre-trigger history.
Climate risk First Street
- Flood 1/10 Low FEMA zone X (unshaded) · 0% chance over 30 yrs
- Wildfire 1/10 Low
- Heat 7/10 Severe 7 d/yr ≥102°F today · 16 d/yr by 30 yrs out
- Wind 1/10 Low
- Air quality 10/10 Extreme 34 unhealthy d/yr today · 38 by 30 yrs out
Nearby sold comps map
Loading sold comps map…
Walkable amenities ~0.75 mi
Loading nearby amenities…
Taxation est. · year 1
- Rental income
- $21,287
- − Mortgage interest
- −$4,201
- − Property taxes
- −$1,125
- − Insurance
- −$375
- − Repairs & maintenance
- −$1,703
- − Management
- −$1,703
- − Depreciation
- −$2,182
- Taxable income
- $9,998
- Est. tax owed @ 24.0%
- −$2,400
- After-tax cash flow
- $8,198/yr
For passive investors: Depreciation is non-cash, so a rental often shows a tax loss while cash-flowing — sheltering income. Rental losses are passive: they offset passive income freely, and up to $25,000/yr can offset ordinary (W-2) income if you actively participate and your MAGI is under $100k (phasing out to $0 by $150k); unused losses carry forward. On sale, claimed depreciation is recaptured at up to 25%, and gains may owe capital-gains tax (a 1031 exchange can defer both). Figures are a year-1 estimate at your 24.0% rate — not tax advice; consult a CPA.
Schools (NCES district)
- District
- Twin Rivers Unified
- NCES district ID
- 0601332
- Math proficiency
- 29% ▲ 2.00%
- Reading proficiency
- 37% ▲ 2.00%
- Median HH income
- $42,481
- Composite
- 30.67/100
- National rank
- #11437
- State rank
- #970 of 1400 in CA
Livability — Foothill Farms
- Score
- 64/100
- State rank
- #433
- US rank
- #14728
Category grades
Schools grade is shown separately in the Schools card above.
Census & demographics
- Census place
- Foothill Farms, CA
- County
- Sacramento County · 1,539,646 people
- City population
- 35,031
- Metro
- Sacramento-Roseville-Folsom, CA
- Population (ZIP)
- 34,034
- Household income
- $68,276
- Rent vs Own
- Severe rent burden
- 1906.0
Population outlook (Sacramento County) Hauer SSP2
- Today (2025)
- 1,660,763 people
- By 2030
- 1,732,990 · +4.3%
- By 2040
- 1,855,755 · +11.7%
- By 2050
- 1,941,335 · +16.9%
- By 2075
- 2,046,162 · +23.2%
- By 2100
- 1,961,444 · +18.1%
Race, ethnicity, and origin ACS 2023
- Neighborhood character
- Highly diverse neighborhood (Simpson 0.71)
- Race & ethnicity
- White 45% Hispanic / Latino 23% Two or more races 14% Asian 12% Black 12% Native American 1%
- Hispanic origin (detail)
- Mexican 19%
- Common ancestry
- Scotch-Irish 5% Subsaharan African 5% Lithuanian 2%
- Foreign-born
- 26% · Canada, Vietnam, South Korea
- Languages at home
- 61% English-only · Spanish 14% Russian/Polish/Slavic 11% Other Indo-European 5%
Political lean MEDSL · Sacramento
- 2024 margin
- D (+19.7) · D 58.1% · R 38.4% · Other 3.5%
- 2008→2024 swing
- +0.7pp no change · 2008: 19.0pp · 2024: 19.7pp
- All cycles
- 2024: D+19.7 2020: D+25.3 2016: D+23.7 2012: D+16.3 2008: D+19.0
Not yet ingested
- Civics
- —
Market trends
- HPI YoY
- ▼ -166.74%
- Current HPI
- 384.1812
- Rent YoY
- ▲ 6.52%
- Metro
- Sacramento-Roseville-Folsom, CA
- State GDP YoY
- ▲ 3.21%
- F500 in state
- 116
Industry mix (Fortune 500 HQ in CA)
| Industry | F500 HQs | Revenue |
|---|---|---|
| Technology | 27 | $1,492B |
|
||
| Financial Services | 3 | $174B |
|
||
| Retail | 3 | $44B |
|
||
| Insurance | 3 | $26B |
|
||
| Media / Entertainment | 2 | $115B |
|
||
| Pharmaceuticals / Biotech | 2 | $62B |
|
||
Cash-flow waterfall
monthlySold comps — $/sqft
last 12 mo · ≤1 miLoading sold comps…