 Triplex
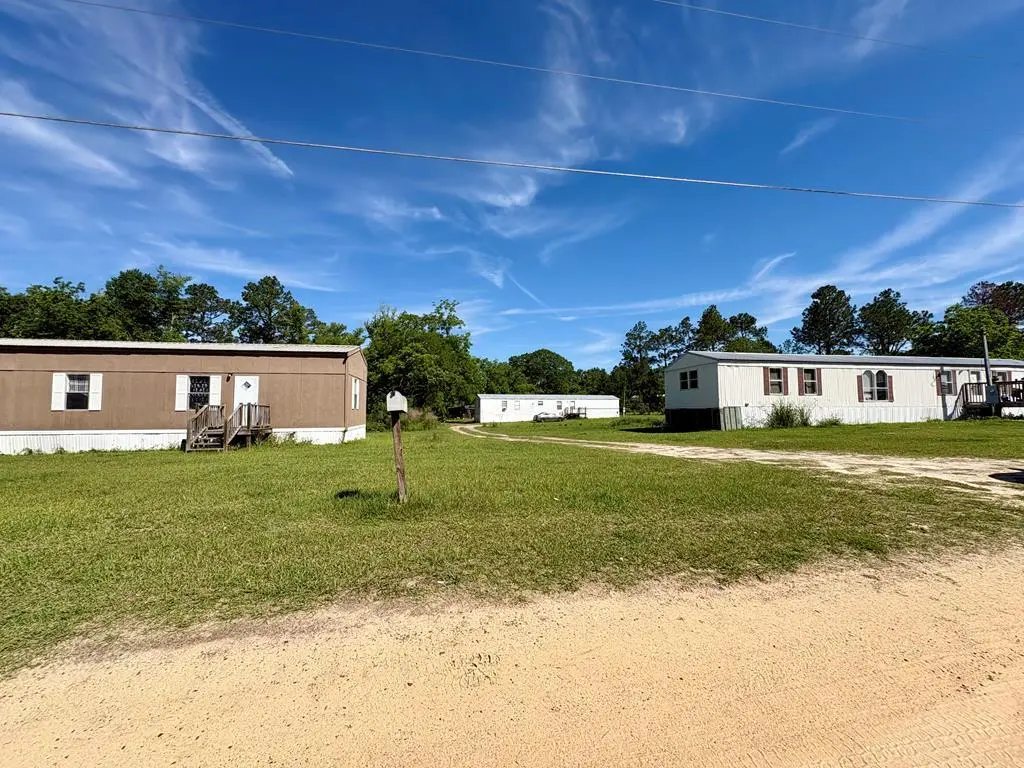
84 Ivey Ln Unit NA · Enigma, GA
Flood risk 1/10 · Minimal
- FEMA flood zone
- X (unshaded)
- Chance of flooding over 30 yrs
- 0.0%
- Est. flood insurance / yr
- $507 – $1,088
Fire risk 6/10 · Moderate
- Est. fire insurance / yr
- $963 – $1,789
Heat risk 8/10 · Major
- Hot days now (above 107°F)
- 7 days/yr
- Hot days in 30 yrs
- 21 days/yr
Wind risk 8/10 · Major
- Chance of severe wind over 30 yrs
- 99.0%
Air-quality risk 4/10 · Minor
- Unhealthy air days now
- 5 days/yr
- Unhealthy air days in 30 yrs
- 5 days/yr
Risk factors via First Street. Map © Google.
Why this score? — see what drove the B- grade
The composite is a weighted blend of 9 inputs, each scored 0–100. Each bar is that input's sub-score; the figure is the points it added to the 100-point composite (weight × sub-score).
- Cash flow +30.0/30.0
- 1% rule +10.0/10.0
- DSCR +10.0/10.0
- Appreciation +7.2/10.0
- Schools +3.8/10.0
- Livability +3.2/5.0
- Rent growth +2.5/5.0
- Condition / age +2.2/5.0
- ARV discount +0.0/15.0
$124,900
🖨 Deal sheet 📄 Offer letter ✓ Due diligence
Multi-family units
County records classify this as Multi-Family (2-4 Unit). Listing-text estimate: 3 units. confirmed
Listing remarks
Investment opportunity in Enigma! This unique income-producing property features 3 mobile homes situated on approximately 2 acres, currently bringing in $2,400 per month in rental income. Whether you're looking to expand your investment portfolio or step into rental property ownership, this property offers immediate cash flow potential. All units are currently rented out and generating steady rental income, making this property an excellent opportunity for investors seeking long-term potential. Don't miss your chance to own a multi-unit investment property in South Georgia with acreage, income, and opportunity all in one package!
Key facts
- Rental income
- 2 acre lot
- Listed 3 days
Tags
Property features AI
Exterior
- Utilities: Public water
- Home design: Single-story; Residential income property (investment); Zoning: R4
- Construction: Vinyl and wood siding
- Exterior features: Public water
Interior
- Interior features: Refrigerator included
Neighborhood map
What this means for you Summary
Snapshot
- This is a 3 × 3-bed/1.7-bath units multifamily listed at $125k. Condition is rated fair.
Deal economics
- At list price, monthly cash flow is $1k ($18k/yr) — positive. Per door: $490/mo.
- The deal already cash-flows at list — no discount required.
- Meets the 1% rule at list price ($3k rent vs $125k).
Location & tenants
- Location reads 65/100 on livability (#212 in GA) — a middle-class / working-renter tenant base. Strengths: cost of living A+, housing A+, crime A; Watch: health & safety C-, employment D, schools F.
- Berrien County (rural): math 48% / reading 44% proficiency, ranked #24 of 174 in GA (top 14%) — families likely to look elsewhere, expect single-tenant / working-renter base with shorter leases.
- Market conditions: 11 active listings in the ZIP; 96 units permitted in Berrien County in 2024 (0 in 5+ unit buildings).
Forward outlook
- In year one you build about $6k of equity ($864 loan paydown + $5k appreciation (4.4% local appreciation)).
- Berrien County population projected at -23% by 2050 — secular population decline; favor cash flow + early exit over multi-decade hold.
- At projected returns (4.4% appreciation + 3.0% rent growth), your $35k cash investment doubles in ~2 years — after that, you're playing with house money.
- By year 6, paydown + projected appreciation supports a ~$34k cash-out refi (75% LTV) — recoverable capital for the next deal without selling this one.
Negotiation context
- Only 3 days on market — expect competitive offers; lowballing is unlikely to land.
Risks & watch-outs
- Climate carrying-cost: severe wind risk, 99% chance of damaging wind over 30y; major wildfire risk; extreme-heat days projected 7→21/yr by 2055 (HVAC capex compounding) — expect insurance premiums to compound above CPI over the hold.
Questions for the listing agent
- Can we see the unit-by-unit rent roll, current vacancy, and any below-market leases? What's the average tenancy length?
- What capital expenditures (roof, boiler, parking lot, exteriors) have been made in the last 5 years, and what's planned in the next 2?
- Have any recent inspections been done? Can we get a copy of the seller's disclosures and any deferred-maintenance estimates?
- Is there a deadline driving the sale (1031 exchange, divorce, estate, relocation)? That informs how much negotiation room exists.
- Schools are F-rated, which usually means shorter tenancies and higher turnover. Who's the typical renter profile here, and what's been the actual vacancy rate?
- What's the average days-on-market for RENTAL listings here right now (not sales)? A rising rental-DOM trend means longer vacancies and softer asking-rent achievability than the comps imply.
- What's the recent tenant-quality profile in this submarket — average credit score on applications, eviction rate, late-payment / NSF rate, and stable-employment percentage? A property-management company in the area should have these aggregated.
- How much new apartment / multifamily construction is in the pipeline within 1–3 miles? Heavy new supply (>2% of stock underway) typically softens rents 12–24 months out; light construction supports rent growth.
Investment metrics
- 1% rule
- 2.37% ✓
- Cap rate
- 20.43%
- Cash-on-cash
- 50.48%
- DSCR
- 3.25
- GRM
- 3.5
CMA / ARV
- ARV (median comp)
- $103,767
- List price
- $124,900
- Delta
- 20.37%
- Verdict
- OVERPRICED
- Comps
- 1 within 2.0 mi
Projected returns pro-forma
4.36% appreciation · 3.0% rent growth · sell at horizon
- IRR
- 57.3%
- Equity multiple
- 4.37×
- Total profit
- $118,005
- Equity at exit
- $65,955
- IRR
- 55.6%
- Equity multiple
- 8.95×
- Total profit
- $278,134
- Equity at exit
- $110,028
Cash invested: $34,972 (down + closing). Projections, not guarantees.
Landlord ↔ Tenant lean methodology
- Overall (STATE)
- 90 Strongly Landlord-Friendly
- State Georgia
- 90 Strongly Landlord-Friendly · R+3
- County
- — inherits STATE
- City
- — inherits STATE
ZIP-level market 31749
- Home prices YoY
- 2.3%
- Active inventory
- 11
- Price-to-rent
- 10.6×
Monthly cashflow live
- Estimated rent
- $2,955 medium interval (Pro) →
- Mortgage (P&I)
- −$655
- Tax est. 1.5%
- −$156 /mo · $1,874/yr
- Insurance
- −$52
- HOA
- −$0
- Vacancy / Maint / Mgmt
- −$621
- Net cashflow
- $1,471
Break-even live
3-unit breakdown (identical units grouped — click to expand)
| Units | Beds | Baths | Est. rent |
|---|---|---|---|
| 3× units | 3 | 1.7 | $2,955 |
| #1 | 3 | 1.7 | $985 |
| #2 | 3 | 1.7 | $985 |
| #3 | 3 | 1.7 | $985 |
| Total (3 units) | $2,955 | ||
UW: 25.0% down · 7.5% · 30yr · 1.5% tax · 5.0% vac · 8.0% maint · 8.0% mgmt
Financing live
Cash to close
- Down payment
- $31,225
- Closing costs
- $3,747
- Reserves months
- —
- Total cash needed
- —
Loan-product check · same deal, 3 products live
Conventional
25% down · 7.5% · 30yr
- Down + closing
- —
- Monthly P&I
- —
- Monthly cashflow
- —
- DSCR
- —
- Eligible?
- —
Personal DTI + credit; lowest rate.
DSCR
20% down · 8.5% · 30yr
- Down + closing
- —
- Monthly P&I
- —
- Monthly cashflow
- —
- DSCR
- —
- Eligible?
- —
No personal income docs; deal must DSCR.
Hard money
10% down · 12.0% · 12mo
- Down + closing
- —
- Monthly P&I
- —
- Monthly cashflow
- —
- DSCR
- —
- Eligible?
- —
Short-term bridge; refi at stabilization.
Listing history 2 events
-
2026-05-18status Pending 637-char remark
-
2026-05-15$124,900 Active 637-char remark
ⓘ Source: listings_history table (triggers on properties + properties_extension) + one-shot
backfill from property_details.listing_events for pre-trigger history.
Climate risk First Street
- Flood 1/10 Low FEMA zone X (unshaded) · 0% chance over 30 yrs
- Wildfire 6/10 Major
- Heat 8/10 Severe 7 d/yr ≥107°F today · 21 d/yr by 30 yrs out
- Wind 8/10 Severe 99% chance of damaging wind over 30 yrs
- Air quality 4/10 Moderate 5 unhealthy d/yr today · 5 by 30 yrs out
Nearby sold comps map
Loading sold comps map…
Walkable amenities ~0.75 mi
Loading nearby amenities…
Taxation est. · year 1
- Rental income
- $35,460
- − Mortgage interest
- −$6,996
- − Property taxes
- −$1,874
- − Insurance
- −$624
- − Repairs & maintenance
- −$2,837
- − Management
- −$2,837
- − Depreciation
- −$3,633
- Taxable income
- $16,659
- Est. tax owed @ 24.0%
- −$3,998
- After-tax cash flow
- $13,657/yr
For passive investors: Depreciation is non-cash, so a rental often shows a tax loss while cash-flowing — sheltering income. Rental losses are passive: they offset passive income freely, and up to $25,000/yr can offset ordinary (W-2) income if you actively participate and your MAGI is under $100k (phasing out to $0 by $150k); unused losses carry forward. On sale, claimed depreciation is recaptured at up to 25%, and gains may owe capital-gains tax (a 1031 exchange can defer both). Figures are a year-1 estimate at your 24.0% rate — not tax advice; consult a CPA.
Condition & rehab AI · 8 photos
This multi-family property requires significant repairs and maintenance, including roof, exterior, and landscaping work. Immediate cash flow potential with immediate value-adding opportunities.
Repairs flagged
- Major roof — Significant damage visible
- Major exterior siding — Peeling paint and siding issues
- Major exterior paint — Peeling paint
Value-add opportunities
- Both Paint and siding repairs — Improves curb appeal and interior condition
- Both Landscaping — Enhances curb appeal and property value
- Both Roof repair — Critical for structural integrity and long-term value
Renovation cost estimate screening
| Repair item | Severity | Est. cost |
|---|---|---|
| roof · Significant damage visible | Major | $15,000–50,000 |
| exterior siding · Peeling paint and siding issues | Major | $15,000–50,000 |
| exterior paint · Peeling paint | Major | $15,000–50,000 |
| Total estimated repair cost · 3 items | $45,000–150,000 |
Value-add ROI direction
- Both Paint and siding repairs — Improves curb appeal and interior condition ↑
- Both Landscaping — Enhances curb appeal and property value ↑
- Both Roof repair — Critical for structural integrity and long-term value ↑
ⓘ Cost ranges are severity-bucket heuristics (US national rule-of-thumb). Get contractor quotes + a written scope before underwriting a rehab budget.
Schools (NCES district)
- District
- Berrien County
- NCES district ID
- 1300390
- Math proficiency
- 48% ▲ 1.00%
- Reading proficiency
- 44% ▼ -3.00%
- Median HH income
- $33,858
- Composite
- 37.95/100
- National rank
- #4302
- State rank
- #24 of 174 in GA
Livability — Enigma
- Score
- 65/100
- State rank
- #212
- US rank
- #12734
Category grades
Schools grade is shown separately in the Schools card above.
Census & demographics
- City population
- 2,509
- Population (ZIP)
- 2,509
Population outlook (Berrien County) Hauer SSP2
- Today (2025)
- 17,982 people
- By 2030
- 17,282 · -3.9%
- By 2040
- 15,676 · -12.8%
- By 2050
- 13,876 · -22.8%
- By 2075
- 9,689 · -46.1%
- By 2100
- 6,430 · -64.2%
Race, ethnicity, and origin ACS 2023
- Neighborhood character
- Predominantly White (81%)
- Race & ethnicity
- White 81% Hispanic / Latino 13% Black 6% Two or more races 5%
- Hispanic origin (detail)
- Mexican 12%
- Common ancestry
- Lithuanian 2% Serbian 1%
- Foreign-born
- 1% · Canada
- Languages at home
- 90% English-only · Spanish 9%
Political lean MEDSL · Berrien
- 2024 margin
- Solid R (+69.8) · D 15.0% · R 84.8%
- 2008→2024 swing
- -16.6pp toward R · 2008: -53.2pp · 2024: -69.8pp
- All cycles
- 2024: R+69.8 2020: R+66.5 2016: R+66.5 2012: R+57.7 2008: R+53.2
Not yet ingested
- Civics
- —
Market trends
- HPI YoY
- ▲ 4.36%
- Current HPI
- 193.7436
- Rent YoY
- —
- Metro
- —
- State GDP YoY
- ▲ 2.66%
- F500 in state
- 28
Industry mix (Fortune 500 HQ in GA)
| Industry | F500 HQs | Revenue |
|---|---|---|
| Paper / Packaging | 2 | $29B |
|
||
| Retail | 1 | $160B |
|
||
| Transportation / Logistics | 1 | $91B |
|
||
| Airlines | 1 | $62B |
|
||
| Consumer Goods | 1 | $47B |
|
||
| Utilities | 1 | $25B |
|
||
Price history
+8.5% since first listed3 events — show timeline
- 2026-06-08 Sold (MLS) $135,500 SGMLS
- 2026-05-18 Pending — SGMLS
- 2026-05-15 Listed $124,900 SGMLS
Cash-flow waterfall
monthlySold comps — $/sqft
last 12 mo · ≤1 miLoading sold comps…