47755 Soft Moonlight · La Quinta, CA
Flood risk 1/10 · Minimal
- FEMA flood zone
- X (unshaded)
- Chance of flooding over 30 yrs
- 0.0%
- Est. flood insurance / yr
- $507 – $1,088
Fire risk 5/10 · Moderate
- Est. fire insurance / yr
- $659 – $1,223
Heat risk 10/10 · Severe
- Hot days now (above 114°F)
- 7 days/yr
- Hot days in 30 yrs
- 19 days/yr
Wind risk 1/10 · Minimal
- Chance of severe wind over 30 yrs
- —
Air-quality risk 4/10 · Minor
- Unhealthy air days now
- 4 days/yr
- Unhealthy air days in 30 yrs
- 5 days/yr
Risk factors via First Street. Map © Google.
Why this score? — see what drove the C- grade
The composite is a weighted blend of 9 inputs, each scored 0–100. Each bar is that input's sub-score; the figure is the points it added to the 100-point composite (weight × sub-score).
- ARV discount +15.0/15.0
- Cash flow +14.7/30.0
- DSCR +4.5/10.0
- 1% rule +4.3/10.0
- Rent growth +4.1/5.0
- Schools +3.8/10.0
- Livability +2.9/5.0
- Condition / age +2.5/5.0
- Appreciation +0.0/10.0
$429,900
🖨 Deal sheet 📄 Offer letter ✓ Due diligence
Listing remarks MLS
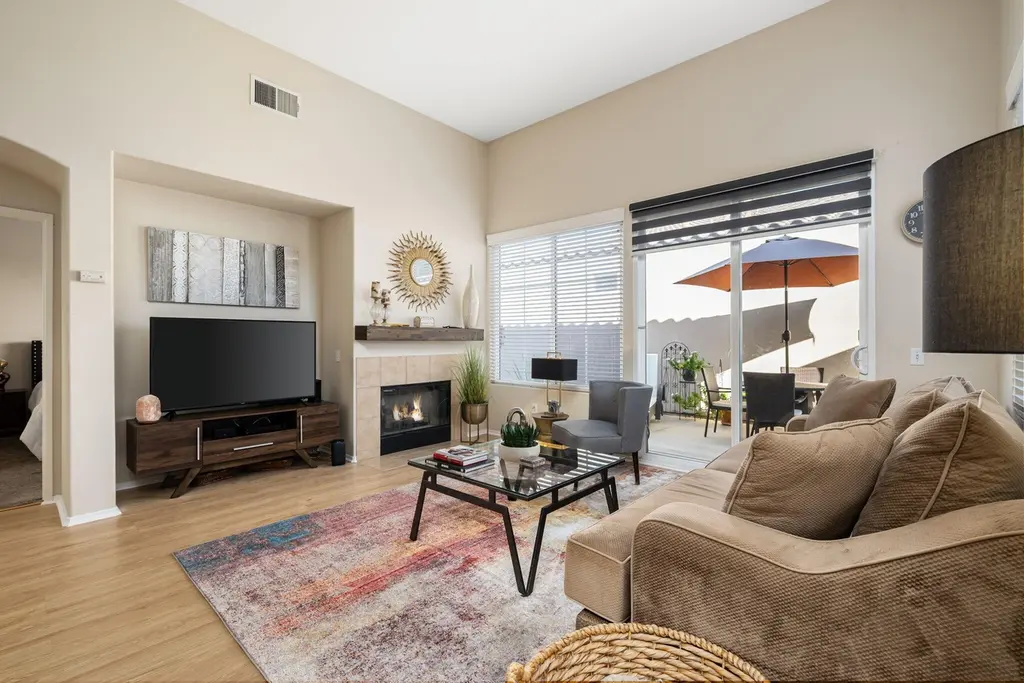
Seniors 55+, are you looking for affordable housing in La Quinta to call your own? Welcome to Watercolors. This may be the home for you! So this is how it works. Total purchase price, including the silent second, is $429,900. ($373,900 + City of La Quinta kicks in the $56,000, which is referred to as a silent second)= $429,900. Your loan amount would be based on $373,900 minus your down payment, up to 20% (this is not part of the $56,000). This charming home features three bedrooms, two bathrooms, and approximately 1,337 square feet of living space. Enjoy the convenience of an attached two-car garage with cabinets and a side courtyard with a patio and artificial turf. Step inside to discover an airy open floor plan, tall ceilings, and a cozy gas fireplace in the living room. The kitchen offers stainless steel appliances, a breakfast counter, and warm-tone cabinets. Additionally, you'll find a dedicated space for your washer and dryer with the above cabinets. There is a community pool, spa, and clubhouse. Watercolors is a moderate-income development that carries a silent second with the City of La Quinta. Potential buyers must meet income qualification criteria through the city of La Quinta and purchase as a primary residence. No rentals & no cash purchases. Low HOAS that include cable & internet. Close to dining, shopping, and more. Come and experience the perfect blend of comfort and convenience at Watercolors. The 2025 combined gross income limits are: 1 person: $62,651-$87,300; 2 people: $71,601-$99,750; 3 people: $80,551-$112,250; and 4 people: $89,501-$124,700. Like, who doesn't like downpayment assistance when purchasing a home?
Key facts
- 3,049 sq ft lot
- 2 garage spots
- Built 2006
Neighborhood map
What this means for you Summary
Snapshot
- This is a 3-bed/2.0-bath single-family listed at $430k.
Deal economics
- At list price, monthly cash flow is $108 ($1k/yr) — positive.
- The deal already cash-flows at list — no discount required.
- To meet the 1% rule (rent ≥ 1% of price), the offer needs to be $400k (6.9% below list).
- Recommended offer: $400k (6.9% below list) — sets the bar for 1% rule.
- Cap rate 6.6% vs local median 3.3% in La Quinta — top-decile yield for the area; either an underpriced asset or a hidden risk that comps aren't pricing in. Stress-test before assuming the spread holds.
Location & tenants
- Location reads 58/100 on livability (#694 in CA) — a working-class tenant base; expect higher turnover. Strengths: commute A-, employment B+, housing B+; Watch: schools D, amenities F, cost of living F.
- Desert Sands Unified (suburban): math 31% / reading 56% proficiency, ranked #199 of 517 in CA (top 38%) — families likely to look elsewhere, expect single-tenant / working-renter base with shorter leases.
- Market conditions: Rents rising fast (+6.5%/yr); 656 active listings in the ZIP; 40 comparable units currently listed for rent nearby; rentals lingering (median 44d on market — plan ~5-8 weeks vacancy on turnover, expect pricing pressure); 60% of comp listings sitting > 30 days — soft ceiling on asking rent; solid renter incomes; 9,195 units permitted in Riverside County in 2024 (1,512 in 5+ unit buildings).
- At $4,004/mo this rent would consume 48% of the median local household income ($99k/yr) (locally 1078% of renters already pay >50% of income on rent) — very limited rent-growth headroom before tenants either downsize or default.
Forward outlook
- Local home prices are declining (-3.0%/yr); year-one equity from $3k of loan paydown is wiped out by about $13k of value loss. Plan a longer hold.
- Riverside County population projected at +22% by 2050 — long-run rental-demand tailwind backs the buy-and-hold thesis.
Negotiation context
- It's been on market 29 days — a 2% lower offer ($423k) is reasonable based on typical stale-listing flexibility.
- 6 sale attempts since 10y ago with the ask held roughly flat each time — persistent listings suggest the price (not the market) is what's stuck; bring a comps-based counter.
- Current owner paid $273k; list at $430k implies a 58% gain — meaningful room to come down on a strong offer.
Risks & watch-outs
- Climate carrying-cost: moderate wildfire risk; extreme-heat days projected 7→19/yr by 2055 (HVAC capex compounding) — expect insurance premiums to compound above CPI over the hold.
Questions for the listing agent
- What does the HOA fee cover, when was the last increase, and are there any pending special assessments or reserve-fund shortfalls?
- Is there a deadline driving the sale (1031 exchange, divorce, estate, relocation)? That informs how much negotiation room exists.
- Schools are D-rated, which usually means shorter tenancies and higher turnover. Who's the typical renter profile here, and what's been the actual vacancy rate?
- What's the average days-on-market for RENTAL listings here right now (not sales)? A rising rental-DOM trend means longer vacancies and softer asking-rent achievability than the comps imply.
- What's the recent tenant-quality profile in this submarket — average credit score on applications, eviction rate, late-payment / NSF rate, and stable-employment percentage? A property-management company in the area should have these aggregated.
- How much new for-sale + rental construction is in the pipeline within 1–3 miles? Heavy new supply typically softens prices + rents 12–24 months out; constrained supply supports both.
Investment metrics
- 1% rule
- 0.93% ✗
- Cap rate
- 6.59%
- Cash-on-cash
- 1.07%
- DSCR
- 1.05
- GRM
- 8.9
CMA / ARV
- ARV (median comp)
- $644,628
- List price
- $429,900
- Delta
- -32.69%
- Verdict
- UNDERPRICED
- Comps
- 7 within 2.0 mi
Show comp detail 12 sales within ~0.75 mi
| Address | Dist | Beds/Ba | Sqft | Sold | Price | $/sf | Match |
|---|---|---|---|---|---|---|---|
| 79324 Rose Dawn | 0.04mi | 3/2.0 | 1,348 (+1%) | 0mo | $433,000 | $321 | 96 |
| 47825 Endless Sky | 0.08mi | 3/2.0 | 1,337 (0%) | 2mo | $422,900 | $316 | 95 |
| 47685 Dancing Butterfly | 0.14mi | 3/2.0 | 1,337 (0%) | 1mo | $425,000 | $318 | 92 |
| 79320 Rose Dawn | 0.05mi | 3/2.0 | 1,348 (+1%) | 6mo | $440,000 | $326 | 91 |
| 47615 Soft Moonlight Dr | 0.07mi | 3/2.0 | 1,348 (+1%) | 8mo | $443,000 | $329 | 89 |
| 47795 Endless Sky | 0.05mi | 3/2.0 | 1,348 (+1%) | 9mo | $380,000 | $282 | 89 |
| 47788 Dancing Butterfly | 0.09mi | 3/2.0 | 1,348 (+1%) | 8mo | $398,000 | $295 | 88 |
| 47776 Dancing Butterfly | 0.09mi | 3/2.0 | 1,348 (+1%) | 9mo | $320,000 | $237 | 87 |
| 79260 Cool Reflection | 0.11mi | 3/2.0 | 1,337 (0%) | 11mo | $358,000 | $268 | 85 |
| 47635 Soft Moonlight | 0.06mi | 2/2.0 (-1) | 1,231 (-8%) | 5mo | $349,000 | $284 | 75 |
| 47765 Dancing Butterfly | 0.13mi | 2/2.0 (-1) | 1,231 (-8%) | 9mo | $300,000 | $244 | 68 |
| 79270 Cool Reflection | 0.10mi | 2/2.0 (-1) | 1,231 (-8%) | 12mo | $471,000 | $383 | 66 |
Match score weights: distance 35% · size 25% · config 20% · recency 20%. Top-matched comps best support the ARV.
Projected returns pro-forma
-3.0% appreciation · 6.45% rent growth · sell at horizon
- IRR
- -10.7%
- Equity multiple
- 0.60×
- Total profit
- $-48,308
- Equity at exit
- $64,099
- IRR
- 3.0%
- Equity multiple
- 1.25×
- Total profit
- $30,578
- Equity at exit
- $37,170
Cash invested: $120,372 (down + closing). Projections, not guarantees.
Landlord ↔ Tenant lean methodology
- Overall (STATE)
- 18 Strongly Tenant-Friendly
- State California
- 18 Strongly Tenant-Friendly · D+13
- County
- — inherits STATE
- City
- — inherits STATE
ZIP-level market 92253
- Rents YoY
- 6.5%
- Active inventory
- 656
- Price-to-rent
- 8.9×
Monthly cashflow live
- Estimated rent
- $4,004 high interval (Pro) →
- Mortgage (P&I)
- −$2,254
- Tax from tax record
- −$306 /mo · $3,672/yr
- Insurance
- −$179
- HOA
- −$316
- Vacancy / Maint / Mgmt
- −$841
- Net cashflow
- $108
Break-even live
UW: 25.0% down · 7.5% · 30yr · 1.5% tax · 5.0% vac · 8.0% maint · 8.0% mgmt
Financing live
Cash to close
- Down payment
- $107,475
- Closing costs
- $12,897
- Reserves months
- —
- Total cash needed
- —
Loan-product check · same deal, 3 products live
Conventional
25% down · 7.5% · 30yr
- Down + closing
- —
- Monthly P&I
- —
- Monthly cashflow
- —
- DSCR
- —
- Eligible?
- —
Personal DTI + credit; lowest rate.
DSCR
20% down · 8.5% · 30yr
- Down + closing
- —
- Monthly P&I
- —
- Monthly cashflow
- —
- DSCR
- —
- Eligible?
- —
No personal income docs; deal must DSCR.
Hard money
10% down · 12.0% · 12mo
- Down + closing
- —
- Monthly P&I
- —
- Monthly cashflow
- —
- DSCR
- —
- Eligible?
- —
Short-term bridge; refi at stabilization.
Rent comps 40 comps
| Address | Beds | Baths | Sqft | Rent | $/sqft | DOM | Units | Dist |
|---|---|---|---|---|---|---|---|---|
| 47750 Adams St La Quinta, CA | 1.0–2.0 | 1.0–2.0 | 956 | $2,220 | $2.32 | 43d | 1 | 0.24mi |
| 47470 Aloe Way La Quinta, CA | 3.0–4.0 | 2.5–3.5 | 1793 | $3,104 | $1.73 | 3d | 14 | 0.29mi |
| 47870 Sumac St La Quinta, CA | 3.0 | 2.0 | 1760 | $4,175 | $2.37 | 43d | 1 | 0.58mi |
| 46896 Jefferson St Indio, CA | 2.0 | 2.0 | 1100 | $2,075 | $1.89 | 3d | 2 | 0.84mi |
| 79930 Fiesta Dr La Quinta, CA | 3.0 | 2.0 | 1828 | $5,500 | $3.01 | 43d | 1 | 0.87mi |
| 45930 Las Colinas La Quinta, CA | 3.0 | 2.0 | 1500 | $2,850 | $1.90 | 24d | 1 | 0.93mi |
| 79679 Carmel Valley Ave Indio, CA | 3.0 | 2.0 | 1529 | $2,900 | $1.90 | 22d | 1 | 0.95mi |
| 45809 Crosswater St Indio, CA | 3.0 | 2.0 | 1529 | $6,000 | $3.92 | 43d | 1 | 0.98mi |
| 48114 Calle Seranas La Quinta, CA | 2.0 | 2.0 | 1466 | $6,000 | $4.09 | 43d | 1 | 1.01mi |
| 46890 Highland Palms Dr La Quinta, CA | 3.0 | 2.0 | 1588 | $8,500 | $5.35 | 43d | 1 | 1.02mi |
| 46890 Highland Palms Dr La Quinta, CA | 3.0 | 2.0 | 1588 | $8,500 | $5.35 | 5d | 1 | 1.02mi |
| 49100 Tango Ct La Quinta, CA | 3.0 | 2.5 | 1804 | $3,000 | $1.66 | 43d | 1 | 1.03mi |
| 48110 Calle Seranas La Quinta, CA | 3.0 | 2.0 | 1581 | $5,500 | $3.48 | 43d | 1 | 1.03mi |
| 80071 Palm Circle Dr La Quinta, CA | 3.0 | 2.0 | 1650 | $2,850 | $1.73 | 24d | 1 | 1.04mi |
| 79631 Half Moon Bay Dr Indio, CA | 2.0 | 2.5 | 1703 | $3,600 | $2.11 | 5d | 1 | 1.06mi |
| 46560 Cameo Palms Dr La Quinta, CA | 3.0 | 2.0 | 1782 | $4,500 | $2.53 | 24d | 1 | 1.07mi |
| 49005 Washington St La Quinta, CA | 2.0 | 2.0 | 1368 | $2,950 | $2.16 | 18d | 1 | 1.12mi |
| 78700 Bottlebrush Dr La Quinta, CA | 3.0 | 2.0 | 1302 | $2,800 | $2.15 | 43d | 1 | 1.14mi |
| 45420 Desert Fox Dr La Quinta, CA | 3.0 | 3.0 | 1830 | $6,000 | $3.28 | 43d | 1 | 1.15mi |
| 80346 Indian Springs Dr Indio, CA | 2.0 | 2.5 | 1713 | $3,500 | $2.04 | 18d | 1 | 1.23mi |
| 48602 Paseo Tarazo La Quinta, CA | 2.0 | 2.0 | 1562 | $3,100 | $1.98 | 43d | 1 | 1.30mi |
| 79170 Diane Dr La Quinta, CA | 4.0 | 2.0 | 1618 | $6,500 | $4.02 | 18d | 1 | 1.31mi |
| 78795 Birchcrest Cir La Quinta, CA | 4.0 | 2.0 | 1566 | $3,499 | $2.23 | 43d | 1 | 1.32mi |
| 78205 Cortez Ln #178 Indian Wells, CA | 2.0 | 2.0 | 1152 | $3,000 | $2.60 | 43d | 1 | 1.32mi |
| 45385 Big Canyon St Indio, CA | 3.0 | 2.0 | 1529 | $3,200 | $2.09 | 43d | 1 | 1.32mi |
| 78780 Birchcrest Cir La Quinta, CA | 3.0 | 2.0 | 1411 | $3,500 | $2.48 | 22d | 1 | 1.33mi |
| 46568 Arapahoe Unit A Indian Wells, CA | 2.0 | 2.0 | 1446 | $3,200 | $2.21 | 24d | 1 | 1.35mi |
| 46644 Arapahoe Unit A Indian Wells, CA | 2.0 | 2.0 | 1446 | $5,000 | $3.46 | 43d | 1 | 1.36mi |
| 46642 Arapahoe Unit B Indian Wells, CA | 2.0 | 2.0 | 1446 | $4,750 | $3.28 | 43d | 1 | 1.36mi |
| 46632 Arapahoe Unit B Indian Wells, CA | 2.0 | 2.0 | 1446 | $4,200 | $2.90 | 43d | 1 | 1.36mi |
| 45439 Shaugnessy Dr Indio, CA | 2.0 | 2.5 | 1703 | $5,500 | $3.23 | 43d | 1 | 1.38mi |
| 80472 Suncastle Rd Indio, CA | 4.0 | 2.0 | 1569 | $3,100 | $1.98 | 43d | 1 | 1.38mi |
| 48625 Calle Esperanza La Quinta, CA | 3.0 | 2.0 | 1852 | $2,999 | $1.62 | 24d | 1 | 1.38mi |
| 78130 Cortez Ln Indian Wells, CA | 1.0–2.0 | 1.0–2.0 | 874 | $3,500 | $4.00 | 43d | 2 | 1.39mi |
| 45233 Big Canyon St Indio, CA | 3.0 | 2.0 | 1529 | $6,000 | $3.92 | 43d | 1 | 1.39mi |
| 47412 Harbour Lights Ln Indio, CA | 3.0 | 2.0 | 1650 | $4,000 | $2.42 | 12d | 1 | 1.39mi |
| 45055 Coldbrook Ln La Quinta, CA | 4.0 | 2.0 | 1566 | $3,199 | $2.04 | 43d | 1 | 1.40mi |
| 46594 Arapahoe Indian Wells, CA | 3.0 | 3.0 | 1791 | $7,900 | $4.41 | 43d | 1 | 1.43mi |
| 46596 Arapahoe Indian Wells, CA | 3.0 | 3.0 | 1791 | $6,000 | $3.35 | 22d | 1 | 1.43mi |
| 79948 Bethpage Ave Indio, CA | 3.0 | 2.0 | 1529 | $4,500 | $2.94 | 43d | 1 | 1.47mi |
HOA detail
- Monthly dues
- $316 · $3,792/yr
- Likely covers
- watergasinternetcablepool
Listing history 35 events
-
2026-06-18days on market $429,900 Active 29 DOM
-
2026-06-17days on market $429,900 Active 28 DOM
-
2026-06-16days on market $429,900 Active 27 DOM
-
2026-06-15days on market $429,900 Active 26 DOM
-
2026-06-13days on market $429,900 Active 24 DOM
-
2026-06-09days on market $429,900 Active 20 DOM
-
2026-06-08days on market $429,900 Active 19 DOM
-
2026-06-07days on market $429,900 Active 18 DOM
-
2026-06-04days on market $429,900 Active 15 DOM
-
2026-06-03days on market $429,900 Active 14 DOM
-
2026-06-02days on market $429,900 Active 13 DOM
-
2026-06-01days on market $429,900 Active 12 DOM
-
2026-05-31days on market $429,900 Active 11 DOM
-
2026-05-20historical
Show marketing remark (1675 chars)
Seniors 55+, are you looking for affordable housing in La Quinta to call your own? Welcome to Watercolors. This may be the home for you! So this is how it works. Total purchase price, including the silent second, is $429,900. ($373,900 + City of La Quinta kicks in the $56,000, which is referred to as a silent second)= $429,900. Your loan amount would be based on $373,900 minus your down payment, up to 20% (this is not part of the $56,000). This charming home features three bedrooms, two bathrooms, and approximately 1,337 square feet of living space. Enjoy the convenience of an attached two-car garage with cabinets and a side courtyard with a patio and artificial turf. Step inside to discover an airy open floor plan, tall ceilings, and a cozy gas fireplace in the living room. The kitchen offers stainless steel appliances, a breakfast counter, and warm-tone cabinets. Additionally, you'll find a dedicated space for your washer and dryer with the above cabinets. There is a community pool, spa, and clubhouse. Watercolors is a moderate-income development that carries a silent second with the City of La Quinta. Potential buyers must meet income qualification criteria through the city of La Quinta and purchase as a primary residence. No rentals & no cash purchases. Low HOAS that include cable & internet. Close to dining, shopping, and more. Come and experience the perfect blend of comfort and convenience at Watercolors. The 2025 combined gross income limits are: 1 person: $62,651-$87,300; 2 people: $71,601-$99,750; 3 people: $80,551-$112,250; and 4 people: $89,501-$124,700. Like, who doesn't like downpayment assistance when purchasing a home?
-
2026-05-20$429,900 Active 1675-char remark
Show marketing remark (1675 chars)
Seniors 55+, are you looking for affordable housing in La Quinta to call your own? Welcome to Watercolors. This may be the home for you! So this is how it works. Total purchase price, including the silent second, is $429,900. ($373,900 + City of La Quinta kicks in the $56,000, which is referred to as a silent second)= $429,900. Your loan amount would be based on $373,900 minus your down payment, up to 20% (this is not part of the $56,000). This charming home features three bedrooms, two bathrooms, and approximately 1,337 square feet of living space. Enjoy the convenience of an attached two-car garage with cabinets and a side courtyard with a patio and artificial turf. Step inside to discover an airy open floor plan, tall ceilings, and a cozy gas fireplace in the living room. The kitchen offers stainless steel appliances, a breakfast counter, and warm-tone cabinets. Additionally, you'll find a dedicated space for your washer and dryer with the above cabinets. There is a community pool, spa, and clubhouse. Watercolors is a moderate-income development that carries a silent second with the City of La Quinta. Potential buyers must meet income qualification criteria through the city of La Quinta and purchase as a primary residence. No rentals & no cash purchases. Low HOAS that include cable & internet. Close to dining, shopping, and more. Come and experience the perfect blend of comfort and convenience at Watercolors. The 2025 combined gross income limits are: 1 person: $62,651-$87,300; 2 people: $71,601-$99,750; 3 people: $80,551-$112,250; and 4 people: $89,501-$124,700. Like, who doesn't like downpayment assistance when purchasing a home?
-
2026-04-03price $433,900
-
2026-03-06price $438,800
-
2026-02-13price $382,800
-
2025-11-15$387,800 Active
-
2023-11-03$445,000 Active
-
2019-01-29soldstatus $272,900 Closed
-
2018-12-05status Pending
-
2018-12-03price $274,900
-
2018-11-17price $279,900
-
2018-10-26price $289,900
-
2018-09-25$299,900 Active
-
2017-10-18historical
-
2017-10-18historical
-
2017-10-15$199,000
-
2017-05-31soldstatus $204,000 Closed Sale
-
2017-02-23status Pending Sale
-
2017-01-30price $143,000
-
2016-10-18price $203,000
-
2016-08-31price $269,500
-
2016-06-05$269,000 Active
ⓘ Source: listings_history table (triggers on properties + properties_extension) + one-shot
backfill from property_details.listing_events for pre-trigger history.
Tax reassessment forecast CA · Resets to sale price
- Current annual tax
- $3,672 · $306/mo
- Projected year-2 tax
- $3,672 · $306/mo
- Expected delta
- $0/yr ($0/mo · 0.0%)
ⓘ Screening estimate from a state-policy table — verify with the county assessor before closing.
Climate risk First Street
- Flood 1/10 Low FEMA zone X (unshaded) · 0% chance over 30 yrs
- Wildfire 5/10 Major
- Heat 10/10 Extreme 7 d/yr ≥114°F today · 19 d/yr by 30 yrs out
- Wind 1/10 Low
- Air quality 4/10 Moderate 4 unhealthy d/yr today · 5 by 30 yrs out
Nearby sold comps map
Loading sold comps map…
Walkable amenities ~0.75 mi
Loading nearby amenities…
Taxation est. · year 1
- Rental income
- $48,050
- − Mortgage interest
- −$24,081
- − Property taxes
- −$3,672
- − Insurance
- −$2,150
- − Repairs & maintenance
- −$3,844
- − Management
- −$3,844
- − HOA
- −$3,792
- − Depreciation
- −$12,506
- Taxable loss
- −$5,839
- Est. tax savings @ 24.0%
- +$1,401
- After-tax cash flow
- $2,694/yr
For passive investors: Depreciation is non-cash, so a rental often shows a tax loss while cash-flowing — sheltering income. Rental losses are passive: they offset passive income freely, and up to $25,000/yr can offset ordinary (W-2) income if you actively participate and your MAGI is under $100k (phasing out to $0 by $150k); unused losses carry forward. On sale, claimed depreciation is recaptured at up to 25%, and gains may owe capital-gains tax (a 1031 exchange can defer both). Figures are a year-1 estimate at your 24.0% rate — not tax advice; consult a CPA.
Schools (NCES district)
- District
- Desert Sands Unified
- NCES district ID
- 0611110
- Math proficiency
- 31% ▼ -4.00%
- Reading proficiency
- 56% ▲ 7.00%
- Median HH income
- $54,957
- Composite
- 37.77/100
- National rank
- #4346
- State rank
- #199 of 517 in CA
Livability — La Quinta
- Score
- 58/100
- State rank
- #694
- US rank
- #21080
Category grades
Schools grade is shown separately in the Schools card above.
Census & demographics
- Census place
- La Quinta, CA
- County
- Riverside County · 2,287,001 people
- City population
- 38,666
- Metro
- Riverside-San Bernardino-Ontario, CA
- Population (ZIP)
- 38,666
- Household income
- $99,277
- Rent vs Own
- Severe rent burden
- 1078.0
Population outlook (Riverside County) Hauer SSP2
- Today (2025)
- 2,664,475 people
- By 2030
- 2,802,692 · +5.2%
- By 2040
- 3,050,904 · +14.5%
- By 2050
- 3,256,783 · +22.2%
- By 2075
- 3,655,058 · +37.2%
- By 2100
- 3,766,594 · +41.4%
Race, ethnicity, and origin ACS 2023
- Neighborhood character
- Diverse neighborhood (Simpson 0.57)
- Race & ethnicity
- White 54% Hispanic / Latino 37% Two or more races 19% Asian 4% Native American 1% Black 1%
- Hispanic origin (detail)
- Mexican 34%
- Common ancestry
- Romanian 2% Lithuanian 2% Slovak 1%
- Foreign-born
- 15% · Canada, China, Vietnam
- Languages at home
- 71% English-only · Spanish 24% Tagalog/Filipino 1% Chinese 1%
Political lean MEDSL · Riverside
- 2024 margin
- Toss-up / Even · D 48.0% · R 49.3% · Other 2.6%
- 2008→2024 swing
- -3.6pp toward R · 2008: 2.3pp · 2024: -1.3pp
- All cycles
- 2024: R+1.3 2020: D+8.0 2016: D+4.3 2012: R+0.4 2008: D+2.3
Not yet ingested
- Civics
- —
Market trends
- HPI YoY
- ▼ -263.65%
- Current HPI
- 281.8665
- Rent YoY
- ▲ 6.45%
- Metro
- Riverside-San Bernardino-Ontario, CA
- State GDP YoY
- ▲ 3.21%
- F500 in state
- 116
Industry mix (Fortune 500 HQ in CA)
| Industry | F500 HQs | Revenue |
|---|---|---|
| Technology | 27 | $1,492B |
|
||
| Financial Services | 3 | $174B |
|
||
| Retail | 3 | $44B |
|
||
| Insurance | 3 | $26B |
|
||
| Media / Entertainment | 2 | $115B |
|
||
| Pharmaceuticals / Biotech | 2 | $62B |
|
||
Price history
+59.8% since first listed22 events — show timeline
- 2026-05-20 Listing Removed — GPSMLS
- 2026-05-20 Listed $429,900 GPSMLS
- 2026-04-03 Price Changed $433,900 GPSMLS
- 2026-03-06 Price Changed $438,800 GPSMLS
- 2026-02-13 Price Changed $382,800 GPSMLS
- 2025-11-15 Listed $387,800 GPSMLS
- 2023-11-03 Listed $445,000 GPSMLS
- 2019-01-29 Sold (MLS) $272,900 GPSMLS
- 2018-12-05 Pending — GPSMLS
- 2018-12-03 Price Changed $274,900 GPSMLS
- 2018-11-17 Price Changed $279,900 GPSMLS
- 2018-10-26 Price Changed $289,900 GPSMLS
- 2018-09-25 Listed $299,900 GPSMLS
- 2017-10-18 Listing Removed — CRMLS
- 2017-10-18 Listing Removed — CRMLS
- 2017-10-15 Listed $199,000 CRMLS
- 2017-05-31 Sold (MLS) $204,000 CRMLS
- 2017-02-23 Pending — CRMLS
- 2017-01-30 Price Changed $143,000 CRMLS
- 2016-10-18 Price Changed $203,000 CRMLS
- 2016-08-31 Price Changed $269,500 CRMLS
- 2016-06-05 Listed $269,000 CRMLS
Property tax history
+1.5%/yrLatest (2025): $3,672 · +3.0% YoY. Source: county tax records.
Cash-flow waterfall
monthlySold comps — $/sqft
last 12 mo · ≤1 miLoading sold comps…