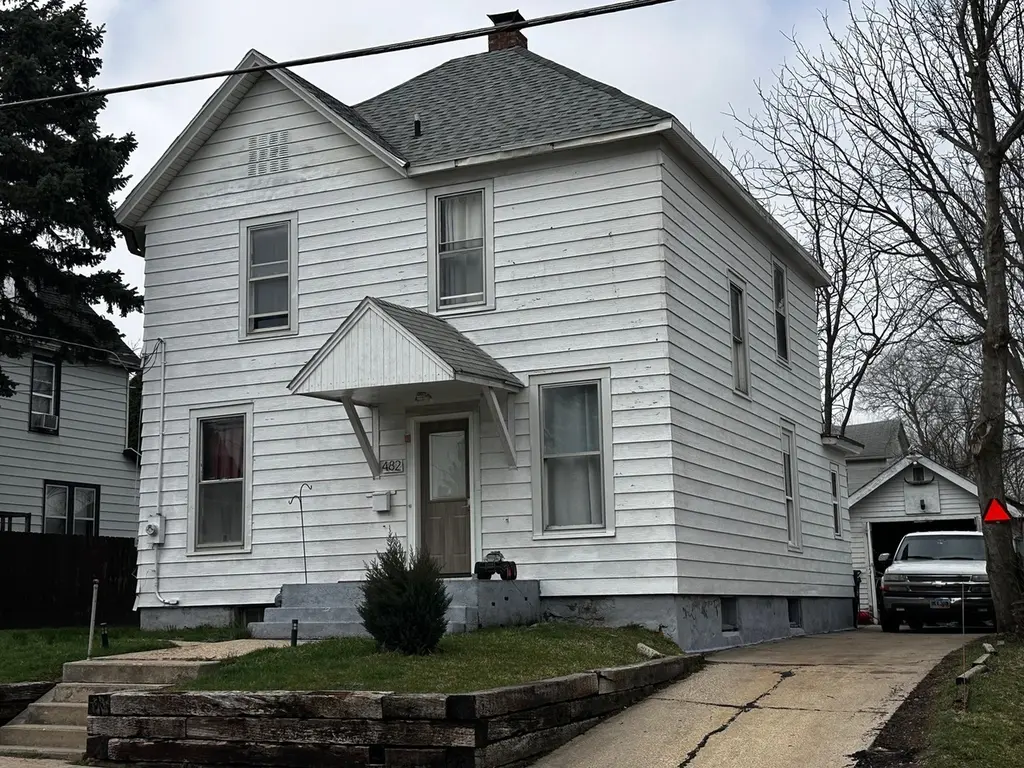
482 S Float Ave · Freeport, IL
Flood risk 1/10 · Minimal
- FEMA flood zone
- X (unshaded)
- Chance of flooding over 30 yrs
- 0.0%
- Est. flood insurance / yr
- $507 – $1,088
Fire risk 1/10 · Minimal
- Est. fire insurance / yr
- $804 – $1,492
Heat risk 3/10 · Minor
- Hot days now (above 101°F)
- 7 days/yr
- Hot days in 30 yrs
- 15 days/yr
Wind risk 2/10 · Minimal
- Chance of severe wind over 30 yrs
- —
Air-quality risk 2/10 · Minimal
- Unhealthy air days now
- 1 days/yr
- Unhealthy air days in 30 yrs
- 2 days/yr
Risk factors via First Street. Map © Google.
Why this score? — see what drove the C grade
The composite is a weighted blend of 9 inputs, each scored 0–100. Each bar is that input's sub-score; the figure is the points it added to the 100-point composite (weight × sub-score).
- Cash flow +30.0/30.0
- 1% rule +10.0/10.0
- DSCR +10.0/10.0
- Livability +3.6/5.0
- Rent growth +2.5/5.0
- Condition / age +2.5/5.0
- Schools +1.0/10.0
- ARV discount +0.0/15.0
- Appreciation +0.0/10.0
$89,000
🖨 Deal sheet 📄 Offer letter ✓ Due diligence
Listing remarks MLS
Spacious home, ready to move in! Beautiful living and dining space, large bedrooms. Roof new within 4 years; new water heater; recently serviced furnace in good working condition. Come have a look! No central air.
Key facts
- 5,227 sq ft lot
- Parking
- Built 1897
Neighborhood map
What this means for you Summary
Snapshot
- This is a 4-bed/1.5-bath single-family listed at $89k.
Deal economics
- At list price, monthly cash flow is $538 ($6k/yr) — positive.
- The deal already cash-flows at list — no discount required.
- Meets the 1% rule at list price ($1k rent vs $89k).
- Recommended offer: $88k (1.5% below list) — sets the bar for market timing.
- Cap rate 13.6% vs local median 5.8% in Freeport — top-decile yield for the area; either an underpriced asset or a hidden risk that comps aren't pricing in. Stress-test before assuming the spread holds.
Location & tenants
- Location reads 72/100 on livability (#302 in IL) — a middle-class / working-renter tenant base. Strengths: cost of living A+, health & safety A+, housing A-; Watch: schools F, commute F, employment F.
- Freeport SD 145 (town): math 11% / reading 12% proficiency, ranked #565 of 620 in IL (top 91%) — low school quality limits family demand, transient renter base, plan for 1-2y turnover; 65% free/reduced lunch — lower-income household profile, screen leases tightly.
- Market conditions: 197 active listings in the ZIP; 4 comparable units currently listed for rent nearby; rentals lingering (median 44d on market — plan ~5-8 weeks vacancy on turnover, expect pricing pressure); 100% of comp listings sitting > 30 days — soft ceiling on asking rent; 7 units permitted in Stephenson County in 2024 (0 in 5+ unit buildings).
Forward outlook
- Local home prices are declining (-3.0%/yr); year-one equity from $615 of loan paydown is wiped out by about $3k of value loss. Plan a longer hold.
- Stephenson County population projected at -29% by 2050 — secular population decline; favor cash flow + early exit over multi-decade hold.
- At projected returns (-3.0% appreciation + 3.0% rent growth), your $25k cash investment doubles in ~5 years — after that, you're playing with house money.
Negotiation context
- It's been on market 15 days — a 2% lower offer ($88k) is reasonable based on typical stale-listing flexibility.
- 3 sale attempts since 4y ago with the ask held roughly flat each time — persistent listings suggest the price (not the market) is what's stuck; bring a comps-based counter.
- Current owner paid $25k; list at $89k implies a 256% gain — meaningful room to come down on a strong offer.
Risks & watch-outs
- Watch-outs: built in 1897 — expect roof / HVAC / electrical / plumbing capex.
Questions for the listing agent
- Built in 1897 — when were the roof, HVAC, electrical panel, plumbing, and water heater last replaced?
- Is there a deadline driving the sale (1031 exchange, divorce, estate, relocation)? That informs how much negotiation room exists.
- Schools are F-rated, which usually means shorter tenancies and higher turnover. Who's the typical renter profile here, and what's been the actual vacancy rate?
- What's the average days-on-market for RENTAL listings here right now (not sales)? A rising rental-DOM trend means longer vacancies and softer asking-rent achievability than the comps imply.
- What's the recent tenant-quality profile in this submarket — average credit score on applications, eviction rate, late-payment / NSF rate, and stable-employment percentage? A property-management company in the area should have these aggregated.
- How much new for-sale + rental construction is in the pipeline within 1–3 miles? Heavy new supply typically softens prices + rents 12–24 months out; constrained supply supports both.
Investment metrics
- 1% rule
- 1.54% ✓
- Cap rate
- 13.55%
- Cash-on-cash
- 25.92%
- DSCR
- 2.15
- GRM
- 5.4
CMA / ARV
- ARV (on-the-fly)
- $62,496
- Comps found
- 12
Show comp detail 12 sales within ~0.75 mi
| Address | Dist | Beds/Ba | Sqft | Sold | Price | $/sf | Match |
|---|---|---|---|---|---|---|---|
| 482 S Float Ave | 0.00mi | 4/1.5 | 1,736 (0%) | 1mo | $85,000 | $49 | 100 |
| 632 E Iroquois | 0.16mi | 3/1.5 (-1) | 1,672 (-4%) | 6mo | $60,000 | $36 | 76 |
| 25 W Pleasant St | 0.31mi | 4/1.0 | 1,788 (+3%) | 8mo | $28,000 | $16 | 72 |
| 535 E Madison St | 0.11mi | 4/1.0 | 1,500 (-14%) | 3mo | $27,000 | $18 | 68 |
| 1231 S Float Ave | 0.52mi | 3/1.0 (-1) | 1,734 (-0%) | 1mo | $43,000 | $25 | 68 |
| 708 E Iroquois St | 0.20mi | 4/1.0 | 1,983 (+14%) | 2mo | $34,000 | $17 | 63 |
| 105 W Empire St | 0.63mi | 4/1.5 | 1,809 (+4%) | 8mo | $139,900 | $77 | 57 |
| 509 W Chestnut St | 0.72mi | 4/1.0 | 1,702 (-2%) | 9mo | $55,555 | $33 | 54 |
| 236 W Winnifred St | 0.74mi | 3/2.0 (-1) | 1,681 (-3%) | 9mo | $78,000 | $46 | 46 |
| 337 W American St | 0.65mi | 3/1.0 (-1) | 1,630 (-6%) | 9mo | $91,000 | $56 | 45 |
| 314 W Chestnut | 0.58mi | 3/1.0 (-1) | 1,542 (-11%) | 7mo | $81,000 | $53 | 41 |
| 409 W Avon St | 0.61mi | 3/1.0 (-1) | 1,490 (-14%) | 3mo | $35,500 | $24 | 38 |
Match score weights: distance 35% · size 25% · config 20% · recency 20%. Top-matched comps best support the ARV.
Projected returns pro-forma
-3.0% appreciation · 3.0% rent growth · sell at horizon
- IRR
- 19.6%
- Equity multiple
- 1.80×
- Total profit
- $19,839
- Equity at exit
- $13,270
- IRR
- 27.9%
- Equity multiple
- 3.46×
- Total profit
- $61,330
- Equity at exit
- $7,695
Cash invested: $24,920 (down + closing). Projections, not guarantees.
Landlord ↔ Tenant lean methodology
- Overall (STATE)
- 43 Moderately Tenant-Leaning
- State Illinois
- 43 Moderately Tenant-Leaning · D+7
- County
- — inherits STATE
- City
- — inherits STATE
ZIP-level market 61032
- Home prices YoY
- -19.5%
- Active inventory
- 197
- Price-to-rent
- 5.4×
Monthly cashflow live
- Estimated rent
- $1,372 medium interval (Pro) →
- Mortgage (P&I)
- −$467
- Tax from tax record
- −$42 /mo · $501/yr
- Insurance
- −$37
- HOA
- −$0
- Vacancy / Maint / Mgmt
- −$288
- Net cashflow
- $538
Break-even live
UW: 25.0% down · 7.5% · 30yr · 1.5% tax · 5.0% vac · 8.0% maint · 8.0% mgmt
Financing live
Cash to close
- Down payment
- $22,250
- Closing costs
- $2,670
- Reserves months
- —
- Total cash needed
- —
Loan-product check · same deal, 3 products live
Conventional
25% down · 7.5% · 30yr
- Down + closing
- —
- Monthly P&I
- —
- Monthly cashflow
- —
- DSCR
- —
- Eligible?
- —
Personal DTI + credit; lowest rate.
DSCR
20% down · 8.5% · 30yr
- Down + closing
- —
- Monthly P&I
- —
- Monthly cashflow
- —
- DSCR
- —
- Eligible?
- —
No personal income docs; deal must DSCR.
Hard money
10% down · 12.0% · 12mo
- Down + closing
- —
- Monthly P&I
- —
- Monthly cashflow
- —
- DSCR
- —
- Eligible?
- —
Short-term bridge; refi at stabilization.
Rent comps 4 comps
| Address | Beds | Baths | Sqft | Rent | $/sqft | DOM | Units | Dist |
|---|---|---|---|---|---|---|---|---|
| 816 S James Ave Freeport, IL | 3.0 | 1.0 | 1152 | $1,325 | $1.15 | 43d | 1 | 0.48mi |
| 320 W Clark St Freeport, IL | 4.0 | 1.0 | 1509 | $1,395 | $0.92 | 43d | 1 | 0.75mi |
| 435 N Apple Ave Freeport, IL | 4.0 | 2.0 | 1500 | $1,450 | $0.97 | 43d | 1 | 0.86mi |
| 742 W Homer St Freeport, IL | 3.0 | 1.0 | 1434 | $1,325 | $0.92 | 43d | 1 | 0.97mi |
Listing history 8 events
-
2026-04-18status Pending
Show marketing remark (213 chars)
Spacious home, ready to move in! Beautiful living and dining space, large bedrooms. Roof new within 4 years; new water heater; recently serviced furnace in good working condition. Come have a look! No central air.
-
2026-04-18status Pending 213-char remark
Show marketing remark (213 chars)
Spacious home, ready to move in! Beautiful living and dining space, large bedrooms. Roof new within 4 years; new water heater; recently serviced furnace in good working condition. Come have a look! No central air.
-
2026-04-03$89,000 Active
Show marketing remark (213 chars)
Spacious home, ready to move in! Beautiful living and dining space, large bedrooms. Roof new within 4 years; new water heater; recently serviced furnace in good working condition. Come have a look! No central air.
-
2026-04-03$89,000 Active 213-char remark
Show marketing remark (213 chars)
Spacious home, ready to move in! Beautiful living and dining space, large bedrooms. Roof new within 4 years; new water heater; recently serviced furnace in good working condition. Come have a look! No central air.
-
2022-02-22soldstatus $25,000
-
2022-02-18soldstatus $25,000 197-char remark
Show marketing remark (197 chars)
Great value: 4 BR 2 bath maintenance free home with nice woodwork and double staircases. Large yard and newer roof. 1 stall garage in poor condition. Sold as is , no fha/usda type financing please
-
2022-01-24$29,900 197-char remark
Show marketing remark (197 chars)
Great value: 4 BR 2 bath maintenance free home with nice woodwork and double staircases. Large yard and newer roof. 1 stall garage in poor condition. Sold as is , no fha/usda type financing please
-
2014-05-30soldstatus $11,300
ⓘ Source: listings_history table (triggers on properties + properties_extension) + one-shot
backfill from property_details.listing_events for pre-trigger history.
Tax reassessment forecast IL · Partial reset (capped growth)
- Current annual tax
- $501 · $42/mo
- Projected year-2 tax
- $1,261 · $105/mo
- Expected delta
- +$760/yr (+$63/mo · 151.7%)
ⓘ Screening estimate from a state-policy table — verify with the county assessor before closing.
Climate risk First Street
- Flood 1/10 Low FEMA zone X (unshaded) · 0% chance over 30 yrs
- Wildfire 1/10 Low
- Heat 3/10 Moderate 7 d/yr ≥101°F today · 15 d/yr by 30 yrs out
- Wind 2/10 Low
- Air quality 2/10 Low 1 unhealthy d/yr today · 2 by 30 yrs out
Nearby sold comps map
Loading sold comps map…
Walkable amenities ~0.75 mi
Loading nearby amenities…
Taxation est. · year 1
- Rental income
- $16,463
- − Mortgage interest
- −$4,985
- − Property taxes
- −$501
- − Insurance
- −$445
- − Repairs & maintenance
- −$1,317
- − Management
- −$1,317
- − Depreciation
- −$2,589
- Taxable income
- $5,309
- Est. tax owed @ 24.0%
- −$1,274
- After-tax cash flow
- $5,185/yr
For passive investors: Depreciation is non-cash, so a rental often shows a tax loss while cash-flowing — sheltering income. Rental losses are passive: they offset passive income freely, and up to $25,000/yr can offset ordinary (W-2) income if you actively participate and your MAGI is under $100k (phasing out to $0 by $150k); unused losses carry forward. On sale, claimed depreciation is recaptured at up to 25%, and gains may owe capital-gains tax (a 1031 exchange can defer both). Figures are a year-1 estimate at your 24.0% rate — not tax advice; consult a CPA.
Schools (NCES district)
- District
- Freeport SD 145
- NCES district ID
- 1715900
- Math proficiency
- 11% ▼ -3.00%
- Reading proficiency
- 12% ▼ -5.00%
- Median HH income
- $39,803
- Composite
- 9.89/100
- National rank
- #9821
- State rank
- #565 of 620 in IL
Livability — Freeport
- Score
- 72/100
- State rank
- #302
- US rank
- #5927
Category grades
Schools grade is shown separately in the Schools card above.
Census & demographics
- Census place
- Freeport, IL
- Population (ZIP)
- 29,072
Population outlook (Stephenson County) Hauer SSP2
- Today (2025)
- 41,802 people
- By 2030
- 39,487 · -5.5%
- By 2040
- 34,534 · -17.4%
- By 2050
- 29,693 · -29.0%
- By 2075
- 21,196 · -49.3%
- By 2100
- 14,596 · -65.1%
Race, ethnicity, and origin ACS 2023
- Neighborhood character
- Predominantly White (73%)
- Race & ethnicity
- White 73% Black 12% Two or more races 10% Hispanic / Latino 6% Asian 1%
- Hispanic origin (detail)
- Mexican 4% Puerto Rican 1%
- Common ancestry
- Iranian 3% Romanian 2% Lithuanian 2%
- Foreign-born
- 3% · Canada
- Languages at home
- 96% English-only · Spanish 3% Other Indo-European 1%
Political lean MEDSL · Stephenson
- 2024 margin
- R (+19.4) · D 39.5% · R 58.9% · Other 1.6%
- 2008→2024 swing
- -26.1pp toward R · 2008: 6.7pp · 2024: -19.4pp
- All cycles
- 2024: R+19.4 2020: R+15.7 2016: R+17.0 2012: R+4.6 2008: D+6.7
Not yet ingested
- Civics
- —
Market trends
- HPI YoY
- ▼ -39.75%
- Current HPI
- 163.677
- Rent YoY
- —
- Metro
- —
- State GDP YoY
- ▲ 1.59%
- F500 in state
- 60
Industry mix (Fortune 500 HQ in IL)
| Industry | F500 HQs | Revenue |
|---|---|---|
| Insurance | 4 | $201B |
|
||
| Consumer Goods | 4 | $87B |
|
||
| Industrial Machinery | 3 | $64B |
|
||
| Healthcare | 2 | $55B |
|
||
| Retail / Pharmacy | 1 | $148B |
|
||
| Agriculture / Food | 1 | $86B |
|
||
Price history
+687.6% since first listed8 events — show timeline
- 2026-04-18 Pending — MRED as Distributed by MLS Grid
- 2026-04-18 Pending — NWIAR
- 2026-04-03 Listed $89,000 NWIAR
- 2026-04-03 Listed $89,000 MRED as Distributed by MLS Grid
- 2022-02-22 Sold (Public Records) $25,000 Public Records
- 2022-02-18 Sold (MLS) $25,000 NWIAR
- 2022-01-24 Listed $29,900 NWIAR
- 2014-05-30 Sold (Public Records) $11,300 Public Records
Property tax history
-0.8%/yrLatest (2024): $501 · -4.6% YoY. Source: county tax records.
Cash-flow waterfall
monthlySold comps — $/sqft
last 12 mo · ≤1 miLoading sold comps…