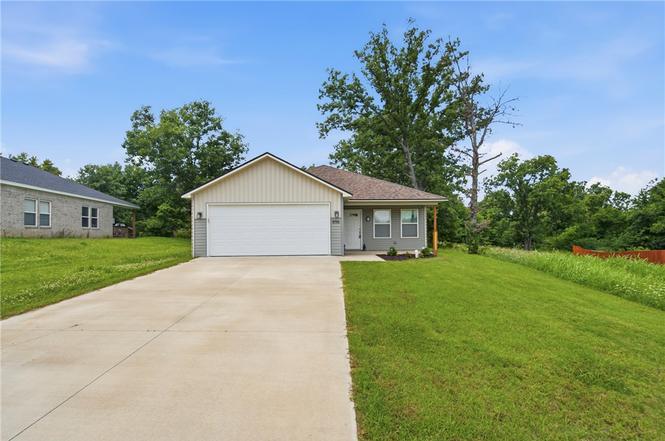
896 S Snyder Springs Loop · West Siloam Springs, OK
Flood risk No data
- FEMA flood zone
- —
- Chance of flooding over 30 yrs
- —
- Est. flood insurance / yr
- —
Fire risk No data
- Est. fire insurance / yr
- —
Heat risk No data
- Hot days now (above threshold)
- —
- Hot days in 30 yrs
- —
Wind risk No data
- Chance of severe wind over 30 yrs
- —
Air-quality risk No data
- Unhealthy air days now
- —
- Unhealthy air days in 30 yrs
- —
Risk factors via First Street. Map © Google.
Why this score? — see what drove the C- grade
The composite is a weighted blend of 9 inputs, each scored 0–100. Each bar is that input's sub-score; the figure is the points it added to the 100-point composite (weight × sub-score).
- Cash flow +20.1/30.0
- DSCR +6.4/10.0
- ARV discount +5.5/15.0
- 1% rule +5.3/10.0
- Appreciation +5.0/10.0
- Livability +3.1/5.0
- Rent growth +2.5/5.0
- Condition / age +2.5/5.0
- Schools +2.0/10.0
$240,000
🖨 Deal sheet 📄 Offer letter ✓ Due diligence
Listing remarks MLS
Built in 2023, this Zella Cottage floor plan offers 3 bedrooms, 2 baths, and an open-concept layout on a spacious 0.44-acre lot just across the Arkansas state line. Features include cathedral ceilings, luxury vinyl plank flooring, granite countertops, bar seating, LED lighting, blinds, covered front porch and covered back patio. All-electric home with city water and sewer. New roof with Class 3 impact-resistant shingles and one new window installed in 2025. Nestled back from the road for added privacy and one of the few homes in the neighborhood offering cathedral ceilings which adds to the spacious feel and architectural appeal. This charming home offers modern style and quality upgrades. Don’t miss your opportunity to own this nearly new home with upgraded features, a larger lot and convenient location!
Key facts
- Cathedral ceilings
- Spacious lot
- Granite countertops
Tags
Property features AI
Exterior
- Parking: Attached 2-car garage
- Security: Smoke detectors; No safety shelter
- Utilities: Electricity available; Public water; Public sewer
- Home design: Single-story; Faces north; Slab foundation
- Construction: Brick, vinyl siding, and wood frame construction; Asphalt fiberglass roof; Built according to public records
- Exterior features: Covered patio and porch; Corner lot; Mature trees; Wooded
Interior
- Kitchen: Dishwasher; Microwave; Oven; Range; Disposal; Plumbed for ice maker; Electric water heater
- Flooring: Carpet; Vinyl
- Bathrooms: 2 full bathrooms
- Heating & cooling: Central heating (electric); Central air conditioning
- Interior features: Granite counters; Vaulted ceilings; Ceiling fans; Programmable thermostat; Insulated doors; Vinyl insulated windows
- Laundry & utility: Washer hookup; Electric dryer hookup
Neighborhood map
What this means for you Summary
Snapshot
- This is a 3-bed/2.0-bath single-family listed at $240k.
Deal economics
- At list price, monthly cash flow is $299 ($4k/yr) — positive.
- The deal already cash-flows at list — no discount required.
- Meets the 1% rule at list price ($2k rent vs $240k).
Location & tenants
- Location reads 61/100 on livability (#318 in OK) — a middle-class / working-renter tenant base. Strengths: cost of living A+, housing A+; Watch: employment D+, schools F, amenities F.
- Moseley (rural): math 20% / reading 20% proficiency, ranked #418 of 513 in OK (top 82%) — low school quality limits family demand, transient renter base, plan for 1-2y turnover.
- Market conditions: 36 active listings in the ZIP; 51 units permitted in Delaware County in 2024 (0 in 5+ unit buildings).
Forward outlook
- In year one you build about $9k of equity ($2k loan paydown + $7k appreciation (3.0% local appreciation)).
- Delaware County population projected to shrink 6% by 2050 — rents likely to lag national; underwrite the cash flow, not the appreciation.
- At projected returns (3.0% appreciation + 3.0% rent growth), your $67k cash investment doubles in ~5 years — after that, you're playing with house money.
- By year 4, paydown + projected appreciation supports a ~$30k cash-out refi (75% LTV) — recoverable capital for the next deal without selling this one.
Negotiation context
- Only 3 days on market — expect competitive offers; lowballing is unlikely to land.
- 4 sale attempts since 5y ago with the ask held roughly flat each time — persistent listings suggest the price (not the market) is what's stuck; bring a comps-based counter.
- Current owner paid $197k; 22% above their basis — modest negotiation headroom, anchor on the comps not their cost.
Questions for the listing agent
- Is there a deadline driving the sale (1031 exchange, divorce, estate, relocation)? That informs how much negotiation room exists.
- Schools are F-rated, which usually means shorter tenancies and higher turnover. Who's the typical renter profile here, and what's been the actual vacancy rate?
- What's the average days-on-market for RENTAL listings here right now (not sales)? A rising rental-DOM trend means longer vacancies and softer asking-rent achievability than the comps imply.
- What's the recent tenant-quality profile in this submarket — average credit score on applications, eviction rate, late-payment / NSF rate, and stable-employment percentage? A property-management company in the area should have these aggregated.
- How much new for-sale + rental construction is in the pipeline within 1–3 miles? Heavy new supply typically softens prices + rents 12–24 months out; constrained supply supports both.
Investment metrics
- 1% rule
- 1.03% ✓
- Cap rate
- 7.79%
- Cash-on-cash
- 5.35%
- DSCR
- 1.24
- GRM
- 8.1
CMA / ARV
- ARV (on-the-fly)
- $229,950
- Comps found
- 10
Show comp detail 10 sales within ~0.75 mi
| Address | Dist | Beds/Ba | Sqft | Sold | Price | $/sf | Match |
|---|---|---|---|---|---|---|---|
| 873 Snyder Springs Loop | 0.03mi | 3/2.0 | 1,314 (0%) | 2mo | $239,900 | $183 | 96 |
| 847 Snyder Springs Loop | 0.06mi | 3/2.0 | 1,331 (+1%) | 3mo | $260,000 | $195 | 92 |
| 58 Snyder Springs Cir | 0.10mi | 3/2.0 | 1,331 (+1%) | 4mo | $239,900 | $180 | 90 |
| 991 Snyder Springs Loop | 0.06mi | 3/2.0 | 1,250 (-5%) | 1mo | $242,900 | $194 | 88 |
| 957 Snyder Springs Loop | 0.05mi | 3/2.0 | 1,314 (0%) | 15mo | $229,900 | $175 | 86 |
| 836 Snyder Springs Loop | 0.07mi | 3/2.0 | 1,314 (0%) | 17mo | $225,900 | $172 | 82 |
| 881 Snyder Springs Loop | 0.02mi | 3/2.0 | 1,314 (0%) | 23mo | $224,000 | $170 | 80 |
| 865 Snyder Springs Loop | 0.04mi | 3/2.0 | 1,314 (0%) | 22mo | $229,900 | $175 | 80 |
| 642 Snyder Springs Dr | 0.09mi | 3/2.0 | 1,314 (0%) | 24mo | $229,900 | $175 | 76 |
| 967 Snyder Springs Loop | 0.06mi | 3/2.0 | 1,420 (+8%) | 12mo | $204,000 | $144 | 73 |
Match score weights: distance 35% · size 25% · config 20% · recency 20%. Top-matched comps best support the ARV.
Projected returns pro-forma
3.0% appreciation · 3.0% rent growth · sell at horizon
- IRR
- 12.5%
- Equity multiple
- 1.71×
- Total profit
- $48,015
- Equity at exit
- $107,914
- IRR
- 14.5%
- Equity multiple
- 3.15×
- Total profit
- $144,296
- Equity at exit
- $166,309
Cash invested: $67,200 (down + closing). Projections, not guarantees.
Landlord ↔ Tenant lean methodology
- Overall (STATE)
- 83 Strongly Landlord-Friendly
- State Oklahoma
- 83 Strongly Landlord-Friendly · R+20
- County
- — inherits STATE
- City
- — inherits STATE
ZIP-level market 74338
- Active inventory
- 36
- Price-to-rent
- 8.1×
Monthly cashflow live
- Estimated rent
- $2,478 medium interval (Pro) →
- Mortgage (P&I)
- −$1,259
- Tax est. 1.5%
- −$300 /mo · $3,600/yr
- Insurance
- −$100
- HOA
- −$0
- Vacancy / Maint / Mgmt
- −$520
- Net cashflow
- $299
Break-even live
UW: 25.0% down · 7.5% · 30yr · 1.5% tax · 5.0% vac · 8.0% maint · 8.0% mgmt
Financing live
Cash to close
- Down payment
- $60,000
- Closing costs
- $7,200
- Reserves months
- —
- Total cash needed
- —
Loan-product check · same deal, 3 products live
Conventional
25% down · 7.5% · 30yr
- Down + closing
- —
- Monthly P&I
- —
- Monthly cashflow
- —
- DSCR
- —
- Eligible?
- —
Personal DTI + credit; lowest rate.
DSCR
20% down · 8.5% · 30yr
- Down + closing
- —
- Monthly P&I
- —
- Monthly cashflow
- —
- DSCR
- —
- Eligible?
- —
No personal income docs; deal must DSCR.
Hard money
10% down · 12.0% · 12mo
- Down + closing
- —
- Monthly P&I
- —
- Monthly cashflow
- —
- DSCR
- —
- Eligible?
- —
Short-term bridge; refi at stabilization.
Listing history 4 events
-
2026-06-18days on market $240,000 Active 3 DOM
-
2026-06-17days on market $240,000 Active 2 DOM
-
2026-06-15remarks 699-char remark
Show marketing remark (822 chars)
Built in 2023, this Zella Cottage floor plan offers 3 bedrooms, 2 baths, and an open-concept layout on a spacious 0.44-acre lot just across the Arkansas state line. Features include cathedral ceilings, luxury vinyl plank flooring, granite countertops, bar seating, LED lighting, blinds, covered front porch and covered back patio. All-electric home with city water and sewer. New roof with Class 3 impact-resistant shingles and one new window installed in 2025. Nestled back from the road for added privacy and one of the few homes in the neighborhood offering cathedral ceilings which adds to the spacious feel and architectural appeal. This charming home offers modern style and quality upgrades. Don’t miss your opportunity to own this nearly new home with upgraded features, a larger lot and convenient location!
-
2026-06-15$240,000 Active 1 DOM
Show marketing remark (822 chars)
Built in 2023, this Zella Cottage floor plan offers 3 bedrooms, 2 baths, and an open-concept layout on a spacious 0.44-acre lot just across the Arkansas state line. Features include cathedral ceilings, luxury vinyl plank flooring, granite countertops, bar seating, LED lighting, blinds, covered front porch and covered back patio. All-electric home with city water and sewer. New roof with Class 3 impact-resistant shingles and one new window installed in 2025. Nestled back from the road for added privacy and one of the few homes in the neighborhood offering cathedral ceilings which adds to the spacious feel and architectural appeal. This charming home offers modern style and quality upgrades. Don’t miss your opportunity to own this nearly new home with upgraded features, a larger lot and convenient location!
ⓘ Source: listings_history table (triggers on properties + properties_extension) + one-shot
backfill from property_details.listing_events for pre-trigger history.
Nearby sold comps map
Loading sold comps map…
Walkable amenities ~0.75 mi
Loading nearby amenities…
Taxation est. · year 1
- Rental income
- $29,741
- − Mortgage interest
- −$13,444
- − Property taxes
- −$3,600
- − Insurance
- −$1,200
- − Repairs & maintenance
- −$2,379
- − Management
- −$2,379
- − Depreciation
- −$6,982
- Taxable loss
- −$243
- Est. tax savings @ 24.0%
- +$58
- After-tax cash flow
- $3,651/yr
For passive investors: Depreciation is non-cash, so a rental often shows a tax loss while cash-flowing — sheltering income. Rental losses are passive: they offset passive income freely, and up to $25,000/yr can offset ordinary (W-2) income if you actively participate and your MAGI is under $100k (phasing out to $0 by $150k); unused losses carry forward. On sale, claimed depreciation is recaptured at up to 25%, and gains may owe capital-gains tax (a 1031 exchange can defer both). Figures are a year-1 estimate at your 24.0% rate — not tax advice; consult a CPA.
Schools (NCES district)
- District
- Moseley
- NCES district ID
- 4020430
- Math proficiency
- 20% ▬ 0.00%
- Reading proficiency
- 20% ▬ 0.00%
- Median HH income
- $36,121
- Composite
- 19.83/100
- National rank
- #13893
- State rank
- #418 of 513 in OK
Livability — West Siloam Springs
- Score
- 61/100
- State rank
- #318
- US rank
- #18248
Category grades
Schools grade is shown separately in the Schools card above.
Census & demographics
- Census place
- West Siloam Springs, OK
- Population (ZIP)
- 5,306
Population outlook (Delaware County) Hauer SSP2
- Today (2025)
- 41,302 people
- By 2030
- 40,888 · -1.0%
- By 2040
- 39,802 · -3.6%
- By 2050
- 38,839 · -6.0%
- By 2075
- 37,438 · -9.4%
- By 2100
- 34,910 · -15.5%
Race, ethnicity, and origin ACS 2023
- Neighborhood character
- Diverse neighborhood (Simpson 0.70)
- Race & ethnicity
- White 55% Native American 24% Two or more races 16% Hispanic / Latino 6% Asian 2%
- Hispanic origin (detail)
- Mexican 4%
- Common ancestry
- Italian 2% Portuguese 1% Serbian 1%
- Foreign-born
- 3% · Canada
- Languages at home
- 95% English-only · Spanish 2% Other Asian/Pacific 1% Tagalog/Filipino 1%
Political lean MEDSL · Delaware
- 2024 margin
- Solid R (+60.4) · D 19.2% · R 79.6% · Other 1.2%
- 2008→2024 swing
- -26.6pp toward R · 2008: -33.8pp · 2024: -60.4pp
- All cycles
- 2024: R+60.4 2020: R+58.5 2016: R+54.1 2012: R+41.3 2008: R+33.8
Not yet ingested
- Civics
- —
Market trends
- HPI YoY
- —
- Current HPI
- —
- Rent YoY
- —
- Metro
- —
- State GDP YoY
- ▲ 1.55%
- F500 in state
- 6
Industry mix (Fortune 500 HQ in OK)
| Industry | F500 HQs | Revenue |
|---|---|---|
| Energy | 3 | $48B |
|
||
Price history
+21.9% since first listed8 events — show timeline
- 2026-06-15 Listed $240,000 NWARMLS
- 2026-06-15 Listed $240,000 MLS Technology, Inc.
- 2023-08-10 Sold (MLS) $196,900 NWARMLS
- 2023-08-10 Sold (MLS) $196,900 MLS Technology, Inc.
- 2022-01-18 Pending — MLS Technology, Inc.
- 2022-01-18 Pending — NWARMLS
- 2022-01-01 Listed $196,900 MLS Technology, Inc.
- 2021-12-23 Listed $196,900 NWARMLS
Cash-flow waterfall
monthlySold comps — $/sqft
last 12 mo · ≤1 miLoading sold comps…