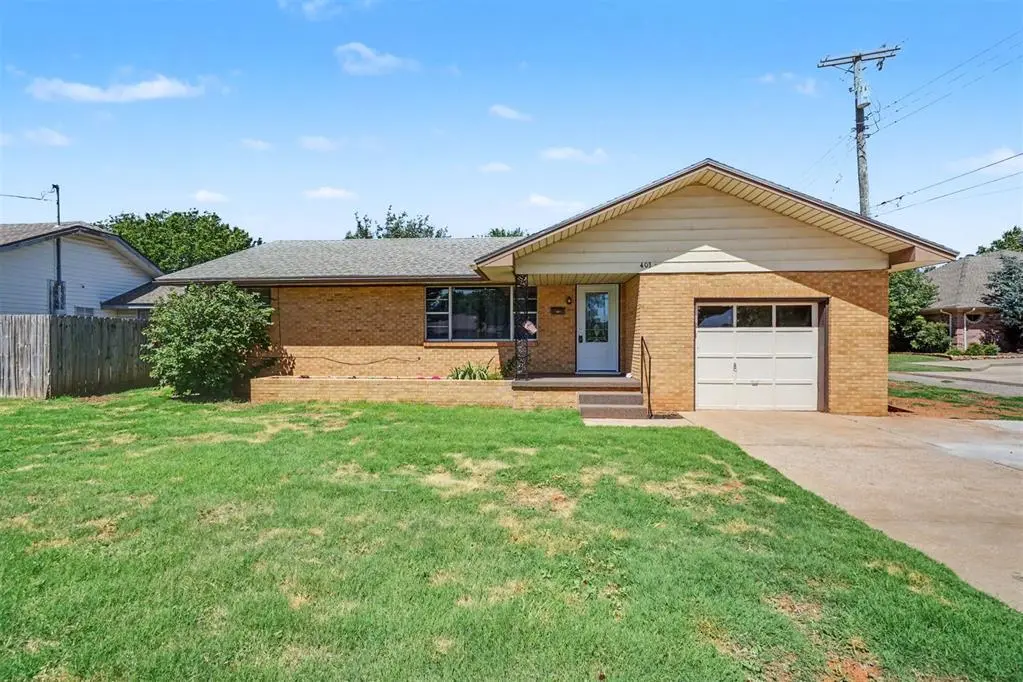
403 N Randall Ave · Elk City, OK
Flood risk 1/10 · Minimal
- FEMA flood zone
- X (unshaded)
- Chance of flooding over 30 yrs
- 0.0%
- Est. flood insurance / yr
- $507 – $1,088
Fire risk 4/10 · Minor
- Est. fire insurance / yr
- $2,463 – $4,575
Heat risk 6/10 · Moderate
- Hot days now (above 104°F)
- 7 days/yr
- Hot days in 30 yrs
- 20 days/yr
Wind risk 2/10 · Minimal
- Chance of severe wind over 30 yrs
- 2.0%
Air-quality risk 1/10 · Minimal
- Unhealthy air days now
- 0 days/yr
- Unhealthy air days in 30 yrs
- 0 days/yr
Risk factors via First Street. Map © Google.
Why this score? — see what drove the C- grade
The composite is a weighted blend of 9 inputs, each scored 0–100. Each bar is that input's sub-score; the figure is the points it added to the 100-point composite (weight × sub-score).
- Cash flow +21.3/30.0
- ARV discount +8.8/15.0
- DSCR +6.8/10.0
- 1% rule +4.5/10.0
- Livability +3.2/5.0
- Rent growth +2.5/5.0
- Condition / age +2.5/5.0
- Schools +1.3/10.0
- Appreciation +0.0/10.0
$105,000
🖨 Deal sheet (PDF) 📄 Offer letter ✓ Due diligence
Listing remarks
Beautifully updated 2 bedroom brick home for sale in Elk City that blends timeless character with modern finishes. Original hardwood floors add warmth and charm throughout, while fresh interior paint creates a bright, move in ready feel. The kitchen is designed for both style and function, featuring granite countertops, a gas stove, and plenty of workspace for everyday living and entertaining. Recent plumbing updates provide added peace of mind. The completely remodeled bathroom showcases new tile, a modern double-sink vanity, and updated fixtures for a fresh, contemporary look. Additional features include a convenient 1-car attached garage and low-maintenance brick exterior. Whether you're
Key facts
- Updated brick home
- Remodeled bathroom
- Gas stove
Tags
Property features AI
Finance
- Other: Vacant / not occupied
- Financial info: Listing accepts Cash, Conventional, FHA, VA, Rural Housing Services; Not assumable
- HOA & community: No mandatory association dues
Exterior
- Parking: Concrete parking; 1-car garage
- Utilities: Electricity available; Natural gas available; Public utilities
- Home design: Single-family residence; One level; East-facing
- Construction: Brick construction; Composition roof; Conventional foundation; Built (existing)
- Exterior features: Covered patio; Covered porch; Outbuildings; Chain link fencing; Interior lot
Interior
- Kitchen: Free‑standing gas range/oven; Microwave
- Bedrooms: 2 bedrooms
- Flooring: Tile; Wood
- Bathrooms: 1 full bathroom
- Interior features: Ceiling fans
- Laundry & utility: Water heater
Neighborhood map
What this means for you Summary
Snapshot
- This is a 2-bed/1.0-bath single-family listed at $105k.
Deal economics
- At list price, monthly cash flow is $154 ($2k/yr) — positive.
- The deal already cash-flows at list — no discount required.
- To meet the 1% rule (rent ≥ 1% of price), the offer needs to be $100k (4.5% below list).
- Recommended offer: $100k (4.5% below list) — sets the bar for 1% rule.
- Cap rate 8.0% vs local median 4.2% in Elk City — top-decile yield for the area; either an underpriced asset or a hidden risk that comps aren't pricing in. Stress-test before assuming the spread holds.
Location & tenants
- Location reads 65/100 on livability (#141 in OK) — a middle-class / working-renter tenant base. Strengths: cost of living A+, housing A, crime B+; Watch: employment D+, amenities F, commute F.
- Elk City (town): math 14% / reading 15% proficiency, ranked #218 of 270 in OK (top 81%) — low school quality limits family demand, transient renter base, plan for 1-2y turnover.
- Zoned schools: Elk City Es (math 22% / reading 17%, grade F, #479 of 845 statewide, top 63%, 753 students, 0% FRL); Elk City Ies (math 21% / reading 14%, grade F, #186 of 345 statewide, top 55%, 434 students, 0% FRL); Elk City Hs (math 8% / reading 22%, grade F, #332 of 447 statewide, top 78%, 615 students, 0% FRL) — zoned schools average 0% FRL vs 48% district-wide (48 pts lower); this property's tenant base skews higher-income than the district average.
- Market conditions: 125 active listings in the ZIP; 16 units permitted in Beckham County in 2024 (0 in 5+ unit buildings).
Forward outlook
- Local home prices are declining (-3.0%/yr); year-one equity from $726 of loan paydown is wiped out by about $3k of value loss. Plan a longer hold.
- Beckham County population projected at +35% by 2050 — long-run rental-demand tailwind backs the buy-and-hold thesis.
Negotiation context
- Only 1 days on market — expect competitive offers; lowballing is unlikely to land.
Risks & watch-outs
- Watch-outs: built in 1959 — expect roof / HVAC / electrical / plumbing capex.
- Climate carrying-cost: extreme-heat days projected 7→20/yr by 2055 (HVAC capex compounding) — expect insurance premiums to compound above CPI over the hold.
Questions for the listing agent
- Built in 1959 — when were the roof, HVAC, electrical panel, plumbing, and water heater last replaced?
- Is there a deadline driving the sale (1031 exchange, divorce, estate, relocation)? That informs how much negotiation room exists.
- Schools are F-rated, which usually means shorter tenancies and higher turnover. Who's the typical renter profile here, and what's been the actual vacancy rate?
- What's the average days-on-market for RENTAL listings here right now (not sales)? A rising rental-DOM trend means longer vacancies and softer asking-rent achievability than the comps imply.
- What's the recent tenant-quality profile in this submarket — average credit score on applications, eviction rate, late-payment / NSF rate, and stable-employment percentage? A property-management company in the area should have these aggregated.
- How much new for-sale + rental construction is in the pipeline within 1–3 miles? Heavy new supply typically softens prices + rents 12–24 months out; constrained supply supports both.
Investment metrics
- 1% rule
- 0.95% ✗
- Cap rate
- 8.05%
- Cash-on-cash
- 6.27%
- DSCR
- 1.28
- GRM
- 8.7
CMA / ARV
- ARV (on-the-fly)
- $108,205
- Comps found
- 12
Show comp detail 12 sales within ~0.75 mi
| Address | Dist | Beds/Ba | Sqft | Sold | Price | $/sf | Match |
|---|---|---|---|---|---|---|---|
| 622 N Boone Ave | 0.29mi | 2/2.0 | 1,144 (+0%) | 3mo | $100,000 | $87 | 79 |
| 422 N Washington Ave | 0.52mi | 3/1.0 (+1) | 1,150 (+1%) | 1mo | $80,000 | $70 | 69 |
| 1401 W 2nd St | 0.21mi | 2/1.0 | 986 (-13%) | 1mo | $41,000 | $42 | 67 |
| 420 N Howard Ave | 0.09mi | 3/1.0 (+1) | 1,008 (-12%) | 10mo | $18,500 | $18 | 63 |
| 519 N State Ave | 0.22mi | 3/2.0 (+1) | 1,288 (+13%) | 2mo | $142,500 | $111 | 57 |
| 1403 W Broadway Ave | 0.30mi | 3/1.0 (+1) | 1,008 (-12%) | 10mo | $80,000 | $79 | 54 |
| 104 Brian Rd | 0.57mi | 2/1.0 | 1,256 (+10%) | 3mo | $115,000 | $92 | 54 |
| 107 Sondra Dr. Dr | 0.73mi | 3/2.0 (+1) | 1,155 (+1%) | 6mo | $165,000 | $143 | 49 |
| 415 Eisenhower Blvd | 0.57mi | 3/1.0 (+1) | 1,012 (-11%) | 1mo | $97,000 | $96 | 49 |
| 419 W 8th St | 0.69mi | 3/2.0 (+1) | 1,150 (+1%) | 14mo | $130,000 | $113 | 46 |
| 109 Mary Dr | 0.72mi | 3/1.5 (+1) | 1,200 (+5%) | 13mo | $130,000 | $108 | 40 |
| 906 Halsey Dr | 0.46mi | 3/1.0 (+1) | 970 (-15%) | 12mo | $92,000 | $95 | 39 |
Match score weights: distance 35% · size 25% · config 20% · recency 20%. Top-matched comps best support the ARV.
Projected returns pro-forma
-3.0% appreciation · 3.0% rent growth · sell at horizon
- IRR
- -6.7%
- Equity multiple
- 0.75×
- Total profit
- $-7,271
- Equity at exit
- $15,656
- IRR
- 2.9%
- Equity multiple
- 1.21×
- Total profit
- $6,108
- Equity at exit
- $9,078
Cash invested: $29,400 (down + closing). Projections, not guarantees.
Landlord ↔ Tenant lean methodology
- Overall (STATE)
- 83 Strongly Landlord-Friendly
- State Oklahoma
- 83 Strongly Landlord-Friendly · R+20
- County
- — inherits STATE
- City
- — inherits STATE
ZIP-level market 73644
- Home prices YoY
- -24.0%
- Active inventory
- 125
- Price-to-rent
- 8.7×
Monthly cashflow live
- Estimated rent
- $1,003 medium interval (Pro) →
- Mortgage (P&I)
- −$551
- Tax from tax record
- −$44 /mo · $530/yr
- Insurance
- −$44
- HOA
- −$0
- Vacancy / Maint / Mgmt
- −$211
- Net cashflow
- $154
Break-even live
Sensitivity live
| Price | -10% $213 | -5% $183 | +0% $154 | +5% $124 | +10% $94 |
|---|---|---|---|---|---|
| Rent | -10% $74 | -5% $114 | +0% $154 | +5% $193 | +10% $233 |
| Rate | -1.0pp $206 | -0.5pp $180 | base $154 | +0.5pp $126 | +1.0pp $99 |
UW: 25.0% down · 7.5% · 30yr · 1.5% tax · 5.0% vac · 8.0% maint · 8.0% mgmt
Financing live
Cash to close
- Down payment
- $26,250
- Closing costs
- $3,150
- Reserves months
- —
- Total cash needed
- —
Loan-product check · same deal, 3 products live
Conventional
25% down · 7.5% · 30yr
- Down + closing
- —
- Monthly P&I
- —
- Monthly cashflow
- —
- DSCR
- —
- Eligible?
- —
Personal DTI + credit; lowest rate.
DSCR
20% down · 8.5% · 30yr
- Down + closing
- —
- Monthly P&I
- —
- Monthly cashflow
- —
- DSCR
- —
- Eligible?
- —
No personal income docs; deal must DSCR.
Hard money
10% down · 12.0% · 12mo
- Down + closing
- —
- Monthly P&I
- —
- Monthly cashflow
- —
- DSCR
- —
- Eligible?
- —
Short-term bridge; refi at stabilization.
Listing history 2 events
-
2026-06-21remarks 699-char remark
-
2026-06-21$105,000 Pending 1 DOM
ⓘ Source: listings_history table (triggers on properties + properties_extension) + one-shot
backfill from property_details.listing_events for pre-trigger history.
Tax reassessment forecast OK · Resets to sale price
- Current annual tax
- $530 · $44/mo
- Projected year-2 tax
- $945 · $79/mo
- Expected delta
- +$415/yr (+$35/mo · 78.3%)
ⓘ Screening estimate from a state-policy table — verify with the county assessor before closing.
Climate risk First Street
- Flood 1/10 Low FEMA zone X (unshaded) · 0% chance over 30 yrs
- Wildfire 4/10 Moderate
- Heat 6/10 Major 7 d/yr ≥104°F today · 20 d/yr by 30 yrs out
- Wind 2/10 Low 2% chance of damaging wind over 30 yrs
- Air quality 1/10 Low 0 unhealthy d/yr today · 0 by 30 yrs out
Nearby sold comps map
Loading sold comps map…
Walkable amenities ~0.75 mi
Loading nearby amenities…
Taxation est. · year 1
- Rental income
- $12,032
- − Mortgage interest
- −$5,882
- − Property taxes
- −$530
- − Insurance
- −$525
- − Repairs & maintenance
- −$963
- − Management
- −$963
- − Depreciation
- −$3,055
- Taxable income
- $116
- Est. tax owed @ 24.0%
- −$28
- After-tax cash flow
- $1,815/yr
For passive investors: Depreciation is non-cash, so a rental often shows a tax loss while cash-flowing — sheltering income. Rental losses are passive: they offset passive income freely, and up to $25,000/yr can offset ordinary (W-2) income if you actively participate and your MAGI is under $100k (phasing out to $0 by $150k); unused losses carry forward. On sale, claimed depreciation is recaptured at up to 25%, and gains may owe capital-gains tax (a 1031 exchange can defer both). Figures are a year-1 estimate at your 24.0% rate — not tax advice; consult a CPA.
Schools (NCES district)
- District
- Elk City
- NCES district ID
- 4010740
- Math proficiency
- 14% ▼ -11.00%
- Reading proficiency
- 15% ▼ -14.00%
- Median HH income
- $49,040
- Composite
- 13.26/100
- National rank
- #9547
- State rank
- #218 of 270 in OK
Livability — Elk City
- Score
- 65/100
- State rank
- #141
- US rank
- #13090
Category grades
Schools grade is shown separately in the Schools card above.
Census & demographics
- Census place
- Elk City, OK
- City population
- 13,687
- Population (ZIP)
- 13,687
Population outlook (Beckham County) Hauer SSP2
- Today (2025)
- 26,564 people
- By 2030
- 28,217 · +6.2%
- By 2040
- 31,865 · +20.0%
- By 2050
- 35,862 · +35.0%
- By 2075
- 47,189 · +77.6%
- By 2100
- 55,622 · +109.4%
Race, ethnicity, and origin ACS 2023
- Neighborhood character
- Predominantly White (80%)
- Race & ethnicity
- White 80% Hispanic / Latino 15% Two or more races 6% Black 1% Asian 1%
- Hispanic origin (detail)
- Mexican 13%
- Common ancestry
- Iranian 2% Lithuanian 2% Italian 2%
- Foreign-born
- 4% · Canada, China
- Languages at home
- 89% English-only · Spanish 10%
Political lean MEDSL · Beckham
- 2024 margin
- Solid R (+70.1) · D 14.2% · R 84.3% · Other 1.4%
- 2008→2024 swing
- -14.0pp toward R · 2008: -56.1pp · 2024: -70.1pp
- All cycles
- 2024: R+70.1 2020: R+72.0 2016: R+70.8 2012: R+59.1 2008: R+56.1
Not yet ingested
- Civics
- —
Market trends
- HPI YoY
- ▼ -56.11%
- Current HPI
- 178.0217
- Rent YoY
- —
- Metro
- —
- State GDP YoY
- ▲ 1.55%
- F500 in state
- 6
Industry mix (Fortune 500 HQ in OK)
| Industry | F500 HQs | Revenue |
|---|---|---|
| Energy | 3 | $48B |
|
||
Price history
2 events — show timeline
- 2026-06-20 Pending — MLSOK
- 2026-06-19 Listed $105,000 MLSOK
Property tax history
+7.6%/yrLatest (2025): $530 · +10.2% YoY. Source: county tax records.
Cash-flow waterfall
monthlySold comps — $/sqft
last 12 mo · ≤1 miLoading sold comps…