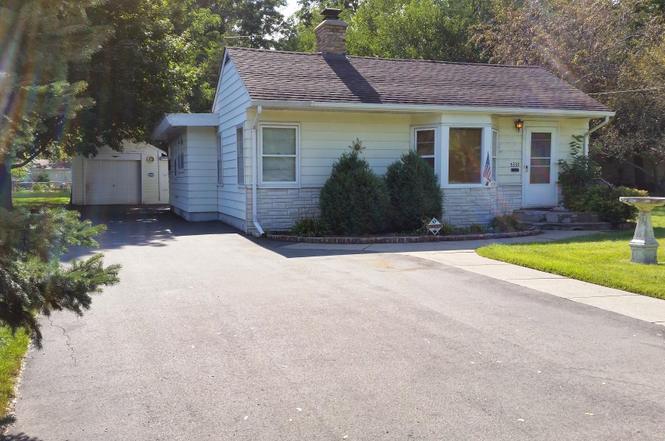
5332 Riverview Rd · Minneapolis, MN
Flood risk 1/10 · Minimal
- FEMA flood zone
- X (unshaded)
- Chance of flooding over 30 yrs
- 0.0%
- Est. flood insurance / yr
- $507 – $1,088
Fire risk 1/10 · Minimal
- Est. fire insurance / yr
- $888 – $1,650
Heat risk 2/10 · Minimal
- Hot days now (above 100°F)
- 7 days/yr
- Hot days in 30 yrs
- 14 days/yr
Wind risk 2/10 · Minimal
- Chance of severe wind over 30 yrs
- —
Air-quality risk 2/10 · Minimal
- Unhealthy air days now
- 1 days/yr
- Unhealthy air days in 30 yrs
- 2 days/yr
Risk factors via First Street. Map © Google.
Why this score? — see what drove the C+ grade
The composite is a weighted blend of 9 inputs, each scored 0–100. Each bar is that input's sub-score; the figure is the points it added to the 100-point composite (weight × sub-score).
- Cash flow +26.0/30.0
- DSCR +8.7/10.0
- ARV discount +7.5/15.0
- 1% rule +6.5/10.0
- Livability +3.9/5.0
- Schools +3.5/10.0
- Condition / age +2.5/5.0
- Rent growth +2.0/5.0
- Appreciation +0.0/10.0
$219,000
🖨 Deal sheet 📄 Offer letter ✓ Due diligence
Listing remarks MLS
Walk to Minnehaha Falls, River & off leash dog park. Modest home w/ great space & floor plan. NEW furnace,plumb, roof, water htr, driveway. Sold As-Is **M-F showing only until 5pm. Weekends -anytime** Prefer late Sept or October close date.
Key facts
- 6,098 sq ft lot
- Built 1910
- Listed 45 days
Tags
Neighborhood map
What this means for you Summary
Snapshot
- This is a 3-bed/1.5-bath single-family listed at $219k.
Deal economics
- At list price, monthly cash flow is $542 ($7k/yr) — positive.
- The deal already cash-flows at list — no discount required.
- Meets the 1% rule at list price ($3k rent vs $219k).
- Recommended offer: $212k (3.0% below list) — sets the bar for market timing.
- Cap rate 9.3% vs local median 3.1% in Minneapolis — top-decile yield for the area; either an underpriced asset or a hidden risk that comps aren't pricing in. Stress-test before assuming the spread holds.
Location & tenants
- Location reads 78/100 on livability (#110 in MN, #2,525 nationally) — a middle-class / working-renter tenant base. Strengths: amenities A+, commute A+, housing A+; Watch: cost of living C-, crime F.
- Minneapolis Public School District (urban): math 35% / reading 46% proficiency, ranked #217 of 301 in MN (top 72%) — families likely to look elsewhere, expect single-tenant / working-renter base with shorter leases.
- Market conditions: Rents soft (-2.0%/yr); 136 active listings in the ZIP; 8 comparable units currently listed for rent nearby; rentals leasing fast (median 11d on market — plan ~1-2 weeks tenant-placement turnaround); high-income renter base; 4,651 units permitted in Hennepin County in 2024 (2,443 in 5+ unit buildings).
Forward outlook
- Local home prices are declining (-3.0%/yr); year-one equity from $2k of loan paydown is wiped out by about $7k of value loss. Plan a longer hold.
- Hennepin County population projected at +30% by 2050 — long-run rental-demand tailwind backs the buy-and-hold thesis.
Negotiation context
- It's been on market 45 days — a 3% lower offer ($212k) is reasonable based on typical stale-listing flexibility.
- 6 sale attempts since 30y ago; this cycle's ask has dropped $18k (8%) from the opening price — seller is motivated, your offer sets the floor, not the list.
- Current owner paid $139k; list at $219k implies a 58% gain — meaningful room to come down on a strong offer.
Risks & watch-outs
- Watch-outs: built in 1910 — expect roof / HVAC / electrical / plumbing capex.
Questions for the listing agent
- It's been on market 45 days. Have you received any prior offers? Is the seller open to a 3% concession, seller financing, or rate buy-down credit?
- Built in 1910 — when were the roof, HVAC, electrical panel, plumbing, and water heater last replaced?
- Is there a deadline driving the sale (1031 exchange, divorce, estate, relocation)? That informs how much negotiation room exists.
- Crime grade is F in this area — have there been break-ins, vandalism, or insurance claims at this property in the last 3 years? What carrier currently insures it and at what premium?
- What's the average days-on-market for RENTAL listings here right now (not sales)? A rising rental-DOM trend means longer vacancies and softer asking-rent achievability than the comps imply.
- What's the recent tenant-quality profile in this submarket — average credit score on applications, eviction rate, late-payment / NSF rate, and stable-employment percentage? A property-management company in the area should have these aggregated.
- How much new for-sale + rental construction is in the pipeline within 1–3 miles? Heavy new supply typically softens prices + rents 12–24 months out; constrained supply supports both.
Investment metrics
- 1% rule
- 1.15% ✓
- Cap rate
- 9.27%
- Cash-on-cash
- 10.61%
- DSCR
- 1.47
- GRM
- 7.3
CMA / ARV
No comps found within radius.
Projected returns pro-forma
-3.0% appreciation · 0.0% rent growth · sell at horizon
- IRR
- -3.7%
- Equity multiple
- 0.86×
- Total profit
- $-8,313
- Equity at exit
- $32,654
- IRR
- 2.3%
- Equity multiple
- 1.14×
- Total profit
- $8,753
- Equity at exit
- $18,935
Cash invested: $61,320 (down + closing). Projections, not guarantees.
Landlord ↔ Tenant lean methodology
- Overall (CITY)
- 34 Tenant-Leaning
- State Minnesota
- 46 Balanced · D+2
- County
- — inherits STATE
- City Minneapolis
- 34 Tenant-Leaning · D+50
ZIP-level market 55417
- Rents YoY
- -2.0%
- Active inventory
- 136
- Price-to-rent
- 7.3×
Monthly cashflow live
- Estimated rent
- $2,514 high interval (Pro) →
- Mortgage (P&I)
- −$1,148
- Tax from tax record
- −$204 /mo · $2,446/yr
- Insurance
- −$91
- HOA
- −$0
- Vacancy / Maint / Mgmt
- −$528
- Net cashflow
- $542
Break-even live
UW: 25.0% down · 7.5% · 30yr · 1.5% tax · 5.0% vac · 8.0% maint · 8.0% mgmt
Financing live
Cash to close
- Down payment
- $54,750
- Closing costs
- $6,570
- Reserves months
- —
- Total cash needed
- —
Loan-product check · same deal, 3 products live
Conventional
25% down · 7.5% · 30yr
- Down + closing
- —
- Monthly P&I
- —
- Monthly cashflow
- —
- DSCR
- —
- Eligible?
- —
Personal DTI + credit; lowest rate.
DSCR
20% down · 8.5% · 30yr
- Down + closing
- —
- Monthly P&I
- —
- Monthly cashflow
- —
- DSCR
- —
- Eligible?
- —
No personal income docs; deal must DSCR.
Hard money
10% down · 12.0% · 12mo
- Down + closing
- —
- Monthly P&I
- —
- Monthly cashflow
- —
- DSCR
- —
- Eligible?
- —
Short-term bridge; refi at stabilization.
Rent comps 8 comps
| Address | Beds | Baths | Sqft | Rent | $/sqft | DOM | Units | Dist |
|---|---|---|---|---|---|---|---|---|
| 800 Cretin Ave S Saint Paul, MN | 2.0 | 1.0–2.0 | 970 | $4,810 | $4.96 | 1d | 19 | 0.84mi |
| 4020 Nawadaha Blvd Minneapolis, MN | 1.0–2.0 | 1.0–2.0 | 795 | $2,388 | $3.00 | 2d | 9 | 0.99mi |
| 5758 35th Ave S Minneapolis, MN | 3.0 | 1.0 | 1000 | $1,650 | $1.65 | 43d | 1 | 1.15mi |
| 5749 33rd Ave S Minneapolis, MN | 2.0 | 1.0 | 816 | $1,375 | $1.69 | 10d | 1 | 1.22mi |
| 5749 33rd Ave S Apt 3 Minneapolis, MN | 2.0 | 1.0 | 816 | $1,325 | $1.62 | 43d | 1 | 1.22mi |
| 3215 E Minnehaha Pkwy Minneapolis, MN | 2.0 | 1.0–2.0 | 1004 | $2,550 | $2.54 | 43d | 4 | 1.29mi |
| 4244 45th Ave S Minneapolis, MN | 3.0 | 1.0 | 1200 | $2,200 | $1.83 | 7d | 1 | 1.33mi |
| 3605 E 44th St Minneapolis, MN | 2.0–3.0 | 1.0–1.5 | 825 | $2,499 | $3.03 | 2d | 37 | 1.36mi |
Listing history 21 events
-
2026-04-23status Pending
-
2026-04-12historical Contingent - Inspection
-
2026-04-07price $219,000
-
2026-03-30price $223,000
-
2026-03-21price $229,000
-
2026-03-09$237,000 Active
-
2026-02-07historical
-
2026-02-02$215,000 Active
-
2014-10-23soldstatus $138,800
-
2014-09-19soldstatus $138,800 Sold 249-char remark
Show marketing remark (249 chars)
Walk to Minnehaha Falls, River & off leash dog park. Modest home w/ great space & floor plan. NEW furnace,plumb, roof, water htr, driveway. Sold As-Is **M-F showing only until 5pm. Weekends -anytime** Prefer late Sept or October close date.
-
2014-09-19soldstatus $138,800
Show marketing remark (249 chars)
Walk to Minnehaha Falls, River & off leash dog park. Modest home w/ great space & floor plan. NEW furnace,plumb, roof, water htr, driveway. Sold As-Is **M-F showing only until 5pm. Weekends -anytime** Prefer late Sept or October close date.
-
2014-07-02status Pending 249-char remark
Show marketing remark (249 chars)
Walk to Minnehaha Falls, River & off leash dog park. Modest home w/ great space & floor plan. NEW furnace,plumb, roof, water htr, driveway. Sold As-Is **M-F showing only until 5pm. Weekends -anytime** Prefer late Sept or October close date.
-
2014-06-28historical 249-char remark
Show marketing remark (249 chars)
Walk to Minnehaha Falls, River & off leash dog park. Modest home w/ great space & floor plan. NEW furnace,plumb, roof, water htr, driveway. Sold As-Is **M-F showing only until 5pm. Weekends -anytime** Prefer late Sept or October close date.
-
2014-06-13$150,000 Active 249-char remark
Show marketing remark (249 chars)
Walk to Minnehaha Falls, River & off leash dog park. Modest home w/ great space & floor plan. NEW furnace,plumb, roof, water htr, driveway. Sold As-Is **M-F showing only until 5pm. Weekends -anytime** Prefer late Sept or October close date.
-
2014-06-13$150,000
Show marketing remark (249 chars)
Walk to Minnehaha Falls, River & off leash dog park. Modest home w/ great space & floor plan. NEW furnace,plumb, roof, water htr, driveway. Sold As-Is **M-F showing only until 5pm. Weekends -anytime** Prefer late Sept or October close date.
-
2014-06-13$150,000
Show marketing remark (249 chars)
Walk to Minnehaha Falls, River & off leash dog park. Modest home w/ great space & floor plan. NEW furnace,plumb, roof, water htr, driveway. Sold As-Is **M-F showing only until 5pm. Weekends -anytime** Prefer late Sept or October close date.
-
1997-05-13soldstatus $65,000
-
1997-04-30soldstatus $65,000
-
1997-03-04historical
-
1996-10-28$69,900
ⓘ Source: listings_history table (triggers on properties + properties_extension) + one-shot
backfill from property_details.listing_events for pre-trigger history.
Tax reassessment forecast MN · Partial reset (capped growth)
- Current annual tax
- $2,446 · $204/mo
- Projected year-2 tax
- $2,449 · $204/mo
- Expected delta
- +$3/yr ($0/mo · 0.1%)
ⓘ Screening estimate from a state-policy table — verify with the county assessor before closing.
Climate risk First Street
- Flood 1/10 Low FEMA zone X (unshaded) · 0% chance over 30 yrs
- Wildfire 1/10 Low
- Heat 2/10 Low 7 d/yr ≥100°F today · 14 d/yr by 30 yrs out
- Wind 2/10 Low
- Air quality 2/10 Low 1 unhealthy d/yr today · 2 by 30 yrs out
Nearby sold comps map
Loading sold comps map…
Walkable amenities ~0.75 mi
Loading nearby amenities…
Taxation est. · year 1
- Rental income
- $30,166
- − Mortgage interest
- −$12,267
- − Property taxes
- −$2,446
- − Insurance
- −$1,095
- − Repairs & maintenance
- −$2,413
- − Management
- −$2,413
- − Depreciation
- −$6,371
- Taxable income
- $3,160
- Est. tax owed @ 24.0%
- −$758
- After-tax cash flow
- $5,750/yr
For passive investors: Depreciation is non-cash, so a rental often shows a tax loss while cash-flowing — sheltering income. Rental losses are passive: they offset passive income freely, and up to $25,000/yr can offset ordinary (W-2) income if you actively participate and your MAGI is under $100k (phasing out to $0 by $150k); unused losses carry forward. On sale, claimed depreciation is recaptured at up to 25%, and gains may owe capital-gains tax (a 1031 exchange can defer both). Figures are a year-1 estimate at your 24.0% rate — not tax advice; consult a CPA.
Schools (NCES district)
- District
- Minneapolis Public School District
- NCES district ID
- 2721240
- Math proficiency
- 35% ▼ -7.00%
- Reading proficiency
- 46% ▼ -1.00%
- Median HH income
- $50,521
- Composite
- 34.92/100
- National rank
- #5067
- State rank
- #217 of 301 in MN
Livability — Minneapolis
- Score
- 78/100
- State rank
- #110
- US rank
- #2525
Category grades
Schools grade is shown separately in the Schools card above.
Census & demographics
- Census place
- Minneapolis, MN
- County
- Hennepin County · 1,150,272 people
- City population
- 417,555
- Metro
- Minneapolis-St. Paul-Bloomington, MN-WI
- Population (ZIP)
- 25,102
- Household income
- $126,261
- Rent vs Own
- Severe rent burden
- 265.0
Population outlook (Hennepin County) Hauer SSP2
- Today (2025)
- 1,405,227 people
- By 2030
- 1,492,650 · +6.2%
- By 2040
- 1,660,157 · +18.1%
- By 2050
- 1,823,498 · +29.8%
- By 2075
- 2,221,283 · +58.1%
- By 2100
- 2,509,976 · +78.6%
Race, ethnicity, and origin ACS 2023
- Neighborhood character
- Predominantly White (78%)
- Race & ethnicity
- White 78% Hispanic / Latino 10% Two or more races 9% Black 5% Asian 2%
- Hispanic origin (detail)
- Mexican 8%
- Common ancestry
- Portuguese 15% Romanian 4% Lithuanian 3%
- Foreign-born
- 7% · Canada, South Korea, Jamaica
- Languages at home
- 90% English-only · Spanish 8% Other Asian/Pacific 1%
Political lean MEDSL · Hennepin
- 2024 margin
- Solid D (+42.6) · D 70.2% · R 27.5% · Other 2.3%
- 2008→2024 swing
- +14.0pp toward D · 2008: 28.6pp · 2024: 42.6pp
- All cycles
- 2024: D+42.6 2020: D+43.2 2016: D+35.3 2012: D+27.1 2008: D+28.6
Not yet ingested
- Civics
- —
Market trends
- HPI YoY
- ▼ -409.70%
- Current HPI
- 259.9141
- Rent YoY
- ▼ -1.97%
- Metro
- Minneapolis-St. Paul-Bloomington, MN-WI
- State GDP YoY
- ▲ 2.41%
- F500 in state
- 34
Industry mix (Fortune 500 HQ in MN)
| Industry | F500 HQs | Revenue |
|---|---|---|
| Healthcare | 2 | $407B |
|
||
| Retail | 2 | $150B |
|
||
| Consumer Goods | 2 | $32B |
|
||
| Industrial Machinery | 2 | $6B |
|
||
| Agriculture | 1 | $40B |
|
||
| Healthcare / Medical Devices | 1 | $32B |
|
||
Price history
+213.3% since first listed21 events — show timeline
- 2026-04-23 Pending — NORTHSTARMLS as Distributed by MLS Grid
- 2026-04-12 Contingent — NORTHSTARMLS as Distributed by MLS Grid
- 2026-04-07 Price Changed $219,000 NORTHSTARMLS as Distributed by MLS Grid
- 2026-03-30 Price Changed $223,000 NORTHSTARMLS as Distributed by MLS Grid
- 2026-03-21 Price Changed $229,000 NORTHSTARMLS as Distributed by MLS Grid
- 2026-03-09 Listed $237,000 NORTHSTARMLS as Distributed by MLS Grid
- 2026-02-07 Listing Removed — NORTHSTARMLS as Distributed by MLS Grid
- 2026-02-02 Listed $215,000 NORTHSTARMLS as Distributed by MLS Grid
- 2014-10-23 Sold (Public Records) $138,800 Public Records
- 2014-09-19 Sold (MLS) $138,800 LSAR
- 2014-09-19 Sold (MLS) $138,800 RASM
- 2014-09-19 Sold (MLS) $138,800 NORTHSTARMLS as Distributed by MLS Grid
- 2014-07-02 Pending — NORTHSTARMLS as Distributed by MLS Grid
- 2014-06-28 Listing Removed — NORTHSTARMLS as Distributed by MLS Grid
- 2014-06-13 Listed $150,000 NORTHSTARMLS as Distributed by MLS Grid
- 2014-06-13 Listed $150,000 LSAR
- 2014-06-13 Listed $150,000 RASM
- 1997-05-13 Sold (Public Records) $65,000 Public Records
- 1997-04-30 Sold (MLS) $65,000 NORTHSTARMLS as Distributed by MLS Grid
- 1997-03-04 Listing Removed — NORTHSTARMLS as Distributed by MLS Grid
- 1996-10-28 Listed $69,900 NORTHSTARMLS as Distributed by MLS Grid
Property tax history
+0.2%/yrLatest (2025): $2,446 · +14.5% YoY. Source: county tax records.
Cash-flow waterfall
monthlySold comps — $/sqft
last 12 mo · ≤1 miLoading sold comps…