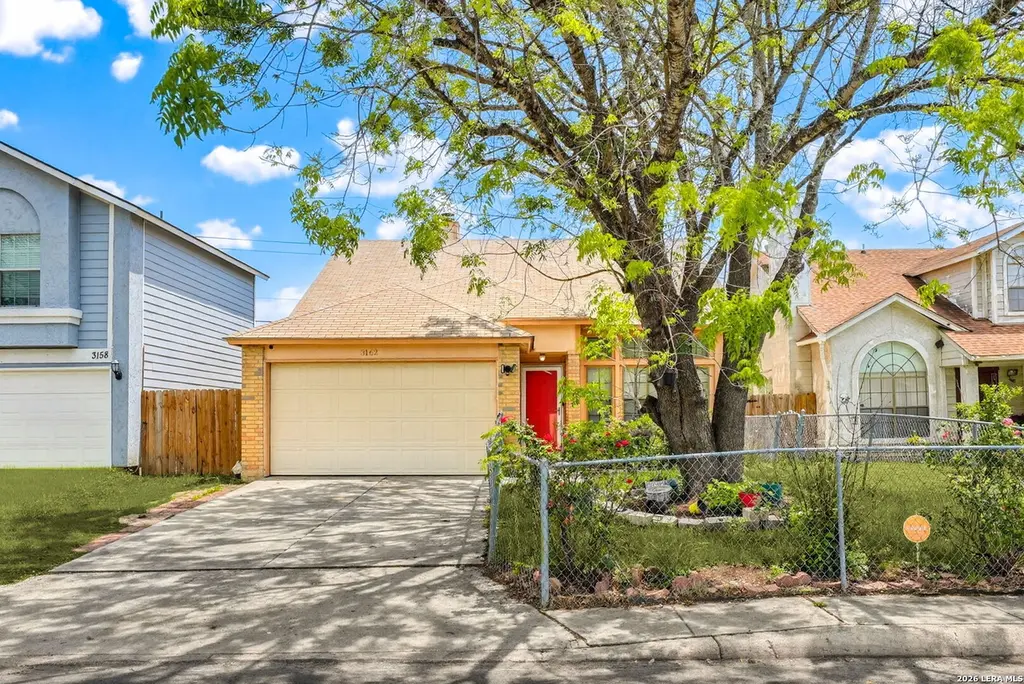
3162 Beacon Fld · San Antonio, TX
Flood risk 1/10 · Minimal
- FEMA flood zone
- X (unshaded)
- Chance of flooding over 30 yrs
- 0.0%
- Est. flood insurance / yr
- $507 – $1,088
Fire risk 5/10 · Moderate
- Est. fire insurance / yr
- $1,222 – $2,270
Heat risk 8/10 · Major
- Hot days now (above 110°F)
- 7 days/yr
- Hot days in 30 yrs
- 22 days/yr
Wind risk 6/10 · Moderate
- Chance of severe wind over 30 yrs
- 74.0%
Air-quality risk 2/10 · Minimal
- Unhealthy air days now
- 1 days/yr
- Unhealthy air days in 30 yrs
- 1 days/yr
Risk factors via First Street. Map © Google.
Why this score? — see what drove the C- grade
The composite is a weighted blend of 9 inputs, each scored 0–100. Each bar is that input's sub-score; the figure is the points it added to the 100-point composite (weight × sub-score).
- Cash flow +15.7/30.0
- ARV discount +14.7/15.0
- 1% rule +5.3/10.0
- DSCR +4.8/10.0
- Livability +4.0/5.0
- Condition / age +2.5/5.0
- Schools +2.2/10.0
- Rent growth +1.7/5.0
- Appreciation +0.0/10.0
$165,000
🖨 Deal sheet 📄 Offer letter ✓ Due diligence
Listing remarks
Discover this one-story contemporary home located in the highly sought-after Heritage Park community. Featuring 3 bedrooms and 2 full bathrooms, this home offers a functional layout with great potential for comfortable everyday living. The inviting living area includes a cozy fireplace, perfect for relaxing or gathering with guests. The open-concept design connects the living, dining, and kitchen spaces, while ceramic tile and laminate flooring throughout provide durability and easy upkeep. Situated outside city limits, the property benefits from no city taxes, adding extra value. With convenient highway access, commuting is quick and easy while still enjoying a quieter setting. This home d
Key facts
- Inviting living area
- One story home
- Contemporary home
Tags
Property features AI
Finance
- Other: Possession at closing/funding; For sale (not a short sale)
- Financial info: Down payment resources not indicated
- HOA & community: Subdivision: Heritage Park
Exterior
- Parking: Converted garage
- Utilities: City water system (SAWS); City sewer system (SAWS); Electric service by CPS; City garbage service
- Home design: Pre-owned single-family home; Front faces west
- Construction: Approximately 40 years old; Brick and wood exterior; Slab foundation; Composition roof
- Exterior features: Privacy fence; Chain link fence; Street paved; Curbs; Sidewalks
Interior
- Kitchen: Cooktop; Built-in oven; Refrigerator; Dishwasher
- Bedrooms: Master bedroom on lower level (11 x 17); Bedroom 2 (10 x 13); Bedroom 3 (10 x 10)
- Flooring: Ceramic tile; Laminate
- Bathrooms: 2 full bathrooms; Master bath with tub/shower combination (10 x 5)
- Heating & cooling: Central heating (electric); Central air conditioning
- Interior features: Ceiling fans; Open floor plan; Separate dining room; Eat-in kitchen; Converted garage; All window coverings remain; Has fireplace; 1 living area
- Laundry & utility: Washer connection; Dryer connection; Utility room (8 x 5)
Neighborhood map
What this means for you Summary
Snapshot
- This is a 3-bed/2.0-bath single-family listed at $165k.
Deal economics
- At list price, monthly cash flow is $73 ($874/yr) — positive.
- The deal already cash-flows at list — no discount required.
- Meets the 1% rule at list price ($2k rent vs $165k).
- Recommended offer: $160k (3.0% below list) — sets the bar for market timing.
- Cap rate 6.8% vs local median 3.8% in San Antonio — top-decile yield for the area; either an underpriced asset or a hidden risk that comps aren't pricing in. Stress-test before assuming the spread holds.
Location & tenants
- Location reads 80/100 on livability (#31 in TX, #1,616 nationally) — a professional / high-income tenant draw. Strengths: amenities A+, commute A+, cost of living A+; Watch: crime F.
- Southwest ISD (rural): math 21% / reading 31% proficiency, ranked #701 of 826 in TX (top 85%) — low school quality limits family demand, transient renter base, plan for 1-2y turnover; 75% free/reduced lunch — lower-income household profile, screen leases tightly.
- Zoned schools: Big Country El (math 27% / reading 30%, grade F, #2,706 of 4,322 statewide, top 63%, 617 students, 73% FRL); Southwest H S (math 17% / reading 39%, grade F, #1,170 of 1,632 statewide, top 72%, 2,152 students, 72% FRL) — zoned schools at 73% FRL track the district average.
- Market conditions: Rents falling (-3.0%/yr); 1133 active listings in the ZIP; 40 comparable units currently listed for rent nearby; rentals at typical pace (median 24d on market — plan ~3-4 weeks tenant-placement turnaround); solid renter incomes; 8,308 units permitted in Bexar County in 2024 (2,506 in 5+ unit buildings).
Forward outlook
- Local home prices are declining (-3.0%/yr); year-one equity from $1k of loan paydown is wiped out by about $5k of value loss. Plan a longer hold.
- Bexar County population projected at +50% by 2050 — long-run rental-demand tailwind backs the buy-and-hold thesis.
Negotiation context
- It's been on market 49 days — a 3% lower offer ($160k) is reasonable based on typical stale-listing flexibility.
Risks & watch-outs
- Climate carrying-cost: major wind risk, 74% chance of damaging wind over 30y; moderate wildfire risk; extreme-heat days projected 7→22/yr by 2055 (HVAC capex compounding) — expect insurance premiums to compound above CPI over the hold.
Questions for the listing agent
- It's been on market 49 days. Have you received any prior offers? Is the seller open to a 3% concession, seller financing, or rate buy-down credit?
- Is there a deadline driving the sale (1031 exchange, divorce, estate, relocation)? That informs how much negotiation room exists.
- Crime grade is F in this area — have there been break-ins, vandalism, or insurance claims at this property in the last 3 years? What carrier currently insures it and at what premium?
- What's the average days-on-market for RENTAL listings here right now (not sales)? A rising rental-DOM trend means longer vacancies and softer asking-rent achievability than the comps imply.
- What's the recent tenant-quality profile in this submarket — average credit score on applications, eviction rate, late-payment / NSF rate, and stable-employment percentage? A property-management company in the area should have these aggregated.
- How much new for-sale + rental construction is in the pipeline within 1–3 miles? Heavy new supply typically softens prices + rents 12–24 months out; constrained supply supports both.
Investment metrics
- 1% rule
- 1.03% ✓
- Cap rate
- 6.82%
- Cash-on-cash
- 1.89%
- DSCR
- 1.08
- GRM
- 8.1
CMA / ARV
- ARV (median comp)
- $196,652
- List price
- $165,000
- Delta
- -16.10%
- Verdict
- UNDERPRICED
- Comps
- 20 within 1.0 mi
Show comp detail 12 sales within ~0.75 mi
| Address | Dist | Beds/Ba | Sqft | Sold | Price | $/sf | Match |
|---|---|---|---|---|---|---|---|
| 3130 Smoke | 0.30mi | 3/2.0 | 1,329 (+1%) | 5mo | $199,700 | $150 | 80 |
| 10222 Canton Fld | 0.14mi | 3/2.5 | 1,243 (-6%) | 4mo | $183,000 | $147 | 79 |
| 10248 Aurora | 0.25mi | 3/2.5 | 1,362 (+4%) | 4mo | $165,000 | $121 | 77 |
| 3118 Bear Springs Dr | 0.18mi | 3/2.0 | 1,172 (-11%) | 1mo | $139,900 | $119 | 72 |
| 11339 Yuba Trl | 0.52mi | 3/2.0 | 1,271 (-3%) | 1mo | $219,000 | $172 | 69 |
| 11410 Hatchet Pass | 0.39mi | 3/1.0 | 1,375 (+4%) | 3mo | $134,900 | $98 | 68 |
| 11343 Two Wls | 0.62mi | 3/2.0 | 1,283 (-2%) | 4mo | $219,900 | $171 | 63 |
| 11406 Clints Wl | 0.60mi | 3/2.0 | 1,248 (-5%) | 1mo | $135,000 | $108 | 62 |
| 11339 Jarbo Pass | 0.57mi | 3/2.0 | 1,398 (+6%) | 3mo | $225,000 | $161 | 61 |
| 2963 Ash Fld | 0.38mi | 3/2.5 | 1,177 (-11%) | 4mo | $185,000 | $157 | 59 |
| 11419 Blue Mesa | 0.38mi | 3/1.5 | 1,161 (-12%) | 3mo | $195,000 | $168 | 59 |
| 4427 Donley Byu | 0.61mi | 3/2.0 | 1,428 (+8%) | 3mo | $245,000 | $172 | 54 |
Match score weights: distance 35% · size 25% · config 20% · recency 20%. Top-matched comps best support the ARV.
Projected returns pro-forma
-3.0% appreciation · 0.0% rent growth · sell at horizon
- IRR
- -17.0%
- Equity multiple
- 0.42×
- Total profit
- $-26,980
- Equity at exit
- $24,602
- IRR
- -16.7%
- Equity multiple
- 0.21×
- Total profit
- $-36,366
- Equity at exit
- $14,266
Cash invested: $46,200 (down + closing). Projections, not guarantees.
Landlord ↔ Tenant lean methodology
- Overall (STATE)
- 87 Strongly Landlord-Friendly
- State Texas
- 87 Strongly Landlord-Friendly · R+5
- County
- — inherits STATE
- City
- — inherits STATE
ZIP-level market 78245
- Home prices YoY
- -18.5%
- Rents YoY
- -3.0%
- Active inventory
- 1133
- Price-to-rent
- 8.1×
Monthly cashflow live
- Estimated rent
- $1,702 high interval (Pro) →
- Mortgage (P&I)
- −$865
- Tax from tax record
- −$338 /mo · $4,055/yr
- Insurance
- −$69
- HOA
- −$0
- Vacancy / Maint / Mgmt
- −$357
- Net cashflow
- $73
Break-even live
UW: 25.0% down · 7.5% · 30yr · 1.5% tax · 5.0% vac · 8.0% maint · 8.0% mgmt
Financing live
Cash to close
- Down payment
- $41,250
- Closing costs
- $4,950
- Reserves months
- —
- Total cash needed
- —
Loan-product check · same deal, 3 products live
Conventional
25% down · 7.5% · 30yr
- Down + closing
- —
- Monthly P&I
- —
- Monthly cashflow
- —
- DSCR
- —
- Eligible?
- —
Personal DTI + credit; lowest rate.
DSCR
20% down · 8.5% · 30yr
- Down + closing
- —
- Monthly P&I
- —
- Monthly cashflow
- —
- DSCR
- —
- Eligible?
- —
No personal income docs; deal must DSCR.
Hard money
10% down · 12.0% · 12mo
- Down + closing
- —
- Monthly P&I
- —
- Monthly cashflow
- —
- DSCR
- —
- Eligible?
- —
Short-term bridge; refi at stabilization.
Rent comps 40 comps
| Address | Beds | Baths | Sqft | Rent | $/sqft | DOM | Units | Dist |
|---|---|---|---|---|---|---|---|---|
| 3230 Bear Springs Dr San Antonio, TX | 4.0 | 2.5 | 1652 | $2,150 | $1.30 | 1d | 1 | 0.18mi |
| 10227 Brad Fld San Antonio, TX | 4.0 | 2.5 | 1443 | $1,680 | $1.16 | 43d | 1 | 0.22mi |
| 10247 Sunrise Fld San Antonio, TX | 3.0 | 2.5 | 1177 | $1,530 | $1.30 | 43d | 1 | 0.33mi |
| 10203 Sunset Fld San Antonio, TX | 3.0 | 2.0 | 1270 | $1,550 | $1.22 | 12d | 1 | 0.35mi |
| 11427 Long Trl San Antonio, TX | 3.0 | 2.5 | 1444 | $2,400 | $1.66 | 1d | 1 | 0.38mi |
| 10130 Melissa Ranch Blvd San Antonio, TX | 3.0 | 2.5 | 1641 | $1,800 | $1.10 | 24d | 1 | 0.39mi |
| 2923 Black River Ln San Antonio, TX | 3.0 | 2.0 | 1251 | $1,520 | $1.22 | 43d | 1 | 0.41mi |
| 11302 Cache Path San Antonio, TX | 3.0 | 2.5 | 1697 | $1,700 | $1.00 | 4d | 1 | 0.45mi |
| 10215 Athens Fld San Antonio, TX | 3.0 | 2.5 | 1160 | $1,499 | $1.29 | 22d | 1 | 0.45mi |
| 11510 Hatchet Pass Dr San Antonio, TX | 3.0 | 2.0 | 1385 | $2,000 | $1.44 | 24d | 1 | 0.49mi |
| 2730 Bear Springs Dr San Antonio, TX | 3.0 | 2.0 | 1582 | $1,650 | $1.04 | 14d | 1 | 0.55mi |
| 2891 Cherry Field Dr San Antonio, TX | 3.0 | 1.0 | 1136 | $1,300 | $1.14 | 24d | 1 | 0.57mi |
| 2730 Mud Lake Dr San Antonio, TX | 3.0 | 2.0 | 1287 | $1,550 | $1.20 | 24d | 1 | 0.59mi |
| 2730 Mud Lake Dr San Antonio, TX | 3.0 | 2.0 | 1287 | $1,550 | $1.20 | 4d | 1 | 0.59mi |
| 4445 Barberry Crk San Antonio, TX | 3.0 | 2.0 | 1400 | $1,650 | $1.18 | 4d | 1 | 0.60mi |
| 11331 Two Wells Dr San Antonio, TX | 2.0 | 2.0 | 1103 | $1,350 | $1.22 | 24d | 1 | 0.63mi |
| 3839 Browning Blf San Antonio, TX | 3.0 | 2.0 | 1566 | $1,899 | $1.21 | 43d | 1 | 0.65mi |
| 3735 Browning Blf San Antonio, TX | 3.0 | 2.5 | 1564 | $1,475 | $0.94 | 4d | 1 | 0.65mi |
| 10707 Rimfire Run Ln San Antonio, TX | 3.0 | 2.5 | 1680 | $1,575 | $0.94 | 24d | 1 | 0.68mi |
| 11371 Fish Spgs San Antonio, TX | 3.0 | 2.0 | 1312 | $1,475 | $1.12 | 4d | 1 | 0.69mi |
| 9911 Boxer Crk San Antonio, TX | 4.0 | 2.0 | 1357 | $1,500 | $1.11 | 43d | 1 | 0.69mi |
| 11366 Olney Spgs San Antonio, TX | 3.0 | 2.0 | 1436 | $1,395 | $0.97 | 24d | 1 | 0.71mi |
| 11442 Potter Vly San Antonio, TX | 3.0 | 2.0 | 1356 | $1,500 | $1.11 | 4d | 1 | 0.76mi |
| 10203 Raven Field Dr San Antonio, TX | 3.0 | 2.0 | 1235 | $1,700 | $1.38 | 24d | 1 | 0.76mi |
| 10239 Raven Field Dr San Antonio, TX | 3.0 | 2.5 | 1252 | $1,655 | $1.32 | 11d | 1 | 0.77mi |
| 10243 Raven Field Dr San Antonio, TX | 3.0 | 2.0 | 1023 | $1,700 | $1.66 | 43d | 1 | 0.77mi |
| 10051 Raven Field Dr San Antonio, TX | 4.0 | 2.0 | 1729 | $2,200 | $1.27 | 24d | 1 | 0.85mi |
| 2422 Buffalo Pass Dr San Antonio, TX | 3.0 | 2.5 | 1500 | $1,500 | $1.00 | 43d | 1 | 0.85mi |
| 10919 Livewater Trl San Antonio, TX | 3.0 | 2.5 | 1812 | $1,595 | $0.88 | 43d | 1 | 0.89mi |
| 2210 Muddy Peak Dr San Antonio, TX | 3.0 | 2.5 | 1623 | $1,650 | $1.02 | 24d | 1 | 0.90mi |
| 10909 Charreada Trl San Antonio, TX | 3.0 | 2.0 | 1739 | $1,800 | $1.04 | 24d | 1 | 0.93mi |
| 10943 Livewater Trl San Antonio, TX | 3.0 | 2.5 | 1812 | $1,900 | $1.05 | 24d | 1 | 0.94mi |
| 10314 Lynwood Vlg Unit 102 San Antonio, TX | 3.0 | 2.5 | 1356 | $1,550 | $1.14 | 17d | 1 | 0.96mi |
| 11326 Widefield Ln San Antonio, TX | 3.0 | 2.0 | 1328 | $1,425 | $1.07 | 43d | 1 | 0.97mi |
| 2318 Tulipwood Cv Unit 101 San Antonio, TX | 3.0 | 2.5 | 1357 | $1,625 | $1.20 | 24d | 1 | 0.98mi |
| 9605 U.S. 90 San Antonio, TX | 2.0 | 2.0 | 1020 | $1,249 | $1.22 | 1d | 1 | 1.00mi |
| 2515 Lynwood Bnd San Antonio, TX | 3.0 | 2.5 | 1357 | $1,495 | $1.10 | 4d | 1 | 1.00mi |
| 10303 Candlewood Way #101 San Antonio, TX | 3.0 | 2.5 | 1357 | $1,499 | $1.10 | 24d | 1 | 1.03mi |
| 10311 Candlewood Way #101 San Antonio, TX | 3.0 | 2.5 | 1357 | $1,575 | $1.16 | 24d | 1 | 1.04mi |
| 10338 Lynwood Br Unit 101 San Antonio, TX | 3.0 | 2.5 | 1380 | $1,500 | $1.09 | 43d | 1 | 1.05mi |
Listing history 16 events
-
2026-06-18days on market $165,000 Active 49 DOM
-
2026-06-17days on market $165,000 Active 48 DOM
-
2026-06-16days on market $165,000 Active 47 DOM
-
2026-06-15days on market $165,000 Active 46 DOM
-
2026-06-13statusdays on market $165,000 Active 44 DOM
-
2026-06-09days on market $165,000 Price Change 40 DOM
-
2026-06-08days on market $165,000 Price Change 39 DOM
-
2026-06-07days on market $165,000 Price Change 38 DOM
-
2026-06-04days on market $165,000 Price Change 35 DOM
-
2026-06-03days on market $165,000 Price Change 34 DOM
-
2026-06-02days on market $165,000 Price Change 33 DOM
-
2026-06-02pricestatus $165,000 Price Change 32 DOM
-
2026-06-01statusdays on market $178,000 Active 32 DOM
-
2026-05-31days on market $178,000 Price Change 31 DOM
-
2026-04-30$188,000 New 942-char remark
-
1987-01-01soldstatus
ⓘ Source: listings_history table (triggers on properties + properties_extension) + one-shot
backfill from property_details.listing_events for pre-trigger history.
Tax reassessment forecast TX · Resets to sale price
- Current annual tax
- $4,055 · $338/mo
- Projected year-2 tax
- $4,055 · $338/mo
- Expected delta
- $0/yr ($0/mo · 0.0%)
ⓘ Screening estimate from a state-policy table — verify with the county assessor before closing.
Climate risk First Street
- Flood 1/10 Low FEMA zone X (unshaded) · 0% chance over 30 yrs
- Wildfire 5/10 Major
- Heat 8/10 Severe 7 d/yr ≥110°F today · 22 d/yr by 30 yrs out
- Wind 6/10 Major 74% chance of damaging wind over 30 yrs
- Air quality 2/10 Low 1 unhealthy d/yr today · 1 by 30 yrs out
Nearby sold comps map
Loading sold comps map…
Walkable amenities ~0.75 mi
Loading nearby amenities…
Taxation est. · year 1
- Rental income
- $20,427
- − Mortgage interest
- −$9,243
- − Property taxes
- −$4,055
- − Insurance
- −$825
- − Repairs & maintenance
- −$1,634
- − Management
- −$1,634
- − Depreciation
- −$4,800
- Taxable loss
- −$1,764
- Est. tax savings @ 24.0%
- +$423
- After-tax cash flow
- $1,297/yr
For passive investors: Depreciation is non-cash, so a rental often shows a tax loss while cash-flowing — sheltering income. Rental losses are passive: they offset passive income freely, and up to $25,000/yr can offset ordinary (W-2) income if you actively participate and your MAGI is under $100k (phasing out to $0 by $150k); unused losses carry forward. On sale, claimed depreciation is recaptured at up to 25%, and gains may owe capital-gains tax (a 1031 exchange can defer both). Figures are a year-1 estimate at your 24.0% rate — not tax advice; consult a CPA.
Schools (NCES district)
- District
- Southwest ISD
- NCES district ID
- 4840950
- Math proficiency
- 21% ▼ -21.00%
- Reading proficiency
- 31% ▼ -5.00%
- Median HH income
- $43,362
- Composite
- 22.22/100
- National rank
- #8153
- State rank
- #701 of 826 in TX
Livability — San Antonio
- Score
- 80/100
- State rank
- #31
- US rank
- #1616
Category grades
Schools grade is shown separately in the Schools card above.
Census & demographics
- County
- Bexar County · 1,990,555 people
- City population
- 1,806,925
- Metro
- San Antonio-New Braunfels, TX
- Population (ZIP)
- 96,015
- Household income
- $90,029
- Rent vs Own
- Severe rent burden
- 2466.0
Population outlook (Bexar County) Hauer SSP2
- Today (2025)
- 2,336,851 people
- By 2030
- 2,560,728 · +9.6%
- By 2040
- 3,020,569 · +29.3%
- By 2050
- 3,493,522 · +49.5%
- By 2075
- 4,668,459 · +99.8%
- By 2100
- 5,533,242 · +136.8%
Race, ethnicity, and origin ACS 2023
- Neighborhood character
- Majority Hispanic (64%)
- Race & ethnicity
- Hispanic / Latino 64% Two or more races 27% White 20% Black 9% Asian 2%
- Hispanic origin (detail)
- Mexican 53% Puerto Rican 2%
- Common ancestry
- Slovak 1% Lithuanian 1% Romanian 1%
- Foreign-born
- 9% · Canada, Vietnam
- Languages at home
- 66% English-only · Spanish 30% Arabic 1% Tagalog/Filipino 1%
Political lean MEDSL · Bexar
- 2024 margin
- Lean D (+9.8) · D 54.3% · R 44.6% · Other 1.1%
- 2008→2024 swing
- +4.2pp toward D · 2008: 5.6pp · 2024: 9.8pp
- All cycles
- 2024: D+9.8 2020: D+18.2 2016: D+13.5 2012: D+4.6 2008: D+5.6
Not yet ingested
- Civics
- —
Market trends
- HPI YoY
- ▼ -53.31%
- Current HPI
- 234.7931
- Rent YoY
- ▼ -3.02%
- Metro
- San Antonio-New Braunfels, TX
- State GDP YoY
- ▲ 3.95%
- F500 in state
- 110
Industry mix (Fortune 500 HQ in TX)
| Industry | F500 HQs | Revenue |
|---|---|---|
| Energy | 16 | $1,198B |
|
||
| Technology | 5 | $198B |
|
||
| Engineering / Construction | 4 | $72B |
|
||
| Energy Services | 3 | $60B |
|
||
| Utilities | 3 | $41B |
|
||
| Healthcare | 2 | $330B |
|
||
Price history
-12.2% since first listed4 events — show timeline
- 2026-06-02 Price Changed $165,000 LERA
- 2026-05-21 Price Changed $178,000 LERA
- 2026-04-30 Listed $188,000 LERA
- 1987-01-01 Sold (Public Records) — Public Records
Property tax history
+7.2%/yrLatest (2025): $4,055 · +5.4% YoY. Source: county tax records.
Cash-flow waterfall
monthlySold comps — $/sqft
last 12 mo · ≤1 miLoading sold comps…