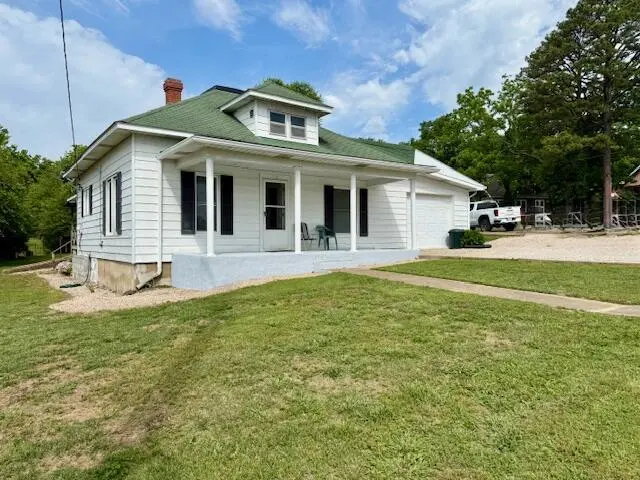
110 N Pine St · Mountain View, MO
Flood risk 1/10 · Minimal
- FEMA flood zone
- X (unshaded)
- Chance of flooding over 30 yrs
- 0.0%
- Est. flood insurance / yr
- $473 – $860
Fire risk 5/10 · Moderate
- Est. fire insurance / yr
- $1,054 – $1,958
Heat risk 5/10 · Moderate
- Hot days now (above 105°F)
- 7 days/yr
- Hot days in 30 yrs
- 20 days/yr
Wind risk 2/10 · Minimal
- Chance of severe wind over 30 yrs
- 1.0%
Air-quality risk 2/10 · Minimal
- Unhealthy air days now
- 0 days/yr
- Unhealthy air days in 30 yrs
- 1 days/yr
Risk factors via First Street. Map © Google.
Why this score? — see what drove the C grade
The composite is a weighted blend of 9 inputs, each scored 0–100. Each bar is that input's sub-score; the figure is the points it added to the 100-point composite (weight × sub-score).
- Cash flow +25.4/30.0
- DSCR +8.4/10.0
- ARV discount +7.5/15.0
- 1% rule +5.5/10.0
- Livability +3.4/5.0
- Schools +3.3/10.0
- Rent growth +2.5/5.0
- Condition / age +2.5/5.0
- Appreciation +0.0/10.0
$79,900
🖨 Deal sheet 📄 Offer letter ✓ Due diligence
Listing remarks MLS
Two bedroom, one bath home located in walking distance to downtown Mtn. View, MO. One car attached garage, gazebo on the back deck with storm shelter underneath it and large back yard.
Key facts
- Large front porch
- Sunroom mudroom
- Covered back deck
Tags
Property features AI
Exterior
- Parking: Driveway; Garage that faces the front (1 garage space)
- Security: Fire alarm
- Utilities: Public water; Public sewer; Propane available; Cable available
- Home design: Single-family residence; One story
- Construction: Aluminum siding; Composition roof
- Exterior features: Rain gutters; Garden; Covered deck and front porch; Gazebo
Interior
- Kitchen: Gas oven; Refrigerator
- Flooring: Laminate flooring; Vinyl flooring
- Bathrooms: 1 full bathroom
- Heating & cooling: Propane heating; Ceiling fan(s); Window air unit(s)
- Interior features: Laminate counters; Insulated windows with blinds, shutters and window coverings; Double-pane windows
- Laundry & utility: Laundry on the main level; Electric water heater
Neighborhood map
What this means for you Summary
Snapshot
- This is a 2-bed/1.0-bath other listed at $80k.
Deal economics
- At list price, monthly cash flow is $185 ($2k/yr) — positive.
- The deal already cash-flows at list — no discount required.
- Meets the 1% rule at list price ($836 rent vs $80k).
- Cap rate 9.1% vs local median 3.9% in Mountain View — top-decile yield for the area; either an underpriced asset or a hidden risk that comps aren't pricing in. Stress-test before assuming the spread holds.
Location & tenants
- Location reads 67/100 on livability (#212 in MO) — a middle-class / working-renter tenant base. Strengths: cost of living A+, housing A+, crime B+; Watch: employment C-, amenities F, commute F.
- Mountain View-Birch Tree R-III (rural): math 41% / reading 41% proficiency, ranked #158 of 324 in MO (top 49%) — families likely to look elsewhere, expect single-tenant / working-renter base with shorter leases.
- Zoned schools: Mountain View Elem. (math 40% / reading 41%, grade F, #525 of 1,115 statewide, top 47%, 404 students, 55% FRL); Liberty Sr. High (math 67% / reading 57%, grade B-, #28 of 521 statewide, top 6%, 341 students, 59% FRL) — zoned schools at 57% FRL track the district average.
- Market conditions: 60 active listings in the ZIP; 53 units permitted in Howell County in 2024 (0 in 5+ unit buildings).
Forward outlook
- Local home prices are declining (-3.0%/yr); year-one equity from $552 of loan paydown is wiped out by about $2k of value loss. Plan a longer hold.
- Howell County population projected at -18% by 2050 — secular population decline; favor cash flow + early exit over multi-decade hold.
Negotiation context
- Only 2 days on market — expect competitive offers; lowballing is unlikely to land.
- 2 sale attempts since 7y ago with the ask held roughly flat each time — persistent listings suggest the price (not the market) is what's stuck; bring a comps-based counter.
Risks & watch-outs
- Watch-outs: built in 1900 — expect roof / HVAC / electrical / plumbing capex.
- Climate carrying-cost: moderate wildfire risk; extreme-heat days projected 7→20/yr by 2055 (HVAC capex compounding) — expect insurance premiums to compound above CPI over the hold.
Questions for the listing agent
- Built in 1900 — when were the roof, HVAC, electrical panel, plumbing, and water heater last replaced?
- Is there a deadline driving the sale (1031 exchange, divorce, estate, relocation)? That informs how much negotiation room exists.
- Schools are F-rated, which usually means shorter tenancies and higher turnover. Who's the typical renter profile here, and what's been the actual vacancy rate?
- What's the average days-on-market for RENTAL listings here right now (not sales)? A rising rental-DOM trend means longer vacancies and softer asking-rent achievability than the comps imply.
- What's the recent tenant-quality profile in this submarket — average credit score on applications, eviction rate, late-payment / NSF rate, and stable-employment percentage? A property-management company in the area should have these aggregated.
- How much new for-sale + rental construction is in the pipeline within 1–3 miles? Heavy new supply typically softens prices + rents 12–24 months out; constrained supply supports both.
Investment metrics
- 1% rule
- 1.05% ✓
- Cap rate
- 9.07%
- Cash-on-cash
- 9.92%
- DSCR
- 1.44
- GRM
- 8.0
CMA / ARV
No comps found within radius.
Projected returns pro-forma
-3.0% appreciation · 3.0% rent growth · sell at horizon
- IRR
- -1.4%
- Equity multiple
- 0.95×
- Total profit
- $-1,197
- Equity at exit
- $11,913
- IRR
- 8.2%
- Equity multiple
- 1.63×
- Total profit
- $13,992
- Equity at exit
- $6,908
Cash invested: $22,372 (down + closing). Projections, not guarantees.
Landlord ↔ Tenant lean methodology
- Overall (STATE)
- 81 Strongly Landlord-Friendly
- State Missouri
- 81 Strongly Landlord-Friendly · R+10
- County
- — inherits STATE
- City
- — inherits STATE
ZIP-level market 65548
- Home prices YoY
- -9.3%
- Active inventory
- 60
- Price-to-rent
- 8.0×
Monthly cashflow live
- Estimated rent
- $836 medium interval (Pro) →
- Mortgage (P&I)
- −$419
- Tax from tax record
- −$23 /mo · $278/yr
- Insurance
- −$33
- HOA
- −$0
- Vacancy / Maint / Mgmt
- −$176
- Net cashflow
- $185
Break-even live
UW: 25.0% down · 7.5% · 30yr · 1.5% tax · 5.0% vac · 8.0% maint · 8.0% mgmt
Financing live
Cash to close
- Down payment
- $19,975
- Closing costs
- $2,397
- Reserves months
- —
- Total cash needed
- —
Loan-product check · same deal, 3 products live
Conventional
25% down · 7.5% · 30yr
- Down + closing
- —
- Monthly P&I
- —
- Monthly cashflow
- —
- DSCR
- —
- Eligible?
- —
Personal DTI + credit; lowest rate.
DSCR
20% down · 8.5% · 30yr
- Down + closing
- —
- Monthly P&I
- —
- Monthly cashflow
- —
- DSCR
- —
- Eligible?
- —
No personal income docs; deal must DSCR.
Hard money
10% down · 12.0% · 12mo
- Down + closing
- —
- Monthly P&I
- —
- Monthly cashflow
- —
- DSCR
- —
- Eligible?
- —
Short-term bridge; refi at stabilization.
Listing history 8 events
-
2026-05-22status Pending
-
2026-05-19$79,900 Active
-
2020-12-18soldstatus 184-char remark
Show marketing remark (184 chars)
Two bedroom, one bath home located in walking distance to downtown Mtn. View, MO. One car attached garage, gazebo on the back deck with storm shelter underneath it and large back yard.
-
2020-12-18soldstatus 184-char remark
Show marketing remark (184 chars)
Two bedroom, one bath home located in walking distance to downtown Mtn. View, MO. One car attached garage, gazebo on the back deck with storm shelter underneath it and large back yard.
-
2020-12-18soldstatus
Show marketing remark (184 chars)
Two bedroom, one bath home located in walking distance to downtown Mtn. View, MO. One car attached garage, gazebo on the back deck with storm shelter underneath it and large back yard.
-
2019-09-04$51,500 184-char remark
Show marketing remark (184 chars)
Two bedroom, one bath home located in walking distance to downtown Mtn. View, MO. One car attached garage, gazebo on the back deck with storm shelter underneath it and large back yard.
-
2007-06-18soldstatus
-
1975-11-04soldstatus
ⓘ Source: listings_history table (triggers on properties + properties_extension) + one-shot
backfill from property_details.listing_events for pre-trigger history.
Tax reassessment forecast MO · Resets to sale price
- Current annual tax
- $278 · $23/mo
- Projected year-2 tax
- $775 · $65/mo
- Expected delta
- +$497/yr (+$41/mo · 179.1%)
ⓘ Screening estimate from a state-policy table — verify with the county assessor before closing.
Climate risk First Street
- Flood 1/10 Low FEMA zone X (unshaded) · 0% chance over 30 yrs
- Wildfire 5/10 Major
- Heat 5/10 Major 7 d/yr ≥105°F today · 20 d/yr by 30 yrs out
- Wind 2/10 Low 100% chance of damaging wind over 30 yrs
- Air quality 2/10 Low 0 unhealthy d/yr today · 1 by 30 yrs out
Nearby sold comps map
Loading sold comps map…
Walkable amenities ~0.75 mi
Loading nearby amenities…
Taxation est. · year 1
- Rental income
- $10,032
- − Mortgage interest
- −$4,476
- − Property taxes
- −$278
- − Insurance
- −$400
- − Repairs & maintenance
- −$803
- − Management
- −$803
- − Depreciation
- −$2,324
- Taxable income
- $950
- Est. tax owed @ 24.0%
- −$228
- After-tax cash flow
- $1,992/yr
For passive investors: Depreciation is non-cash, so a rental often shows a tax loss while cash-flowing — sheltering income. Rental losses are passive: they offset passive income freely, and up to $25,000/yr can offset ordinary (W-2) income if you actively participate and your MAGI is under $100k (phasing out to $0 by $150k); unused losses carry forward. On sale, claimed depreciation is recaptured at up to 25%, and gains may owe capital-gains tax (a 1031 exchange can defer both). Figures are a year-1 estimate at your 24.0% rate — not tax advice; consult a CPA.
Schools (NCES district)
- District
- Mountain View-Birch Tree R-III
- NCES district ID
- 2921540
- Math proficiency
- 41% ▲ 6.00%
- Reading proficiency
- 41% ▼ -1.00%
- Median HH income
- $28,871
- Composite
- 33.31/100
- National rank
- #5505
- State rank
- #158 of 324 in MO
Livability — Mountain View
- Score
- 67/100
- State rank
- #212
- US rank
- #10599
Category grades
Schools grade is shown separately in the Schools card above.
Census & demographics
- Census place
- Mountain View, MO
- City population
- 6,432
- Population (ZIP)
- 6,432
Population outlook (Howell County) Hauer SSP2
- Today (2025)
- 38,462 people
- By 2030
- 37,240 · -3.2%
- By 2040
- 34,495 · -10.3%
- By 2050
- 31,450 · -18.2%
- By 2075
- 23,660 · -38.5%
- By 2100
- 16,373 · -57.4%
Race, ethnicity, and origin ACS 2023
- Neighborhood character
- Predominantly White (93%)
- Race & ethnicity
- White 93% Two or more races 4% Hispanic / Latino 4%
- Common ancestry
- Lithuanian 6% Subsaharan African 3% Serbian 2%
- Foreign-born
- 1% · Canada
- Languages at home
- 99% English-only · Spanish 1%
Political lean MEDSL · Howell
- 2024 margin
- Solid R (+66.8) · D 16.2% · R 83.0%
- 2008→2024 swing
- -36.0pp toward R · 2008: -30.8pp · 2024: -66.8pp
- All cycles
- 2024: R+66.8 2020: R+64.2 2016: R+63.2 2012: R+43.8 2008: R+30.8
Not yet ingested
- Civics
- —
Market trends
- HPI YoY
- ▼ -21.62%
- Current HPI
- 211.4148
- Rent YoY
- —
- Metro
- —
- State GDP YoY
- ▲ 1.84%
- F500 in state
- 20
Industry mix (Fortune 500 HQ in MO)
| Industry | F500 HQs | Revenue |
|---|---|---|
| Healthcare | 1 | $163B |
|
||
| Insurance | 1 | $21B |
|
||
| Industrial Technology | 1 | $17B |
|
||
| Retail | 1 | $16B |
|
||
| Industrial Distribution | 1 | $10B |
|
||
| Utilities | 1 | $9B |
|
||
Price history
+55.1% since first listed8 events — show timeline
- 2026-05-22 Pending — SOMO
- 2026-05-19 Listed $79,900 SOMO
- 2020-12-18 Sold (Public Records) — Public Records
- 2020-12-18 Sold (MLS) — MARIS as Distributed by MLS Grid
- 2020-12-18 Sold (MLS) — SOMO
- 2019-09-04 Listed $51,500 SOMO
- 2007-06-18 Sold (Public Records) — Public Records
- 1975-11-04 Sold (Public Records) — Public Records
Property tax history
+1.9%/yrLatest (2025): $278 · +0.1% YoY. Source: county tax records.
Cash-flow waterfall
monthlySold comps — $/sqft
last 12 mo · ≤1 miLoading sold comps…