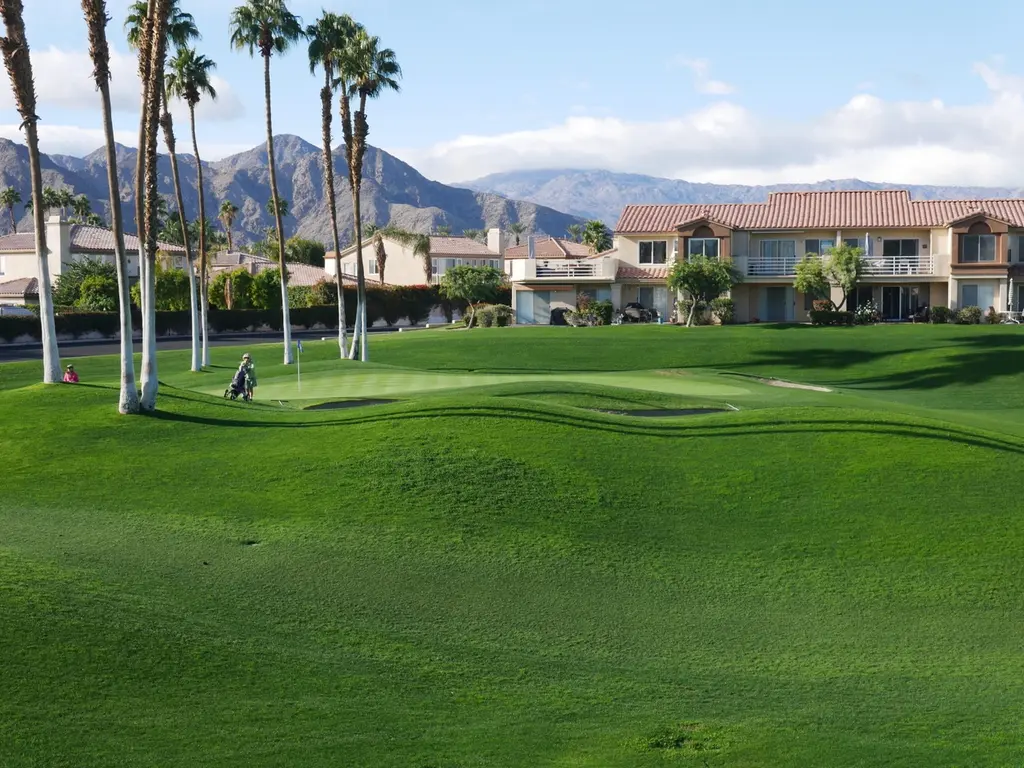
78431 Magenta Dr · La Quinta, CA
Flood risk 1/10 · Minimal
- FEMA flood zone
- X (unshaded)
- Chance of flooding over 30 yrs
- 0.0%
- Est. flood insurance / yr
- $507 – $1,088
Fire risk 5/10 · Moderate
- Est. fire insurance / yr
- $659 – $1,223
Heat risk 9/10 · Severe
- Hot days now (above 114°F)
- 7 days/yr
- Hot days in 30 yrs
- 18 days/yr
Wind risk 1/10 · Minimal
- Chance of severe wind over 30 yrs
- —
Air-quality risk 4/10 · Minor
- Unhealthy air days now
- 4 days/yr
- Unhealthy air days in 30 yrs
- 5 days/yr
Risk factors via First Street. Map © Google.
Why this score? — see what drove the D grade
The composite is a weighted blend of 9 inputs, each scored 0–100. Each bar is that input's sub-score; the figure is the points it added to the 100-point composite (weight × sub-score).
- ARV discount +15.0/15.0
- Cash flow +7.3/30.0
- Rent growth +4.1/5.0
- 1% rule +4.0/10.0
- Schools +3.8/10.0
- Livability +2.9/5.0
- Condition / age +2.5/5.0
- DSCR +1.4/10.0
- Appreciation +0.0/10.0
$284,000
🖨 Deal sheet (PDF) 📄 Offer letter ✓ Due diligence
Listing remarks
This upper-level, west-facing condo offers panoramic fairway and mountain views. The home features vaulted ceilings, and is decorated in warm, neutral tones. Energy-efficient upgrades include newer ceiling fans and an efficient HVAC system. Built later than most of the community, the building provides more modern amenities and design. Located in a quiet interior section, the home offers quick access to the pool and spa and includes a 1-car garage. The community offers an exceptional array of amenities: six pools and spas, tennis and pickleball courts, and UNLIMITED golf on a Ted Robinson-designed par-3 course. As the new headquarters for Helix Disc Golf, the complex also appeals to disc-gol
Key facts
- Modern amenities
- Quick access to pool
- $575 HOA
Tags
Property features AI
Finance
- Other: Fee simple land; Rental restrictions apply (has rental restrictions); Short term rentals not allowed; Will not consider lease
- HOA & community: Monthly HOA fee of $575; HOA covers building and grounds, trash, cable TV and clubhouse; Community amenities include clubhouse, banquet facilities, tennis courts, golf course (par 3), golf course within development, maintenance/management, pet rules; Gated community; Association has pet rules
Exterior
- Parking: Detached 1-car garage; Unassigned additional parking (total 1 parking space)
- Security: Automatic gate; Controlled access (community)
- Utilities: Sewer connected and paid; Cable TV available; Electric service
- Home design: Condominium (attached); Two stories; Two-level layout; Year built (assessor)
- Construction: Assessor-sourced year built
- Exterior features: Automatic gated access; Balcony; Community in-ground pool with safety gate; Community in-ground spa/hot tub; Near public transit; On golf course; Golf course, panoramic and mountain views; Leisure-facing west
Interior
- Kitchen: Electric range; Microwave; Refrigerator; Dishwasher; Garbage disposal
- Flooring: Concrete; Ceramic tile
- Bathrooms: One full bathroom with shower over tub
- Heating & cooling: Heat pump heating; Central air conditioning
- Interior features: Cathedral ceilings; Fully furnished
- Laundry & utility: Washer and dryer (laundry in closet)
Neighborhood map
What this means for you Summary
Snapshot
- This is a 1-bed/2.0-bath condo listed at $284k.
Deal economics
- At list price, monthly cash flow is $-382 ($-5k/yr) — negative.
- To cash-flow at today's rent, offer at most $217k (23.7% below list).
- To meet the 1% rule (rent ≥ 1% of price), the offer needs to be $255k (10.3% below list).
- Recommended offer: $217k (23.7% below list) — sets the bar for cash-flow.
- Cap rate 4.7% vs local median 3.3% in La Quinta — top-decile yield for the area; either an underpriced asset or a hidden risk that comps aren't pricing in. Stress-test before assuming the spread holds.
Location & tenants
- Location reads 58/100 on livability (#694 in CA) — a working-class tenant base; expect higher turnover. Strengths: commute A-, employment B+, housing B+; Watch: amenities F, cost of living F, health & safety F.
- Desert Sands Unified (suburban): math 31% / reading 56% proficiency, ranked #199 of 517 in CA (top 38%) — families likely to look elsewhere, expect single-tenant / working-renter base with shorter leases.
- Zoned schools: Gerald R. Ford Elementary (math 24% / reading 24%, grade F, #973 of 1,571 statewide, top 73%, 603 students, 59% FRL); John Glenn Middle School of International Studies (math 10% / reading 10%, grade F, #474 of 498 statewide, top 99%, 1,045 students, 64% FRL); La Quinta High (math 31% / reading 65%, grade D, #380 of 1,170 statewide, top 33%, 2,500 students, 74% FRL).
- Zoned-school proficiency averages 28% at this address vs 44% district-wide (-16 pts) — the specific schools serving this property underperform the Desert Sands Unified average; the district grade overstates school quality for this exact location.
- Market conditions: Rents rising fast (+6.5%/yr); 660 active listings in the ZIP; 30 comparable units currently listed for rent nearby; rentals at typical pace (median 22d on market — plan ~3-4 weeks tenant-placement turnaround); solid renter incomes; 9,195 units permitted in Riverside County in 2024 (1,512 in 5+ unit buildings).
Forward outlook
- Local home prices are declining (-3.0%/yr); year-one equity from $2k of loan paydown is wiped out by about $9k of value loss. Plan a longer hold.
- Riverside County population projected at +22% by 2050 — long-run rental-demand tailwind backs the buy-and-hold thesis.
Negotiation context
- It's been on market 40 days — a 3% lower offer ($275k) is reasonable based on typical stale-listing flexibility.
- 12 sale attempts since 28y ago with the ask held roughly flat each time — persistent listings suggest the price (not the market) is what's stuck; bring a comps-based counter.
- Current owner paid $149k; list at $284k implies a 91% gain — meaningful room to come down on a strong offer.
Risks & watch-outs
- Watch-outs: HOA is 23% of rent.
- Climate carrying-cost: moderate wildfire risk; extreme-heat days projected 7→18/yr by 2055 (HVAC capex compounding) — expect insurance premiums to compound above CPI over the hold.
Questions for the listing agent
- What do current leases actually rent for vs. the listed asking? Can we see a recent rent roll and the last 12 months of T-12 income?
- It's been on market 40 days. Have you received any prior offers? Is the seller open to a 24% concession, seller financing, or rate buy-down credit?
- What does the HOA fee cover, when was the last increase, and are there any pending special assessments or reserve-fund shortfalls?
- Any open or pending special assessments — roof, HVAC, plumbing, elevator, façade? What's the per-unit balance and payoff schedule, and is the seller paying it off at close or rolling it to the buyer?
- Is there a deadline driving the sale (1031 exchange, divorce, estate, relocation)? That informs how much negotiation room exists.
- Schools are D-rated, which usually means shorter tenancies and higher turnover. Who's the typical renter profile here, and what's been the actual vacancy rate?
- The area grade is low — what's the realistic commute time and amenity access for the typical tenant pool here? Any planned neighborhood developments (good or bad) we should know about?
- What's the average days-on-market for RENTAL listings here right now (not sales)? A rising rental-DOM trend means longer vacancies and softer asking-rent achievability than the comps imply.
- What's the recent tenant-quality profile in this submarket — average credit score on applications, eviction rate, late-payment / NSF rate, and stable-employment percentage? A property-management company in the area should have these aggregated.
- How much new apartment / multifamily construction is in the pipeline within 1–3 miles? Heavy new supply (>2% of stock underway) typically softens rents 12–24 months out; light construction supports rent growth.
Investment metrics
- 1% rule
- 0.90% ✗
- Cap rate
- 4.68%
- Cash-on-cash
- -5.76%
- DSCR
- 0.74
- GRM
- 9.3
CMA / ARV
- ARV (median comp)
- $359,370
- List price
- $284,000
- Delta
- -20.97%
- Verdict
- UNDERPRICED
- Comps
- 20 within 1.0 mi
Projected returns pro-forma
-3.0% appreciation · 6.45% rent growth · sell at horizon
- IRR
- -21.3%
- Equity multiple
- 0.23×
- Total profit
- $-60,879
- Equity at exit
- $42,345
- IRR
- -7.2%
- Equity multiple
- 0.46×
- Total profit
- $-42,779
- Equity at exit
- $24,555
Cash invested: $79,520 (down + closing). Projections, not guarantees.
Landlord ↔ Tenant lean methodology
- Overall (STATE)
- 18 Strongly Tenant-Friendly
- State California
- 18 Strongly Tenant-Friendly · D+13
- County
- — inherits STATE
- City
- — inherits STATE
ZIP-level market 92253
- Rents YoY
- 6.5%
- Active inventory
- 660
- Price-to-rent
- 9.3×
Monthly cashflow live
- Estimated rent
- $2,547 high interval (Pro) →
- Mortgage (P&I)
- −$1,489
- Tax from tax record
- −$211 /mo · $2,538/yr
- Insurance
- −$118
- HOA
- −$575
- Vacancy / Maint / Mgmt
- −$535
- Net cashflow
- $-382
Break-even live
Sensitivity live
| Price | -10% $-221 | -5% $-301 | +0% $-382 | +5% $-462 | +10% $-542 |
|---|---|---|---|---|---|
| Rent | -10% $-583 | -5% $-482 | +0% $-382 | +5% $-281 | +10% $-180 |
| Rate | -1.0pp $-239 | -0.5pp $-309 | base $-382 | +0.5pp $-455 | +1.0pp $-530 |
UW: 25.0% down · 7.5% · 30yr · 1.5% tax · 5.0% vac · 8.0% maint · 8.0% mgmt
Financing live
Cash to close
- Down payment
- $71,000
- Closing costs
- $8,520
- Reserves months
- —
- Total cash needed
- —
Loan-product check · same deal, 3 products live
Conventional
25% down · 7.5% · 30yr
- Down + closing
- —
- Monthly P&I
- —
- Monthly cashflow
- —
- DSCR
- —
- Eligible?
- —
Personal DTI + credit; lowest rate.
DSCR
20% down · 8.5% · 30yr
- Down + closing
- —
- Monthly P&I
- —
- Monthly cashflow
- —
- DSCR
- —
- Eligible?
- —
No personal income docs; deal must DSCR.
Hard money
10% down · 12.0% · 12mo
- Down + closing
- —
- Monthly P&I
- —
- Monthly cashflow
- —
- DSCR
- —
- Eligible?
- —
Short-term bridge; refi at stabilization.
Rent comps 30 comps
| Address | Beds | Baths | Sqft | Rent | $/sqft | DOM | Units | Dist |
|---|---|---|---|---|---|---|---|---|
| 78435 Magenta Dr La Quinta, CA | 2.0 | 2.0 | 912 | $3,500 | $3.84 | 7d | 1 | 0.02mi |
| 78490 Via Palomino Unit 101 La Quinta, CA | 1.0 | 1.0 | 560 | $1,800 | $3.21 | 45d | 1 | 0.13mi |
| 78301 Terra Cotta Ct La Quinta, CA | 2.0 | 2.0 | 926 | $2,200 | $2.38 | 18d | 1 | 0.16mi |
| 78167 Crimson Ct La Quinta, CA | 1.0 | 1.0 | 763 | $2,180 | $2.86 | 23d | 1 | 0.30mi |
| 78149 Indigo Dr La Quinta, CA | 1.0 | 1.5 | 763 | $2,300 | $3.01 | 20d | 1 | 0.31mi |
| 78069 Cobalt Ct La Quinta, CA | 1.0 | 1.0 | 763 | $3,500 | $4.59 | 20d | 1 | 0.36mi |
| 43100 Palm Royale Dr La Quinta, CA | 1.0–2.0 | 1.0–2.0 | 921 | $2,060 | $2.24 | 1d | 8 | 0.64mi |
| 43065 Washington St Palm Desert, CA | 2.0 | 2.0 | 950 | $2,000 | $2.11 | 6d | 1 | 0.78mi |
| 43065 Washington St Unit 14 Palm Desert, CA | 2.0 | 2.0 | 975 | $2,100 | $2.15 | 12d | 1 | 0.80mi |
| 42780 Washington St Bermuda Dunes, CA | 2.0 | 2.0 | 1020 | $1,750 | $1.72 | 45d | 1 | 0.92mi |
| 77901 Dudley Dr Palm Desert, CA | 2.0 | 1.5 | 950 | $1,975 | $2.08 | 6d | 1 | 0.94mi |
| 77845 California Dr Unit D2 Palm Desert, CA | 1.0 | 1.0 | 750 | $1,950 | $2.60 | 45d | 1 | 1.09mi |
| 77845 California Dr Unit D2 Palm Desert, CA | 1.0 | 1.0 | 750 | $1,800 | $2.40 | 7d | 1 | 1.09mi |
| 77835 California Dr Unit C1 Palm Desert, CA | 1.0 | 1.0 | 750 | $1,700 | $2.27 | 22d | 1 | 1.10mi |
| 77805 California Dr Palm Desert, CA | 1.0 | 1.0 | 750 | $1,500 | $2.00 | 26d | 1 | 1.12mi |
| 78601 Avenue 42 Unit B Bermuda Dunes, CA | 2.0 | 2.0 | 1100 | $2,195 | $2.00 | 22d | 1 | 1.14mi |
| 78601 Avenue 42 Unit A Bermuda Dunes, CA | 2.0 | 2.0 | 1100 | $2,195 | $2.00 | 16d | 1 | 1.14mi |
| 42205 Adams St Unit 4 Bermuda Dunes, CA | 1.0 | 1.0 | 1000 | $1,995 | $2.00 | 45d | 1 | 1.18mi |
| 78650 Ave 42 Bermuda Dunes, CA | 2.0 | 2.0 | 960 | $2,080 | $2.17 | 7d | 1 | 1.24mi |
| 78225 Cabrillo Ln #105 Indian Wells, CA | 1.0 | 2.0 | 864 | $3,500 | $4.05 | 45d | 1 | 1.27mi |
| 78255 Cabrillo Ln Indian Wells, CA | 1.0 | 2.0 | 864 | $2,800 | $3.24 | 4d | 1 | 1.27mi |
| 78650 Avenue 42 #616 Bermuda Dunes, CA | 2.0 | 2.0 | 960 | $2,500 | $2.60 | 45d | 1 | 1.29mi |
| 78155 Cabrillo Ln #37 Indian Wells, CA | 1.0 | 1.0 | 576 | $3,500 | $6.08 | 45d | 1 | 1.30mi |
| 78200 Cortez Ln #149 Indian Wells, CA | 1.0 | 1.0 | 576 | $2,200 | $3.82 | 45d | 1 | 1.30mi |
| 78650 Avenue 42 #505 Bermuda Dunes, CA | 1.0 | 1.0 | 760 | $1,900 | $2.50 | 26d | 1 | 1.30mi |
| 78130 Cortez Ln Indian Wells, CA | 1.0–2.0 | 1.0–2.0 | 874 | $2,600 | $2.97 | 45d | 2 | 1.32mi |
| 79090 Avenue 42 Bermuda Dunes, CA | 2.0 | 2.0 | 1022 | $2,211 | $2.16 | 1d | 1 | 1.34mi |
| 78650 Avenue 42 #901 Bermuda Dunes, CA | 2.0 | 2.0 | 960 | $2,350 | $2.45 | 7d | 1 | 1.36mi |
| 78981 Savanna La Mar Dr Unit D1 Bermuda Dunes, CA | 2.0 | 2.5 | 1100 | $2,295 | $2.09 | 20d | 1 | 1.40mi |
| 77380 Minnesota Ave Palm Desert, CA | 2.0 | 2.0 | 1064 | $2,750 | $2.58 | 45d | 1 | 1.47mi |
HOA detail condo
- Monthly dues
- $575 · $6,900/yr
- Likely covers
- pool
- Assessments
- None detected in remarks — confirm with the listing agent.
Listing history 44 events
-
2026-06-21days on market $284,000 Active 40 DOM
-
2026-06-18days on market $284,000 Active 37 DOM
-
2026-06-17days on market $284,000 Active 36 DOM
-
2026-06-16days on market $284,000 Active 35 DOM
-
2026-06-15days on market $284,000 Active 34 DOM
-
2026-06-13days on market $284,000 Active 32 DOM
-
2026-06-09days on market $284,000 Active 28 DOM
-
2026-06-08days on market $284,000 Active 27 DOM
-
2026-06-07days on market $284,000 Active 26 DOM
-
2026-06-04days on market $284,000 Active 23 DOM
-
2026-06-03days on market $284,000 Active 22 DOM
-
2026-06-02days on market $284,000 Active 21 DOM
-
2026-06-01days on market $284,000 Active 20 DOM
-
2026-05-31days on market $284,000 Active 19 DOM
-
2026-05-12$284,000 Active 1156-char remark
-
2026-05-02historical
-
2023-03-20historical
-
2023-01-11$288,000 Active
-
2023-01-09$318,000 Active
-
2018-02-21soldstatus $149,000 Sold
-
2018-02-21soldstatus $149,000
-
2018-02-15status Pending
-
2018-02-07historical Contingent
-
2018-02-02price $151,000
-
2018-01-04$153,000 Active
-
2017-12-31historical
-
2017-08-26price $154,000
-
2017-06-05$157,000 Active
-
2010-01-29soldstatus $163,000
-
2010-01-12historical
-
2009-06-17$179,900
-
2008-09-25historical
-
2008-08-05$225,000
-
2006-05-01soldstatus $240,000
-
2006-04-13historical
-
2006-04-07historical
-
2005-04-21
-
2005-04-13$249,900
-
2003-08-22historical
-
2003-08-12$145,000
-
2003-07-12historical
-
2003-04-11$145,999
-
1999-02-08historical
-
1998-10-16$89,900
ⓘ Source: listings_history table (triggers on properties + properties_extension) + one-shot
backfill from property_details.listing_events for pre-trigger history.
Tax reassessment forecast CA · Resets to sale price
- Current annual tax
- $2,538 · $211/mo
- Projected year-2 tax
- $2,538 · $211/mo
- Expected delta
- $0/yr ($0/mo · 0.0%)
ⓘ Screening estimate from a state-policy table — verify with the county assessor before closing.
Climate risk First Street
- Flood 1/10 Low FEMA zone X (unshaded) · 0% chance over 30 yrs
- Wildfire 5/10 Major
- Heat 9/10 Extreme 7 d/yr ≥114°F today · 18 d/yr by 30 yrs out
- Wind 1/10 Low
- Air quality 4/10 Moderate 4 unhealthy d/yr today · 5 by 30 yrs out
Nearby sold comps map
Loading sold comps map…
Walkable amenities ~0.75 mi
Loading nearby amenities…
Taxation est. · year 1
- Rental income
- $30,569
- − Mortgage interest
- −$15,908
- − Property taxes
- −$2,538
- − Insurance
- −$1,420
- − Repairs & maintenance
- −$2,446
- − Management
- −$2,446
- − HOA
- −$6,900
- − Depreciation
- −$8,262
- Taxable loss
- −$9,350
- Est. tax savings @ 24.0%
- +$2,244
- After-tax cash flow
- $-2,336/yr
For passive investors: Depreciation is non-cash, so a rental often shows a tax loss while cash-flowing — sheltering income. Rental losses are passive: they offset passive income freely, and up to $25,000/yr can offset ordinary (W-2) income if you actively participate and your MAGI is under $100k (phasing out to $0 by $150k); unused losses carry forward. On sale, claimed depreciation is recaptured at up to 25%, and gains may owe capital-gains tax (a 1031 exchange can defer both). Figures are a year-1 estimate at your 24.0% rate — not tax advice; consult a CPA.
Schools (NCES district)
- District
- Desert Sands Unified
- NCES district ID
- 0611110
- Math proficiency
- 31% ▼ -4.00%
- Reading proficiency
- 56% ▲ 7.00%
- Median HH income
- $54,957
- Composite
- 37.77/100
- National rank
- #4346
- State rank
- #199 of 517 in CA
Livability — La Quinta
- Score
- 58/100
- State rank
- #694
- US rank
- #21080
Category grades
Schools grade is shown separately in the Schools card above.
Census & demographics
- Census place
- La Quinta, CA
- County
- Riverside County · 2,287,001 people
- City population
- 38,666
- Metro
- Riverside-San Bernardino-Ontario, CA
- Population (ZIP)
- 38,666
- Household income
- $99,277
- Rent vs Own
- Severe rent burden
- 1078.0
Population outlook (Riverside County) Hauer SSP2
- Today (2025)
- 2,664,475 people
- By 2030
- 2,802,692 · +5.2%
- By 2040
- 3,050,904 · +14.5%
- By 2050
- 3,256,783 · +22.2%
- By 2075
- 3,655,058 · +37.2%
- By 2100
- 3,766,594 · +41.4%
Race, ethnicity, and origin ACS 2023
- Neighborhood character
- Diverse neighborhood (Simpson 0.57)
- Race & ethnicity
- White 54% Hispanic / Latino 37% Two or more races 19% Asian 4% Native American 1% Black 1%
- Hispanic origin (detail)
- Mexican 34%
- Common ancestry
- Romanian 2% Lithuanian 2% Slovak 1%
- Foreign-born
- 15% · Canada, China, Vietnam
- Languages at home
- 71% English-only · Spanish 24% Tagalog/Filipino 1% Chinese 1%
Political lean MEDSL · Riverside
- 2024 margin
- Toss-up / Even · D 48.0% · R 49.3% · Other 2.6%
- 2008→2024 swing
- -3.6pp toward R · 2008: 2.3pp · 2024: -1.3pp
- All cycles
- 2024: R+1.3 2020: D+8.0 2016: D+4.3 2012: R+0.4 2008: D+2.3
Not yet ingested
- Civics
- —
Market trends
- HPI YoY
- ▼ -263.65%
- Current HPI
- 281.8665
- Rent YoY
- ▲ 6.45%
- Metro
- Riverside-San Bernardino-Ontario, CA
- State GDP YoY
- ▲ 3.21%
- F500 in state
- 116
Industry mix (Fortune 500 HQ in CA)
| Industry | F500 HQs | Revenue |
|---|---|---|
| Technology | 27 | $1,492B |
|
||
| Financial Services | 3 | $174B |
|
||
| Retail | 3 | $44B |
|
||
| Insurance | 3 | $26B |
|
||
| Media / Entertainment | 2 | $115B |
|
||
| Pharmaceuticals / Biotech | 2 | $62B |
|
||
Price history
+215.9% since first listed30 events — show timeline
- 2026-05-12 Listed $284,000 GPSMLS
- 2026-05-02 Listing Removed — GPSMLS
- 2023-03-20 Listing Removed — GPSMLS
- 2023-01-11 Listed $288,000 GPSMLS
- 2023-01-09 Listed $318,000 GPSMLS
- 2018-02-21 Sold (Public Records) $149,000 Public Records
- 2018-02-21 Sold (MLS) $149,000 GPSMLS
- 2018-02-15 Pending — GPSMLS
- 2018-02-07 Contingent — GPSMLS
- 2018-02-02 Price Changed $151,000 GPSMLS
- 2018-01-04 Listed $153,000 GPSMLS
- 2017-12-31 Listing Removed — GPSMLS
- 2017-08-26 Price Changed $154,000 GPSMLS
- 2017-06-05 Listed $157,000 GPSMLS
- 2010-01-29 Sold (Public Records) $163,000 Public Records
- 2010-01-12 Listing Removed — GPSMLS
- 2009-06-17 Listed $179,900 GPSMLS
- 2008-09-25 Listing Removed — GPSMLS
- 2008-08-05 Listed $225,000 GPSMLS
- 2006-05-01 Sold (Public Records) $240,000 Public Records
- 2006-04-13 Listing Removed — CRMLS
- 2006-04-07 Delisted — PALM
- 2005-04-21 Listed — PALM
- 2005-04-13 Listed $249,900 CRMLS
- 2003-08-22 Listing Removed — GPSMLS
- 2003-08-12 Listed $145,000 GPSMLS
- 2003-07-12 Listing Removed — GPSMLS
- 2003-04-11 Listed $145,999 GPSMLS
- 1999-02-08 Listing Removed — GPSMLS
- 1998-10-16 Listed $89,900 GPSMLS
Property tax history
-1.0%/yrLatest (2025): $2,538 · +2.9% YoY. Source: county tax records.
Cash-flow waterfall
monthlySold comps — $/sqft
last 12 mo · ≤1 miLoading sold comps…