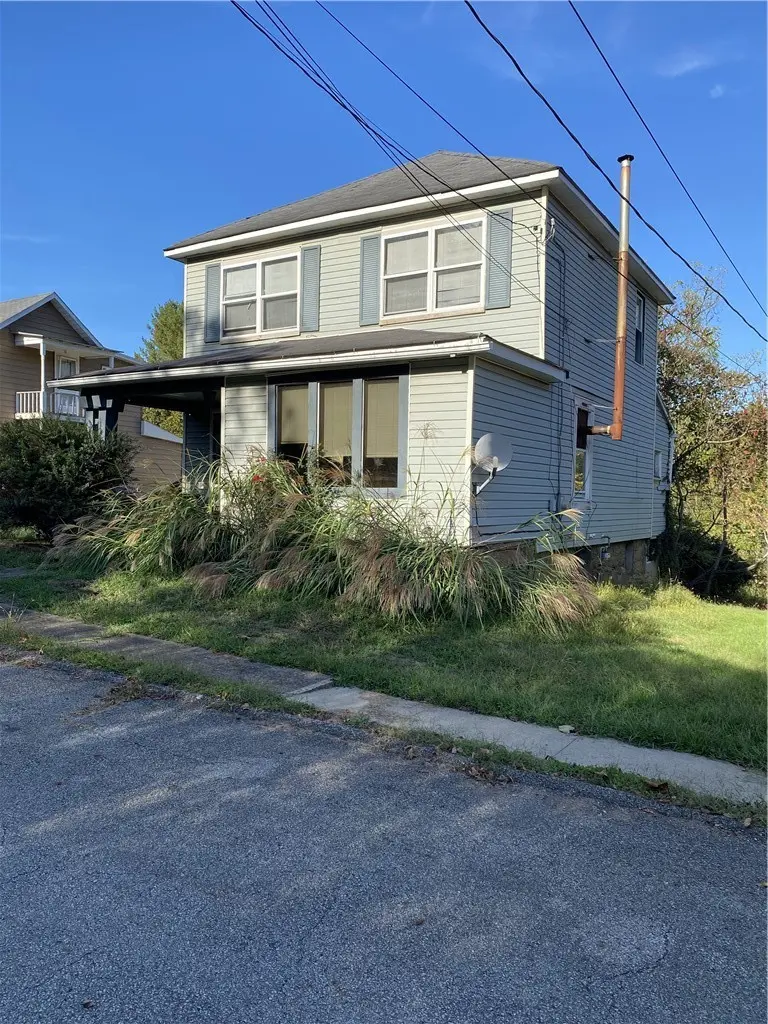
384 Market St · Clarksville, PA
Flood risk 4/10 · Minor
- FEMA flood zone
- X (unshaded)
- Chance of flooding over 30 yrs
- 0.24%
- Est. flood insurance / yr
- $473 – $860
Fire risk 1/10 · Minimal
- Est. fire insurance / yr
- $511 – $949
Heat risk 4/10 · Minor
- Hot days now (above 97°F)
- 7 days/yr
- Hot days in 30 yrs
- 19 days/yr
Wind risk 2/10 · Minimal
- Chance of severe wind over 30 yrs
- —
Air-quality risk 2/10 · Minimal
- Unhealthy air days now
- 1 days/yr
- Unhealthy air days in 30 yrs
- 2 days/yr
Risk factors via First Street. Map © Google.
Why this score? — see what drove the D+ grade
The composite is a weighted blend of 9 inputs, each scored 0–100. Each bar is that input's sub-score; the figure is the points it added to the 100-point composite (weight × sub-score).
- Cash flow +15.0/30.0
- ARV discount +7.5/15.0
- 1% rule +5.0/10.0
- DSCR +5.0/10.0
- Appreciation +4.9/10.0
- Livability +3.2/5.0
- Schools +3.1/10.0
- Rent growth +2.5/5.0
- Condition / age +2.2/5.0
$24,900
🖨 Deal sheet 📄 Offer letter ✓ Due diligence
Listing remarks MLS
Investor Alert! 3 bedroom, 2 bath single family with covered front porch, partially fenced in rear yard and eat-in kitchen. Being sold in as-is condition.
Key facts
- Covered front porch
- Eat-in kitchen
- 0.26 acre lot
Tags
Neighborhood map
What this means for you Summary
Snapshot
- This is a 3-bed/0.5-bath single-family listed at $25k. Condition is rated fair.
Deal economics
- At list price, monthly cash flow is $730 ($9k/yr) — positive.
- The deal already cash-flows at list — no discount required.
- Meets the 1% rule at list price ($1k rent vs $25k).
- Recommended offer: $23k (9.0% below list) — sets the bar for market timing.
Location & tenants
- Location reads 65/100 on livability (#1,163 in PA) — a middle-class / working-renter tenant base. Strengths: employment A+, cost of living A+, housing A+; Watch: crime C-, schools F, amenities F.
- Jefferson-Morgan SD (rural): math 25% / reading 47% proficiency, ranked #407 of 539 in PA (top 76%) — families likely to look elsewhere, expect single-tenant / working-renter base with shorter leases.
- Market conditions: 22 active listings in the ZIP; 30 units permitted in Greene County in 2024 (0 in 5+ unit buildings).
Forward outlook
- In year one you build about $126 of equity ($172 loan paydown + $-46 appreciation (-0.2% local appreciation)).
- Greene County population projected at -20% by 2050 — secular population decline; favor cash flow + early exit over multi-decade hold.
- At projected returns (-0.2% appreciation + 3.0% rent growth), your $7k cash investment doubles in ~1 year — after that, you're playing with house money.
Negotiation context
- It's been on market 115 days — a 9% lower offer ($23k) is reasonable based on typical stale-listing flexibility.
Risks & watch-outs
- Watch-outs: built in 1900 — expect roof / HVAC / electrical / plumbing capex.
Questions for the listing agent
- It's been on market 115 days. Have you received any prior offers? Is the seller open to a 9% concession, seller financing, or rate buy-down credit?
- Have any recent inspections been done? Can we get a copy of the seller's disclosures and any deferred-maintenance estimates?
- Built in 1900 — when were the roof, HVAC, electrical panel, plumbing, and water heater last replaced?
- Why hasn't it sold? Are there any deal-killer items the seller is aware of (foundation, flood, title, zoning, code violations)?
- Is there a deadline driving the sale (1031 exchange, divorce, estate, relocation)? That informs how much negotiation room exists.
- Schools are F-rated, which usually means shorter tenancies and higher turnover. Who's the typical renter profile here, and what's been the actual vacancy rate?
- The area grade is low — what's the realistic commute time and amenity access for the typical tenant pool here? Any planned neighborhood developments (good or bad) we should know about?
- What's the average days-on-market for RENTAL listings here right now (not sales)? A rising rental-DOM trend means longer vacancies and softer asking-rent achievability than the comps imply.
- What's the recent tenant-quality profile in this submarket — average credit score on applications, eviction rate, late-payment / NSF rate, and stable-employment percentage? A property-management company in the area should have these aggregated.
- How much new for-sale + rental construction is in the pipeline within 1–3 miles? Heavy new supply typically softens prices + rents 12–24 months out; constrained supply supports both.
Investment metrics
- 1% rule
- 4.59% ✓
- Cap rate
- 41.49%
- Cash-on-cash
- 125.70%
- DSCR
- 6.59
- GRM
- 1.8
CMA / ARV
- ARV (median comp)
- $92,836
- List price
- $24,900
- Delta
- -73.18%
- Verdict
- UNDERPRICED
- Comps
- 20 within 1.0 mi
Show comp detail 10 sales within ~0.75 mi
| Address | Dist | Beds/Ba | Sqft | Sold | Price | $/sf | Match |
|---|---|---|---|---|---|---|---|
| 113 East St | 0.20mi | 3/1.0 | 1,250 (-5%) | 7mo | $70,000 | $56 | 75 |
| 26 Berry Ave | 0.26mi | 2/1.0 (-1) | 1,260 (-4%) | 6mo | $133,900 | $106 | 69 |
| 2432 Sandy Plains Rd | 0.24mi | 3/1.0 | 1,274 (-3%) | 21mo | $43,507 | $34 | 65 |
| 5 Teegarden Homes | 0.28mi | 3/1.0 | 1,250 (-5%) | 23mo | $17,500 | $14 | 58 |
| 47 Clark St | 0.38mi | 3/2.0 | 1,244 (-5%) | 16mo | $18,500 | $15 | 54 |
| 77 Walnut St | 0.34mi | 3/3.0 | 1,152 (-12%) | 2mo | $200,000 | $174 | 52 |
| 27 Berry Ave | 0.26mi | 3/1.0 | 1,440 (+10%) | 21mo | $84,000 | $58 | 52 |
| 19 Berry Ave | 0.27mi | 4/1.0 (+1) | 1,440 (+10%) | 21mo | $95,000 | $66 | 47 |
| 18 Locust St | 0.52mi | 3/2.0 | 1,133 (-14%) | 5mo | $94,500 | $83 | 43 |
| 43 Clark St | 0.36mi | 3/2.0 | 1,116 (-15%) | 15mo | $124,500 | $112 | 40 |
Match score weights: distance 35% · size 25% · config 20% · recency 20%. Top-matched comps best support the ARV.
Projected returns pro-forma
-0.19% appreciation · 3.0% rent growth · sell at horizon
- IRR
- —
- Equity multiple
- 7.54×
- Total profit
- $45,587
- Equity at exit
- $7,000
- IRR
- —
- Equity multiple
- 15.73×
- Total profit
- $102,686
- Equity at exit
- $8,232
Cash invested: $6,972 (down + closing). Projections, not guarantees.
Landlord ↔ Tenant lean methodology
- Overall (STATE)
- 62 Landlord-Friendly
- State Pennsylvania
- 62 Landlord-Friendly · EVEN
- County
- — inherits STATE
- City
- — inherits STATE
ZIP-level market 15322
- Home prices YoY
- -0.2%
- Active inventory
- 22
- Price-to-rent
- 1.8×
Monthly cashflow live
- Estimated rent
- $1,142 medium interval (Pro) →
- Mortgage (P&I)
- −$131
- Tax est. 1.5%
- −$31 /mo · $374/yr
- Insurance
- −$10
- HOA
- −$0
- Vacancy / Maint / Mgmt
- −$240
- Net cashflow
- $730
Break-even live
UW: 25.0% down · 7.5% · 30yr · 1.5% tax · 5.0% vac · 8.0% maint · 8.0% mgmt
Financing live
Cash to close
- Down payment
- $6,225
- Closing costs
- $747
- Reserves months
- —
- Total cash needed
- —
Loan-product check · same deal, 3 products live
Conventional
25% down · 7.5% · 30yr
- Down + closing
- —
- Monthly P&I
- —
- Monthly cashflow
- —
- DSCR
- —
- Eligible?
- —
Personal DTI + credit; lowest rate.
DSCR
20% down · 8.5% · 30yr
- Down + closing
- —
- Monthly P&I
- —
- Monthly cashflow
- —
- DSCR
- —
- Eligible?
- —
No personal income docs; deal must DSCR.
Hard money
10% down · 12.0% · 12mo
- Down + closing
- —
- Monthly P&I
- —
- Monthly cashflow
- —
- DSCR
- —
- Eligible?
- —
Short-term bridge; refi at stabilization.
Listing history 18 events
-
2026-06-18days on market $24,900 Active 115 DOM
-
2026-06-17days on market $24,900 Active 114 DOM
-
2026-06-16days on market $24,900 Active 113 DOM
-
2026-06-15days on market $24,900 Active 112 DOM
-
2026-06-13days on market $24,900 Active 110 DOM
-
2026-06-12days on market $24,900 Active 109 DOM
-
2026-06-09days on market $24,900 Active 106 DOM
-
2026-06-08days on market $24,900 Active 105 DOM
-
2026-06-08days on market $24,900 Active 104 DOM
-
2026-06-07days on market $24,900 Active 103 DOM
-
2026-06-04days on market $24,900 Active 100 DOM
-
2026-06-02days on market $24,900 Active 99 DOM
-
2026-06-01price $24,900 Active 98 DOM
-
2026-06-01days on market $26,900 Active 98 DOM
-
2026-05-31days on market $26,900 Active 97 DOM
-
2026-05-08price $26,900 155-char remark
Show marketing remark (155 chars)
Investor Alert! 3 bedroom, 2 bath single family with covered front porch, partially fenced in rear yard and eat-in kitchen. Being sold in as-is condition.
-
2026-04-06price $27,900 155-char remark
Show marketing remark (155 chars)
Investor Alert! 3 bedroom, 2 bath single family with covered front porch, partially fenced in rear yard and eat-in kitchen. Being sold in as-is condition.
-
2026-02-23$29,900 Active 155-char remark
Show marketing remark (155 chars)
Investor Alert! 3 bedroom, 2 bath single family with covered front porch, partially fenced in rear yard and eat-in kitchen. Being sold in as-is condition.
ⓘ Source: listings_history table (triggers on properties + properties_extension) + one-shot
backfill from property_details.listing_events for pre-trigger history.
Climate risk First Street
- Flood 4/10 Moderate FEMA zone X (unshaded) · 24% chance over 30 yrs
- Wildfire 1/10 Low
- Heat 4/10 Moderate 7 d/yr ≥97°F today · 19 d/yr by 30 yrs out
- Wind 2/10 Low
- Air quality 2/10 Low 1 unhealthy d/yr today · 2 by 30 yrs out
Nearby sold comps map
Loading sold comps map…
Walkable amenities ~0.75 mi
Loading nearby amenities…
Taxation est. · year 1
- Rental income
- $13,707
- − Mortgage interest
- −$1,395
- − Property taxes
- −$374
- − Insurance
- −$124
- − Repairs & maintenance
- −$1,097
- − Management
- −$1,097
- − Depreciation
- −$724
- Taxable income
- $8,897
- Est. tax owed @ 24.0%
- −$2,135
- After-tax cash flow
- $6,629/yr
For passive investors: Depreciation is non-cash, so a rental often shows a tax loss while cash-flowing — sheltering income. Rental losses are passive: they offset passive income freely, and up to $25,000/yr can offset ordinary (W-2) income if you actively participate and your MAGI is under $100k (phasing out to $0 by $150k); unused losses carry forward. On sale, claimed depreciation is recaptured at up to 25%, and gains may owe capital-gains tax (a 1031 exchange can defer both). Figures are a year-1 estimate at your 24.0% rate — not tax advice; consult a CPA.
Condition & rehab AI · 13 photos
This property requires significant repairs and maintenance, including structural repairs, painting, and landscaping. While it has potential, it needs a moderate renovation to become move-in ready.
Repairs flagged
- Major Exposed ceiling — Structural damage
- Major Worn fixtures — Aesthetic and functional issues
- Major Overgrown vegetation — Safety hazard
- Major Worn siding — Structural integrity
Value-add opportunities
- Both Paint — Enhances curb appeal and interior aesthetics
- Both Flooring — Improves living space and reduces maintenance
- Both Landscaping — Enhances curb appeal and property value
Renovation cost estimate screening
| Repair item | Severity | Est. cost |
|---|---|---|
| Exposed ceiling · Structural damage | Major | $15,000–50,000 |
| Worn fixtures · Aesthetic and functional issues | Major | $15,000–50,000 |
| Overgrown vegetation · Safety hazard | Major | $15,000–50,000 |
| Worn siding · Structural integrity | Major | $15,000–50,000 |
| Total estimated repair cost · 4 items | $60,000–200,000 |
Value-add ROI direction
- Both Paint — Enhances curb appeal and interior aesthetics ↑
- Both Flooring — Improves living space and reduces maintenance ↑
- Both Landscaping — Enhances curb appeal and property value ↑
ⓘ Cost ranges are severity-bucket heuristics (US national rule-of-thumb). Get contractor quotes + a written scope before underwriting a rehab budget.
Schools (NCES district)
- District
- Jefferson-Morgan SD
- NCES district ID
- 4212390
- Math proficiency
- 25% ▼ -17.00%
- Reading proficiency
- 47% ▼ -10.00%
- Median HH income
- $46,767
- Composite
- 30.78/100
- National rank
- #6153
- State rank
- #407 of 539 in PA
Livability — Clarksville
- Score
- 65/100
- State rank
- #1163
- US rank
- #13443
Category grades
Schools grade is shown separately in the Schools card above.
Census & demographics
- Census place
- Clarksville, PA
- Population (ZIP)
- 1,656
Population outlook (Greene County) Hauer SSP2
- Today (2025)
- 34,975 people
- By 2030
- 33,554 · -4.1%
- By 2040
- 30,615 · -12.5%
- By 2050
- 27,819 · -20.5%
- By 2075
- 21,678 · -38.0%
- By 2100
- 16,318 · -53.3%
Race, ethnicity, and origin ACS 2023
- Neighborhood character
- Predominantly White (95%)
- Race & ethnicity
- White 95% Two or more races 3% Hispanic / Latino 2% Black 1%
- Common ancestry
- Romanian 10% Italian 3% Scotch-Irish 2%
Political lean MEDSL · Greene
- 2024 margin
- Solid R (+44.8) · D 26.6% · R 71.5% · Other 1.9%
- 2008→2024 swing
- -44.4pp toward R · 2008: -0.4pp · 2024: -44.8pp
- All cycles
- 2024: R+44.8 2020: R+43.4 2016: R+41.7 2012: R+17.6 2008: R+0.4
Not yet ingested
- Civics
- —
Market trends
- HPI YoY
- ▼ -0.19%
- Current HPI
- 107.8618
- Rent YoY
- —
- Metro
- —
- State GDP YoY
- ▲ 1.68%
- F500 in state
- 34
Industry mix (Fortune 500 HQ in PA)
| Industry | F500 HQs | Revenue |
|---|---|---|
| Healthcare | 2 | $309B |
|
||
| Insurance | 2 | $27B |
|
||
| Telecommunications / Media | 1 | $124B |
|
||
| Industrial Distribution | 1 | $22B |
|
||
| Financial Services | 1 | $20B |
|
||
| Chemicals / Materials | 1 | $18B |
|
||
Price history
-10.0% since first listed3 events — show timeline
- 2026-05-08 Price Changed $26,900 West Penn MLS
- 2026-04-06 Price Changed $27,900 West Penn MLS
- 2026-02-23 Listed $29,900 West Penn MLS
Cash-flow waterfall
monthlySold comps — $/sqft
last 12 mo · ≤1 miLoading sold comps…