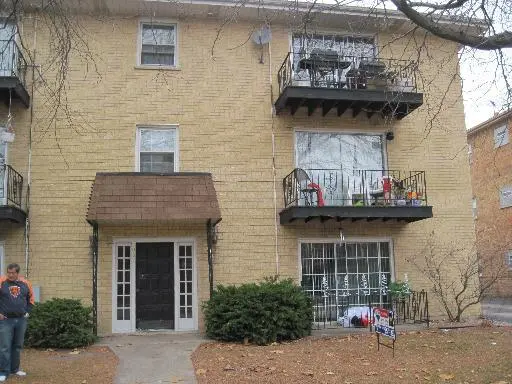
7032 O Connell Dr Unit 1E · Chicago Ridge, IL
Flood risk 1/10 · Minimal
- FEMA flood zone
- X (unshaded)
- Chance of flooding over 30 yrs
- 0.0%
- Est. flood insurance / yr
- $507 – $1,088
Fire risk 1/10 · Minimal
- Est. fire insurance / yr
- $804 – $1,492
Heat risk 3/10 · Minor
- Hot days now (above 101°F)
- 7 days/yr
- Hot days in 30 yrs
- 15 days/yr
Wind risk 2/10 · Minimal
- Chance of severe wind over 30 yrs
- —
Air-quality risk 3/10 · Minor
- Unhealthy air days now
- 4 days/yr
- Unhealthy air days in 30 yrs
- 4 days/yr
Risk factors via First Street. Map © Google.
Why this score? — see what drove the D+ grade
The composite is a weighted blend of 9 inputs, each scored 0–100. Each bar is that input's sub-score; the figure is the points it added to the 100-point composite (weight × sub-score).
- Cash flow +18.0/30.0
- 1% rule +8.4/10.0
- ARV discount +7.5/15.0
- DSCR +5.6/10.0
- Livability +3.9/5.0
- Rent growth +2.5/5.0
- Condition / age +2.5/5.0
- Schools +1.6/10.0
- Appreciation +0.0/10.0
$120,000
🖨 Deal sheet 📄 Offer letter ✓ Due diligence
Listing remarks MLS
Don't wait this Short Sale is already Approved at Asking price.Take a look on this Well maintained, clean, 1st floor condo. Two bedrooms, livingroom, eating area and kitchen. Radiant heat. Roof in 2005. Abundant cabinets and closets. Easy access to shopping, park district, metra and 294. Subject to bank approval, pls allow time for response. taxes prorated at 100%.
Key facts
- Rental allowed
- First floor
- $250 HOA
Tags
Property features AI
Finance
- Other: Parcel number available
- Financial info: Special service area: No
- HOA & community: Monthly association fee of $250; Association covers water, gas, parking, exterior maintenance, lawn care, scavenger, and snow removal; Self-management; Pets allowed (cats and dogs), maximum pet weight 40 lbs
Exterior
- Parking: One parking space (unassigned); Other parking features noted
- Utilities: Water source: Lake Michigan; Public sewer; Electric: Circuit breakers
- Home design: Attached single (condo), end unit; Entry level: 1; Built approximately 51–60 years ago; Asphalt roof; Brick construction; Unit is part of a 6-unit building; Built before 1978
- Construction: Brick exterior; Asphalt roof; Part of a 6-unit building
- Exterior features: Patio
Interior
- Kitchen: Range; Dishwasher; Kitchen on main level (9 x 9) with vinyl flooring
- Bedrooms: Two bedrooms; Master bedroom on main level (14 x 11) with wood laminate flooring; Second bedroom on main level (12 x 11) with wood laminate flooring
- Flooring: Wood laminate in living areas and bedrooms; Vinyl flooring in kitchen
- Bathrooms: One full bathroom
- Heating & cooling: Natural gas radiant heat; Wall cooling unit(s)
- Interior features: Five total rooms; Ceiling fan(s)
- Laundry & utility: Laundry room; Washer/dryer hookups available (laundry room listed)
Neighborhood map
What this means for you Summary
Snapshot
- This is a 2-bed/1.0-bath condo listed at $120k.
Deal economics
- At list price, monthly cash flow is $103 ($1k/yr) — positive.
- The deal already cash-flows at list — no discount required.
- Meets the 1% rule at list price ($2k rent vs $120k).
- Cap rate 7.3% vs local median 4.4% in Chicago Ridge — top-decile yield for the area; either an underpriced asset or a hidden risk that comps aren't pricing in. Stress-test before assuming the spread holds.
Location & tenants
- Location reads 77/100 on livability (#169 in IL, #3,110 nationally) — a middle-class / working-renter tenant base. Strengths: commute A+, cost of living A+, housing A+; Watch: employment C-, health & safety C-, amenities D+.
- Chsd 218 (suburban): math 14% / reading 20% proficiency, ranked #454 of 620 in IL (top 73%) — low school quality limits family demand, transient renter base, plan for 1-2y turnover.
- Market conditions: 30 active listings in the ZIP; 19 comparable units currently listed for rent nearby; rentals at typical pace (median 14d on market — plan ~3-4 weeks tenant-placement turnaround); 6,272 units permitted in Cook County in 2024 (4,658 in 5+ unit buildings).
Forward outlook
- Local home prices are declining (-3.0%/yr); year-one equity from $830 of loan paydown is wiped out by about $4k of value loss. Plan a longer hold.
Negotiation context
- Only 7 days on market — expect competitive offers; lowballing is unlikely to land.
- 5 sale attempts since 19y ago with the ask held roughly flat each time — persistent listings suggest the price (not the market) is what's stuck; bring a comps-based counter.
- Current owner paid $45k; list at $120k implies a 167% gain — meaningful room to come down on a strong offer.
Questions for the listing agent
- What does the HOA fee cover, when was the last increase, and are there any pending special assessments or reserve-fund shortfalls?
- Any open or pending special assessments — roof, HVAC, plumbing, elevator, façade? What's the per-unit balance and payoff schedule, and is the seller paying it off at close or rolling it to the buyer?
- Is there a deadline driving the sale (1031 exchange, divorce, estate, relocation)? That informs how much negotiation room exists.
- Schools are F-rated, which usually means shorter tenancies and higher turnover. Who's the typical renter profile here, and what's been the actual vacancy rate?
- The area grade is low — what's the realistic commute time and amenity access for the typical tenant pool here? Any planned neighborhood developments (good or bad) we should know about?
- What's the average days-on-market for RENTAL listings here right now (not sales)? A rising rental-DOM trend means longer vacancies and softer asking-rent achievability than the comps imply.
- What's the recent tenant-quality profile in this submarket — average credit score on applications, eviction rate, late-payment / NSF rate, and stable-employment percentage? A property-management company in the area should have these aggregated.
- How much new apartment / multifamily construction is in the pipeline within 1–3 miles? Heavy new supply (>2% of stock underway) typically softens rents 12–24 months out; light construction supports rent growth.
Investment metrics
- 1% rule
- 1.34% ✓
- Cap rate
- 7.33%
- Cash-on-cash
- 3.69%
- DSCR
- 1.16
- GRM
- 6.2
CMA / ARV
No comps found within radius.
Projected returns pro-forma
-3.0% appreciation · 3.0% rent growth · sell at horizon
- IRR
- -10.3%
- Equity multiple
- 0.62×
- Total profit
- $-12,641
- Equity at exit
- $17,892
- IRR
- -0.7%
- Equity multiple
- 0.95×
- Total profit
- $-1,611
- Equity at exit
- $10,375
Cash invested: $33,600 (down + closing). Projections, not guarantees.
Landlord ↔ Tenant lean methodology
- Overall (STATE)
- 43 Moderately Tenant-Leaning
- State Illinois
- 43 Moderately Tenant-Leaning · D+7
- County
- — inherits STATE
- City
- — inherits STATE
ZIP-level market 60415
- Active inventory
- 30
- Price-to-rent
- 6.2×
Monthly cashflow live
- Estimated rent
- $1,603 high interval (Pro) →
- Mortgage (P&I)
- −$629
- Tax from tax record
- −$234 /mo · $2,804/yr
- Insurance
- −$50
- HOA
- −$250
- Vacancy / Maint / Mgmt
- −$337
- Net cashflow
- $103
Break-even live
UW: 25.0% down · 7.5% · 30yr · 1.5% tax · 5.0% vac · 8.0% maint · 8.0% mgmt
Financing live
Cash to close
- Down payment
- $30,000
- Closing costs
- $3,600
- Reserves months
- —
- Total cash needed
- —
Loan-product check · same deal, 3 products live
Conventional
25% down · 7.5% · 30yr
- Down + closing
- —
- Monthly P&I
- —
- Monthly cashflow
- —
- DSCR
- —
- Eligible?
- —
Personal DTI + credit; lowest rate.
DSCR
20% down · 8.5% · 30yr
- Down + closing
- —
- Monthly P&I
- —
- Monthly cashflow
- —
- DSCR
- —
- Eligible?
- —
No personal income docs; deal must DSCR.
Hard money
10% down · 12.0% · 12mo
- Down + closing
- —
- Monthly P&I
- —
- Monthly cashflow
- —
- DSCR
- —
- Eligible?
- —
Short-term bridge; refi at stabilization.
Rent comps 19 comps
| Address | Beds | Baths | Sqft | Rent | $/sqft | DOM | Units | Dist |
|---|---|---|---|---|---|---|---|---|
| 9950 Sayre Ave Unit 108 Chicago Ridge, IL | 2.0 | 1.0 | 900 | $1,400 | $1.56 | 20d | 1 | 0.05mi |
| 9841 S Harlem Ave Unit 1D Chicago Ridge, IL | 1.0 | 1.0 | 890 | $1,299 | $1.46 | 15d | 1 | 0.18mi |
| 10200 Mulberry Ln Bridgeview, IL | 2.0 | 2.0 | 1350 | $3,000 | $2.22 | 2d | 1 | 0.55mi |
| 9308 Nordica Ave Oak Lawn, IL | 3.0 | 2.0 | 1349 | $960 | $0.71 | 12d | 1 | 0.79mi |
| 10210 Ridgeland Ave Chicago Ridge, IL | 1.0 | 1.0 | 700 | $1,500 | $2.14 | 16d | 1 | 0.85mi |
| 10210 Ridgeland Ave Chicago Ridge, IL | 1.0 | 1.0 | 700 | $1,425 | $2.04 | 1d | 2 | 0.85mi |
| 9806 Marion Ave Oak Lawn, IL | 3.0 | 1.0 | 897 | $1,950 | $2.17 | 24d | 1 | 0.86mi |
| 10440 Natoma Ave #5 Chicago Ridge, IL | 2.0 | 1.0 | 850 | $1,700 | $2.00 | 1d | 1 | 0.87mi |
| 10604 S Oak Tree Dr Worth, IL | 2.0 | 1.0 | 800 | $1,450 | $1.81 | 24d | 1 | 0.94mi |
| 7834 95th St Unit 1C Hickory Hills, IL | 1.0 | 1.0 | 750 | $1,600 | $2.13 | 24d | 1 | 1.15mi |
| 6139 Marshall Ave Apt 1E Chicago Ridge, IL | 2.0 | 2.0 | 950 | $1,850 | $1.95 | 2d | 1 | 1.20mi |
| 9154 Ridgeland Ave Oak Lawn, IL | 3.0 | 1.0 | 816 | $2,300 | $2.82 | 14d | 1 | 1.24mi |
| 7121 W 110th St Unit 2W Worth, IL | 2.0 | 1.0 | 900 | $1,550 | $1.72 | 15d | 1 | 1.34mi |
| 6101 W 94th St Unit A2 Oak Lawn, IL | 2.0 | 2.0 | 1100 | $1,900 | $1.73 | 5d | 1 | 1.34mi |
| 6135 Birmingham St Chicago Ridge, IL | 3.0 | 2.0 | 1100 | $2,800 | $2.55 | 1d | 1 | 1.34mi |
| 10410 Moody Ave Unit 1S Chicago Ridge, IL | 2.0 | 1.0 | 900 | $1,600 | $1.78 | 12d | 1 | 1.36mi |
| 11011 S Lloyd Dr Worth, IL | 2.0 | 1.0 | 800 | $1,600 | $2.00 | 16d | 1 | 1.43mi |
| 6005 Marshall Ave #8 Chicago Ridge, IL | 2.0 | 1.0 | 1000 | $1,700 | $1.70 | 4d | 1 | 1.44mi |
| 10326 Mayfield Ave Oak Lawn, IL | 2.0 | 1.0 | 850 | $1,650 | $1.94 | 17d | 1 | 1.50mi |
HOA detail condo
- Monthly dues
- $250 · $3,000/yr
- Assessments
- None detected in remarks — confirm with the listing agent.
Listing history 7 events
-
2026-06-09status $120,000 Pending 7 DOM
-
2026-06-08days on market $120,000 Active 7 DOM
-
2026-06-07days on market $120,000 Active 6 DOM
-
2026-06-04days on market $120,000 Active 3 DOM
-
2026-06-03days on market $120,000 Active 2 DOM
-
2026-06-02remarks 231-char remark
-
2026-06-02$120,000 Active 1 DOM
ⓘ Source: listings_history table (triggers on properties + properties_extension) + one-shot
backfill from property_details.listing_events for pre-trigger history.
Tax reassessment forecast IL · Partial reset (capped growth)
- Current annual tax
- $2,804 · $234/mo
- Projected year-2 tax
- $2,804 · $234/mo
- Expected delta
- $0/yr ($0/mo · 0.0%)
ⓘ Screening estimate from a state-policy table — verify with the county assessor before closing.
Climate risk First Street
- Flood 1/10 Low FEMA zone X (unshaded) · 0% chance over 30 yrs
- Wildfire 1/10 Low
- Heat 3/10 Moderate 7 d/yr ≥101°F today · 15 d/yr by 30 yrs out
- Wind 2/10 Low
- Air quality 3/10 Moderate 4 unhealthy d/yr today · 4 by 30 yrs out
Nearby sold comps map
Loading sold comps map…
Walkable amenities ~0.75 mi
Loading nearby amenities…
Taxation est. · year 1
- Rental income
- $19,234
- − Mortgage interest
- −$6,722
- − Property taxes
- −$2,804
- − Insurance
- −$600
- − Repairs & maintenance
- −$1,539
- − Management
- −$1,539
- − HOA
- −$3,000
- − Depreciation
- −$3,491
- Taxable loss
- −$461
- Est. tax savings @ 24.0%
- +$111
- After-tax cash flow
- $1,349/yr
For passive investors: Depreciation is non-cash, so a rental often shows a tax loss while cash-flowing — sheltering income. Rental losses are passive: they offset passive income freely, and up to $25,000/yr can offset ordinary (W-2) income if you actively participate and your MAGI is under $100k (phasing out to $0 by $150k); unused losses carry forward. On sale, claimed depreciation is recaptured at up to 25%, and gains may owe capital-gains tax (a 1031 exchange can defer both). Figures are a year-1 estimate at your 24.0% rate — not tax advice; consult a CPA.
Schools (NCES district)
- District
- Chsd 218
- NCES district ID
- 1706540
- Math proficiency
- 14% ▼ -4.00%
- Reading proficiency
- 20% ▼ -1.00%
- Median HH income
- $57,166
- Composite
- 16.09/100
- National rank
- #9235
- State rank
- #454 of 620 in IL
Livability — Chicago Ridge
- Score
- 77/100
- State rank
- #169
- US rank
- #3110
Category grades
Schools grade is shown separately in the Schools card above.
Census & demographics
- Census place
- Chicago Ridge, IL
- County
- Cook County · 4,486,803 people
- City population
- 14,099
- Metro
- Chicago-Naperville-Elgin, IL-IN-WI
- Population (ZIP)
- 14,099
- Household income
- $68,964
- Rent vs Own
- Severe rent burden
- 414.0
Population outlook (Cook County) Hauer SSP2
- Today (2025)
- 5,347,519 people
- By 2030
- 5,357,703 · +0.2%
- By 2040
- 5,324,924 · -0.4%
- By 2050
- 5,230,762 · -2.2%
- By 2075
- 4,785,735 · -10.5%
- By 2100
- 4,188,836 · -21.7%
Race, ethnicity, and origin ACS 2023
- Neighborhood character
- Diverse neighborhood (Simpson 0.61)
- Race & ethnicity
- White 59% Two or more races 18% Hispanic / Latino 17% Black 9% Asian 4%
- Hispanic origin (detail)
- Mexican 15%
- Common ancestry
- Romanian 13% Armenian 3% Italian 1%
- Foreign-born
- 26% · Canada, China
- Languages at home
- 60% English-only · Arabic 19% Spanish 8% Tagalog/Filipino 4%
Political lean MEDSL · Cook
- 2024 margin
- Solid D (+42.0) · D 70.4% · R 28.4% · Other 1.2%
- 2008→2024 swing
- -11.4pp toward R · 2008: 53.4pp · 2024: 42.0pp
- All cycles
- 2024: D+42.0 2020: D+50.3 2016: D+53.0 2012: D+49.4 2008: D+53.4
Not yet ingested
- Civics
- —
Market trends
- HPI YoY
- ▼ -120.93%
- Current HPI
- 202.2673
- Rent YoY
- —
- Metro
- Chicago-Naperville-Elgin, IL-IN-WI
- State GDP YoY
- ▲ 1.59%
- F500 in state
- 60
Industry mix (Fortune 500 HQ in IL)
| Industry | F500 HQs | Revenue |
|---|---|---|
| Insurance | 4 | $201B |
|
||
| Consumer Goods | 4 | $87B |
|
||
| Industrial Machinery | 3 | $64B |
|
||
| Healthcare | 2 | $55B |
|
||
| Retail / Pharmacy | 1 | $148B |
|
||
| Agriculture / Food | 1 | $86B |
|
||
Price history
+224.3% since first listed26 events — show timeline
- 2026-06-01 Listed $120,000 MRED as Distributed by MLS Grid
- 2012-07-11 Sold (MLS) $45,000 MRED as Distributed by MLS Grid
- 2012-05-02 Contingent — MRED as Distributed by MLS Grid
- 2012-04-11 Relisted — MRED as Distributed by MLS Grid
- 2012-04-11 Price Changed $45,000 MRED as Distributed by MLS Grid
- 2011-10-27 Price Changed $29,900 MRED as Distributed by MLS Grid
- 2011-09-16 Contingent — MRED as Distributed by MLS Grid
- 2011-09-06 Price Changed $34,900 MRED as Distributed by MLS Grid
- 2011-08-25 Price Changed $39,900 MRED as Distributed by MLS Grid
- 2011-08-18 Price Changed $41,900 MRED as Distributed by MLS Grid
- 2011-07-09 Price Changed $43,900 MRED as Distributed by MLS Grid
- 2011-06-18 Relisted — MRED as Distributed by MLS Grid
- 2011-02-01 Contingent — MRED as Distributed by MLS Grid
- 2011-01-31 Price Changed $45,900 MRED as Distributed by MLS Grid
- 2011-01-18 Price Changed $49,900 MRED as Distributed by MLS Grid
- 2011-01-04 Price Changed $54,900 MRED as Distributed by MLS Grid
- 2010-12-21 Price Changed $61,900 MRED as Distributed by MLS Grid
- 2010-12-14 Price Changed $66,900 MRED as Distributed by MLS Grid
- 2010-12-07 Price Changed $69,900 MRED as Distributed by MLS Grid
- 2010-11-30 Price Changed $74,900 MRED as Distributed by MLS Grid
- 2010-11-23 Listed $79,900 MRED as Distributed by MLS Grid
- 2007-09-19 Listing Removed — MRED as Distributed by MLS Grid
- 2007-06-19 Listed — MRED as Distributed by MLS Grid
- 2006-08-04 Sold (Public Records) $130,000 Public Records
- 1984-10-09 Sold (Public Records) $37,000 Public Records
- 1984-10-09 Sold (Public Records) $37,000 Public Records
Property tax history
+2.4%/yrLatest (2023): $2,804 · +4.2% YoY. Source: county tax records.
Cash-flow waterfall
monthlySold comps — $/sqft
last 12 mo · ≤1 miLoading sold comps…