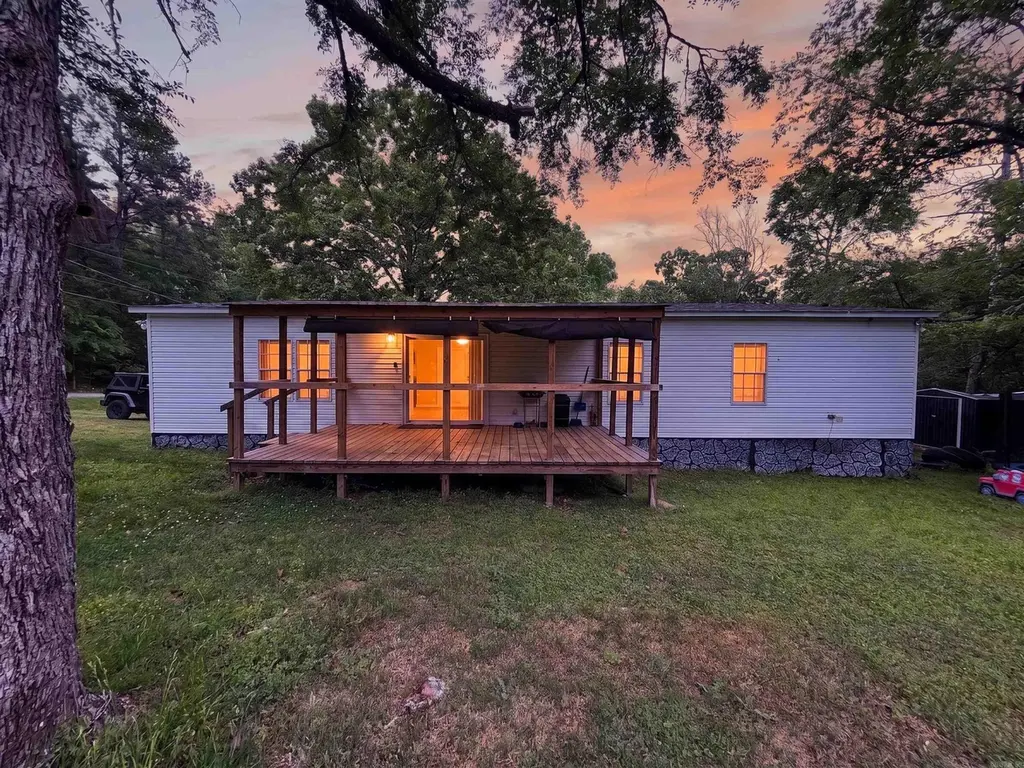
362 Geronimo St · Rockwell, AR
Flood risk 6/10 · Moderate
- FEMA flood zone
- X (unshaded)
- Chance of flooding over 30 yrs
- 0.68%
- Est. flood insurance / yr
- $507 – $1,088
Fire risk 3/10 · Minor
- Est. fire insurance / yr
- $1,499 – $2,785
Heat risk 6/10 · Moderate
- Hot days now (above 110°F)
- 7 days/yr
- Hot days in 30 yrs
- 20 days/yr
Wind risk 4/10 · Minor
- Chance of severe wind over 30 yrs
- 10.0%
Air-quality risk 1/10 · Minimal
- Unhealthy air days now
- 0 days/yr
- Unhealthy air days in 30 yrs
- 0 days/yr
Risk factors via First Street. Map © Google.
Why this score? — see what drove the D- grade
The composite is a weighted blend of 9 inputs, each scored 0–100. Each bar is that input's sub-score; the figure is the points it added to the 100-point composite (weight × sub-score).
- Cash flow +13.1/30.0
- Rent growth +4.1/5.0
- Condition / age +4.0/5.0
- DSCR +3.9/10.0
- 1% rule +3.7/10.0
- Schools +3.6/10.0
- Livability +3.4/5.0
- ARV discount +0.9/15.0
- Appreciation +0.0/10.0
$160,000
🖨 Deal sheet (PDF) 📄 Offer letter ✓ Due diligence
Listing remarks MLS
Recently renovated home in the heart of Hot Springs featuring major updates, including a new roof for added peace of mind. This property offers a functional layout with spacious living areas and well sized bedrooms, making it a great option for homeowners or investors alike. The updated interior provides a fresh, move in ready feel, while the layout allows for comfortable everyday living. Outside, you’ll find space to enjoy or personalize to fit your needs. Conveniently located near shopping, dining, and all that Hot Springs has to offer, this is a great opportunity to own a renovated home at an attractive value
Key facts
- 6,098 sq ft lot
- Built 1999
- Listed 8 days
Neighborhood map
What this means for you Summary
Snapshot
- This is a 3-bed/2.0-bath manufactured listed at $160k. Condition is rated good.
Deal economics
- At list price, monthly cash flow is $-6 ($-70/yr) — negative.
- To cash-flow at today's rent, offer at most $159k (0.5% below list).
- To meet the 1% rule (rent ≥ 1% of price), the offer needs to be $139k (13.0% below list).
- Recommended offer: $139k (13.0% below list) — sets the bar for 1% rule.
- Cap rate 6.2% vs local median 1.5% in Rockwell — top-decile yield for the area; either an underpriced asset or a hidden risk that comps aren't pricing in. Stress-test before assuming the spread holds.
Location & tenants
- Location reads 68/100 on livability (#81 in AR) — a middle-class / working-renter tenant base. Strengths: crime A+, cost of living A+, housing A+; Watch: employment C-, amenities F, commute F.
- Lake Hamilton School District (rural): math 41% / reading 43% proficiency, ranked #54 of 238 in AR (top 23%) — families likely to look elsewhere, expect single-tenant / working-renter base with shorter leases.
- Zoned schools: Lake Hamilton Primary School (666 students, 69% FRL); Lake Hamilton Middle School (math 30% / reading 37%, grade F, #129 of 201 statewide, top 64%, 631 students, 66% FRL); Lake Hamilton High School (math 27% / reading 37%, grade F, #119 of 292 statewide, top 43%, 936 students, 59% FRL) — zoned schools average 64% FRL vs 45% district-wide (20 pts higher); higher-poverty schools than district average — tighter screening recommended.
- Market conditions: Rents rising fast (+6.4%/yr); 981 active listings in the ZIP; 6 comparable units currently listed for rent nearby; rentals lingering (median 46d on market — plan ~5-8 weeks vacancy on turnover, expect pricing pressure); 100% of comp listings sitting > 30 days — soft ceiling on asking rent; 117 units permitted in Garland County in 2024 (24 in 5+ unit buildings).
Forward outlook
- Local home prices are declining (-3.0%/yr); year-one equity from $1k of loan paydown is wiped out by about $5k of value loss. Plan a longer hold.
- Garland County population projected at +7% by 2050 — modest demand growth; plan on rents tracking national, not racing it.
Negotiation context
- Only 8 days on market — expect competitive offers; lowballing is unlikely to land.
- 2 sale attempts with the ask held roughly flat each time — persistent listings suggest the price (not the market) is what's stuck; bring a comps-based counter.
Risks & watch-outs
- Climate carrying-cost: major flood risk; extreme-heat days projected 7→20/yr by 2055 (HVAC capex compounding) — expect insurance premiums to compound above CPI over the hold.
Questions for the listing agent
- What do current leases actually rent for vs. the listed asking? Can we see a recent rent roll and the last 12 months of T-12 income?
- Is there a deadline driving the sale (1031 exchange, divorce, estate, relocation)? That informs how much negotiation room exists.
- Schools are D-rated, which usually means shorter tenancies and higher turnover. Who's the typical renter profile here, and what's been the actual vacancy rate?
- The area grade is low — what's the realistic commute time and amenity access for the typical tenant pool here? Any planned neighborhood developments (good or bad) we should know about?
- What's the average days-on-market for RENTAL listings here right now (not sales)? A rising rental-DOM trend means longer vacancies and softer asking-rent achievability than the comps imply.
- What's the recent tenant-quality profile in this submarket — average credit score on applications, eviction rate, late-payment / NSF rate, and stable-employment percentage? A property-management company in the area should have these aggregated.
- How much new for-sale + rental construction is in the pipeline within 1–3 miles? Heavy new supply typically softens prices + rents 12–24 months out; constrained supply supports both.
Investment metrics
- 1% rule
- 0.87% ✗
- Cap rate
- 6.25%
- Cash-on-cash
- -0.16%
- DSCR
- 0.99
- GRM
- 9.6
CMA / ARV
- ARV (on-the-fly)
- $139,552
- Comps found
- 1
Show comp detail 1 sale within ~0.75 mi
| Address | Dist | Beds/Ba | Sqft | Sold | Price | $/sf | Match |
|---|---|---|---|---|---|---|---|
| 362 Geronimo St | 0.00mi | 3/2.0 | 1,568 (0%) | 1mo | $140,000 | $89 | 99 |
Match score weights: distance 35% · size 25% · config 20% · recency 20%. Top-matched comps best support the ARV.
Projected returns pro-forma
-3.0% appreciation · 6.43% rent growth · sell at horizon
- IRR
- -12.8%
- Equity multiple
- 0.52×
- Total profit
- $-21,306
- Equity at exit
- $23,857
- IRR
- 0.8%
- Equity multiple
- 1.07×
- Total profit
- $2,944
- Equity at exit
- $13,834
Cash invested: $44,800 (down + closing). Projections, not guarantees.
Landlord ↔ Tenant lean methodology
- Overall (STATE)
- 92 Strongly Landlord-Friendly
- State Arkansas
- 92 Strongly Landlord-Friendly · R+14
- County
- — inherits STATE
- City
- — inherits STATE
ZIP-level market 71913
- Home prices YoY
- -33.9%
- Rents YoY
- 6.4%
- Active inventory
- 981
- Price-to-rent
- 9.6×
Monthly cashflow live
- Estimated rent
- $1,392 high interval (Pro) →
- Mortgage (P&I)
- −$839
- Tax est. 1.5%
- −$200 /mo · $2,400/yr
- Insurance
- −$67
- HOA
- −$0
- Vacancy / Maint / Mgmt
- −$292
- Net cashflow
- $-6
Break-even live
Sensitivity live
| Price | -10% $105 | -5% $49 | +0% $-6 | +5% $-61 | +10% $-116 |
|---|---|---|---|---|---|
| Rent | -10% $-116 | -5% $-61 | +0% $-6 | +5% $49 | +10% $104 |
| Rate | -1.0pp $75 | -0.5pp $35 | base $-6 | +0.5pp $-47 | +1.0pp $-89 |
UW: 25.0% down · 7.5% · 30yr · 1.5% tax · 5.0% vac · 8.0% maint · 8.0% mgmt
Financing live
Cash to close
- Down payment
- $40,000
- Closing costs
- $4,800
- Reserves months
- —
- Total cash needed
- —
Loan-product check · same deal, 3 products live
Conventional
25% down · 7.5% · 30yr
- Down + closing
- —
- Monthly P&I
- —
- Monthly cashflow
- —
- DSCR
- —
- Eligible?
- —
Personal DTI + credit; lowest rate.
DSCR
20% down · 8.5% · 30yr
- Down + closing
- —
- Monthly P&I
- —
- Monthly cashflow
- —
- DSCR
- —
- Eligible?
- —
No personal income docs; deal must DSCR.
Hard money
10% down · 12.0% · 12mo
- Down + closing
- —
- Monthly P&I
- —
- Monthly cashflow
- —
- DSCR
- —
- Eligible?
- —
Short-term bridge; refi at stabilization.
Rent comps 6 comps
| Address | Beds | Baths | Sqft | Rent | $/sqft | DOM | Units | Dist |
|---|---|---|---|---|---|---|---|---|
| 155a Lake Vista Cv Unit B Hot Springs National Park, AR | 3.0 | 2.0 | 1216 | $1,430 | $1.18 | 45d | 1 | 0.31mi |
| 211 White Eagle Trl Hot Springs National Park, AR | 2.0 | 2.0 | 1200 | $1,400 | $1.17 | 45d | 1 | 0.90mi |
| 215 White Eagle Trl Hot Springs National Park, AR | 2.0 | 2.0 | 1200 | $1,400 | $1.17 | 45d | 1 | 0.91mi |
| 147 Bledsoe Cir Unit F Hot Springs National Park, AR | 2.0 | 2.0 | 1188 | $825 | $0.69 | 45d | 1 | 1.21mi |
| 113 Shadow Peak Ln Unit B Hot Springs National Park, AR | 3.0 | 2.5 | 1649 | $1,700 | $1.03 | 46d | 1 | 1.27mi |
| 106A Shadow Peak Ln Unit A Hot Springs National Park, AR | 3.0 | 2.5 | 1666 | $1,700 | $1.02 | 46d | 1 | 1.32mi |
Listing history 4 events
-
2026-04-25status Pending 625-char remark
Show marketing remark (625 chars)
Recently renovated home in the heart of Hot Springs featuring major updates, including a new roof for added peace of mind. This property offers a functional layout with spacious living areas and well sized bedrooms, making it a great option for homeowners or investors alike. The updated interior provides a fresh, move in ready feel, while the layout allows for comfortable everyday living. Outside, you’ll find space to enjoy or personalize to fit your needs. Conveniently located near shopping, dining, and all that Hot Springs has to offer, this is a great opportunity to own a renovated home at an attractive value
-
2026-04-25status Under Contract
Show marketing remark (625 chars)
Recently renovated home in the heart of Hot Springs featuring major updates, including a new roof for added peace of mind. This property offers a functional layout with spacious living areas and well sized bedrooms, making it a great option for homeowners or investors alike. The updated interior provides a fresh, move in ready feel, while the layout allows for comfortable everyday living. Outside, you’ll find space to enjoy or personalize to fit your needs. Conveniently located near shopping, dining, and all that Hot Springs has to offer, this is a great opportunity to own a renovated home at an attractive value
-
2026-04-17$160,000 Active 625-char remark
Show marketing remark (625 chars)
Recently renovated home in the heart of Hot Springs featuring major updates, including a new roof for added peace of mind. This property offers a functional layout with spacious living areas and well sized bedrooms, making it a great option for homeowners or investors alike. The updated interior provides a fresh, move in ready feel, while the layout allows for comfortable everyday living. Outside, you’ll find space to enjoy or personalize to fit your needs. Conveniently located near shopping, dining, and all that Hot Springs has to offer, this is a great opportunity to own a renovated home at an attractive value
-
2026-04-17$160,000 New Listing
Show marketing remark (625 chars)
Recently renovated home in the heart of Hot Springs featuring major updates, including a new roof for added peace of mind. This property offers a functional layout with spacious living areas and well sized bedrooms, making it a great option for homeowners or investors alike. The updated interior provides a fresh, move in ready feel, while the layout allows for comfortable everyday living. Outside, you’ll find space to enjoy or personalize to fit your needs. Conveniently located near shopping, dining, and all that Hot Springs has to offer, this is a great opportunity to own a renovated home at an attractive value
ⓘ Source: listings_history table (triggers on properties + properties_extension) + one-shot
backfill from property_details.listing_events for pre-trigger history.
Climate risk First Street
- Flood 6/10 Major FEMA zone X (unshaded) · 68% chance over 30 yrs
- Wildfire 3/10 Moderate
- Heat 6/10 Major 7 d/yr ≥110°F today · 20 d/yr by 30 yrs out
- Wind 4/10 Moderate 10% chance of damaging wind over 30 yrs
- Air quality 1/10 Low 0 unhealthy d/yr today · 0 by 30 yrs out
Nearby sold comps map
Loading sold comps map…
Walkable amenities ~0.75 mi
Loading nearby amenities…
Taxation est. · year 1
- Rental income
- $16,708
- − Mortgage interest
- −$8,962
- − Property taxes
- −$2,400
- − Insurance
- −$800
- − Repairs & maintenance
- −$1,337
- − Management
- −$1,337
- − Depreciation
- −$4,655
- Taxable loss
- −$2,783
- Est. tax savings @ 24.0%
- +$668
- After-tax cash flow
- $598/yr
For passive investors: Depreciation is non-cash, so a rental often shows a tax loss while cash-flowing — sheltering income. Rental losses are passive: they offset passive income freely, and up to $25,000/yr can offset ordinary (W-2) income if you actively participate and your MAGI is under $100k (phasing out to $0 by $150k); unused losses carry forward. On sale, claimed depreciation is recaptured at up to 25%, and gains may owe capital-gains tax (a 1031 exchange can defer both). Figures are a year-1 estimate at your 24.0% rate — not tax advice; consult a CPA.
Condition & rehab AI · 12 photos
This recently renovated mobile home in Hot Springs offers a good condition with updated interiors and a new roof, making it a great investment opportunity.
Value-add opportunities
- Both Paint exterior siding — Enhances curb appeal and value
- Both Clean gutters — Improves drainage and property value
Renovation cost estimate screening
Value-add ROI direction
- Both Paint exterior siding — Enhances curb appeal and value ↑
- Both Clean gutters — Improves drainage and property value ↑
ⓘ Cost ranges are severity-bucket heuristics (US national rule-of-thumb). Get contractor quotes + a written scope before underwriting a rehab budget.
Schools (NCES district)
- District
- Lake Hamilton School District
- NCES district ID
- 0508610
- Math proficiency
- 41% ▼ -15.00%
- Reading proficiency
- 43% ▼ -7.00%
- Median HH income
- $46,223
- Composite
- 35.79/100
- National rank
- #4834
- State rank
- #54 of 238 in AR
Livability — Rockwell
- Score
- 68/100
- State rank
- #81
- US rank
- #9175
Category grades
Schools grade is shown separately in the Schools card above.
Census & demographics
- County
- Garland County · 76,414 people
- Metro
- Hot Springs, AR
- Population (ZIP)
- 47,477
- Household income
- $56,010
- Rent vs Own
- Severe rent burden
- 1442.0
Population outlook (Garland County) Hauer SSP2
- Today (2025)
- 100,343 people
- By 2030
- 101,880 · +1.5%
- By 2040
- 104,804 · +4.4%
- By 2050
- 107,292 · +6.9%
- By 2075
- 113,182 · +12.8%
- By 2100
- 112,247 · +11.9%
Race, ethnicity, and origin ACS 2023
- Neighborhood character
- Predominantly White (79%)
- Race & ethnicity
- White 79% Hispanic / Latino 8% Black 8% Two or more races 6% Asian 1%
- Hispanic origin (detail)
- Mexican 6%
- Common ancestry
- Italian 3% Lithuanian 2% Slovak 2%
- Foreign-born
- 5% · Canada
- Languages at home
- 91% English-only · Spanish 7% Other Indo-European 1%
Political lean MEDSL · Garland
- 2024 margin
- Solid R (+36.2) · D 30.8% · R 67.0% · Other 2.2%
- 2008→2024 swing
- -11.3pp toward R · 2008: -25.0pp · 2024: -36.2pp
- All cycles
- 2024: R+36.2 2020: R+34.0 2016: R+34.1 2012: R+29.9 2008: R+25.0
Not yet ingested
- Civics
- —
Market trends
- HPI YoY
- ▼ -137.67%
- Current HPI
- 268.5228
- Rent YoY
- ▲ 6.43%
- Metro
- Hot Springs, AR
- State GDP YoY
- ▲ 3.80%
- F500 in state
- 10
Industry mix (Fortune 500 HQ in AR)
| Industry | F500 HQs | Revenue |
|---|---|---|
| Retail | 1 | $681B |
|
||
| Food / Agriculture | 1 | $53B |
|
||
| Retail / Energy | 1 | $22B |
|
||
| Transportation / Logistics | 1 | $12B |
|
||
| Energy | 1 | $4B |
|
||
Price history
+0.0% since first listed4 events — show timeline
- 2026-04-25 Pending — HSBOR
- 2026-04-25 Pending — CARMLS
- 2026-04-17 Listed $160,000 CARMLS
- 2026-04-17 Listed $160,000 HSBOR
Property tax history
-0.1%/yrLatest (2025): $250 · -1.4% YoY. Source: county tax records.
Cash-flow waterfall
monthlySold comps — $/sqft
last 12 mo · ≤1 miLoading sold comps…