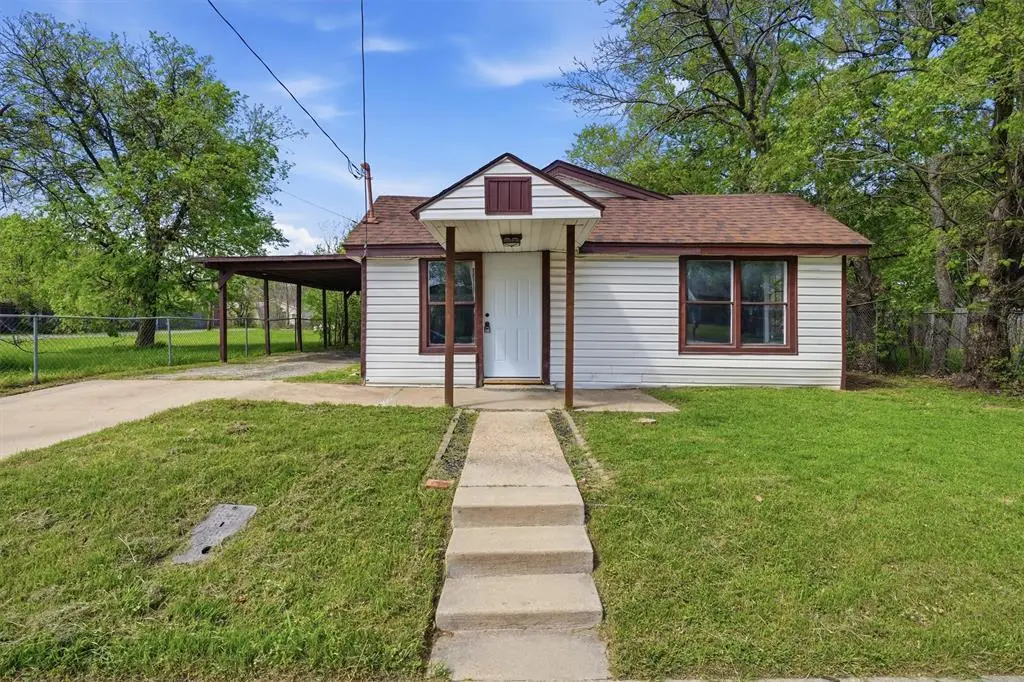
403 Elmo St · Cleburne, TX
Flood risk 1/10 · Minimal
- FEMA flood zone
- X (unshaded)
- Chance of flooding over 30 yrs
- 0.0%
- Est. flood insurance / yr
- $507 – $1,088
Fire risk 5/10 · Moderate
- Est. fire insurance / yr
- $1,222 – $2,270
Heat risk 7/10 · Major
- Hot days now (above 109°F)
- 7 days/yr
- Hot days in 30 yrs
- 24 days/yr
Wind risk 6/10 · Moderate
- Chance of severe wind over 30 yrs
- 27.0%
Air-quality risk 2/10 · Minimal
- Unhealthy air days now
- 1 days/yr
- Unhealthy air days in 30 yrs
- 2 days/yr
Risk factors via First Street. Map © Google.
Why this score? — see what drove the D grade
The composite is a weighted blend of 9 inputs, each scored 0–100. Each bar is that input's sub-score; the figure is the points it added to the 100-point composite (weight × sub-score).
- ARV discount +11.4/15.0
- Cash flow +10.8/30.0
- 1% rule +3.9/10.0
- Livability +3.4/5.0
- DSCR +3.1/10.0
- Schools +2.9/10.0
- Rent growth +2.5/5.0
- Condition / age +2.5/5.0
- Appreciation +0.0/10.0
$145,000
🖨 Deal sheet (PDF) 📄 Offer letter ✓ Due diligence
Listing remarks MLS
CASH FLOWING PROPERTY STAYS RENTED! INVESTORS! This property is rented out for $1,395 thru July 31st, 2024 with great tenants who pay on time every month! This home was remodeled in 2022 with NEW HVAC, new cabinets, new paint inside and out, new stainless steel appliances, new light and plumbing fixtures, new wood flooring, new tile, new carpet and more! Large open living area that opens to a brand new kitchen, oversized lot with a storage building. Low property taxes at $1,882 for 2023! This is a great rental property to add to your portfolio!
Key facts
- New flooring
- Open living area
- Spacious lot
Tags
Property features AI
Finance
- Other: Property is in Johnson County, Texas; Subdivision: Original Cleburn; Posession upon completion
- Financial info: No second mortgage; Loan type listed as 'Treat As Clear'
- HOA & community: No homeowners association
Exterior
- Parking: Detached carport; 1 covered space; 1 carport space
- Security: No specific security features listed
- Utilities: City water; Electricity connected; Not in a municipal utility district
- Home design: Single family residence; Residential property; Built in 1980; Not attached to other units
- Construction: Year built 1980; No specific construction materials, roof, or foundation details listed
- Exterior features: Chain link fencing; Lot under 0.5 acre (about 0.18 acre)
Interior
- Kitchen: Dishwasher; Garbage disposal; Electric cooktop; Electric oven; Microwave
- Bedrooms: 3 bedrooms (primary bedroom on main level)
- Flooring: No flooring details listed
- Bathrooms: 1 full bathroom
- Heating & cooling: No heating or cooling details listed
- Interior features: One-level layout; Living area approximately 888; Living room; Dining area; Other interior features
- Laundry & utility: No specific laundry details listed
Neighborhood map
What this means for you Summary
Snapshot
- This is a 2-bed/1.0-bath single-family listed at $145k.
Deal economics
- At list price, monthly cash flow is $-66 ($-790/yr) — negative.
- To cash-flow at today's rent, offer at most $133k (8.0% below list).
- To meet the 1% rule (rent ≥ 1% of price), the offer needs to be $129k (11.1% below list).
- Recommended offer: $129k (11.1% below list) — sets the bar for 1% rule.
- Cap rate 5.7% vs local median 3.6% in Cleburne — top-decile yield for the area; either an underpriced asset or a hidden risk that comps aren't pricing in. Stress-test before assuming the spread holds.
Location & tenants
- Location reads 68/100 on livability (#460 in TX) — a middle-class / working-renter tenant base. Strengths: cost of living A+, housing A+, health & safety A+; Watch: employment C-, amenities F, commute F.
- Cleburne ISD (town): math 34% / reading 33% proficiency, ranked #537 of 826 in TX (top 65%) — families likely to look elsewhere, expect single-tenant / working-renter base with shorter leases.
- Zoned schools: Irving El (math 26% / reading 26%, grade F, #2,954 of 4,322 statewide, top 69%, 521 students, 83% FRL); Ad Wheat Middle (math 31% / reading 29%, grade F, #1,056 of 1,662 statewide, top 65%, 703 students, 76% FRL); Cleburne H S (math 46% / reading 38%, grade F, #730 of 1,632 statewide, top 47%, 1,976 students, 67% FRL) — zoned schools average 75% FRL vs 56% district-wide (20 pts higher); higher-poverty schools than district average — tighter screening recommended.
- Market conditions: 338 active listings in the ZIP; 17 comparable units currently listed for rent nearby; rentals leasing fast (median 12d on market — plan ~1-2 weeks tenant-placement turnaround); 2,152 units permitted in Johnson County in 2024 (76 in 5+ unit buildings).
Forward outlook
- Local home prices are declining (-3.0%/yr); year-one equity from $1k of loan paydown is wiped out by about $4k of value loss. Plan a longer hold.
- Johnson County population projected at +24% by 2050 — long-run rental-demand tailwind backs the buy-and-hold thesis.
Negotiation context
- It's been on market 19 days — a 2% lower offer ($143k) is reasonable based on typical stale-listing flexibility.
- 5 sale attempts since 4y ago with the ask held roughly flat each time — persistent listings suggest the price (not the market) is what's stuck; bring a comps-based counter.
Risks & watch-outs
- Climate carrying-cost: major wind risk, 27% chance of damaging wind over 30y; moderate wildfire risk; extreme-heat days projected 7→24/yr by 2055 (HVAC capex compounding) — expect insurance premiums to compound above CPI over the hold.
Questions for the listing agent
- What do current leases actually rent for vs. the listed asking? Can we see a recent rent roll and the last 12 months of T-12 income?
- Is there a deadline driving the sale (1031 exchange, divorce, estate, relocation)? That informs how much negotiation room exists.
- Schools are F-rated, which usually means shorter tenancies and higher turnover. Who's the typical renter profile here, and what's been the actual vacancy rate?
- The area grade is low — what's the realistic commute time and amenity access for the typical tenant pool here? Any planned neighborhood developments (good or bad) we should know about?
- What's the average days-on-market for RENTAL listings here right now (not sales)? A rising rental-DOM trend means longer vacancies and softer asking-rent achievability than the comps imply.
- What's the recent tenant-quality profile in this submarket — average credit score on applications, eviction rate, late-payment / NSF rate, and stable-employment percentage? A property-management company in the area should have these aggregated.
- How much new for-sale + rental construction is in the pipeline within 1–3 miles? Heavy new supply typically softens prices + rents 12–24 months out; constrained supply supports both.
Investment metrics
- 1% rule
- 0.89% ✗
- Cap rate
- 5.75%
- Cash-on-cash
- -1.95%
- DSCR
- 0.91
- GRM
- 9.4
CMA / ARV
- ARV (on-the-fly)
- $158,952
- Comps found
- 9
Show comp detail 9 sales within ~0.75 mi
| Address | Dist | Beds/Ba | Sqft | Sold | Price | $/sf | Match |
|---|---|---|---|---|---|---|---|
| 222 Cleveland St | 0.27mi | 2/1.0 | 900 (+1%) | 6mo | $129,000 | $143 | 80 |
| 211 Huron St | 0.37mi | 2/1.0 | 952 (+7%) | 2mo | $169,999 | $179 | 69 |
| 403 Huron St | 0.43mi | 2/1.0 | 896 (+1%) | 14mo | $172,000 | $192 | 66 |
| 407 Erie St | 0.33mi | 2/1.0 | 966 (+9%) | 6mo | $90,000 | $93 | 65 |
| 1805 N Robinson St | 0.66mi | 2/1.0 | 858 (-3%) | 13mo | $190,000 | $221 | 53 |
| 213 Cleveland St | 0.28mi | 2/1.0 | 1,020 (+15%) | 13mo | $59,000 | $58 | 52 |
| 1404 N Wilhite St | 0.43mi | 3/2.0 (+1) | 932 (+5%) | 14mo | $197,000 | $211 | 51 |
| 1407 N Wilhite St | 0.45mi | 3/1.0 (+1) | 933 (+5%) | 24mo | $165,000 | $177 | 46 |
| 1007 N Border St | 0.52mi | 2/1.0 | 820 (-8%) | 23mo | $159,000 | $194 | 44 |
Match score weights: distance 35% · size 25% · config 20% · recency 20%. Top-matched comps best support the ARV.
Projected returns pro-forma
-3.0% appreciation · 3.0% rent growth · sell at horizon
- IRR
- -19.5%
- Equity multiple
- 0.32×
- Total profit
- $-27,621
- Equity at exit
- $21,620
- IRR
- -12.1%
- Equity multiple
- 0.28×
- Total profit
- $-29,169
- Equity at exit
- $12,537
Cash invested: $40,600 (down + closing). Projections, not guarantees.
Landlord ↔ Tenant lean methodology
- Overall (STATE)
- 87 Strongly Landlord-Friendly
- State Texas
- 87 Strongly Landlord-Friendly · R+5
- County
- — inherits STATE
- City
- — inherits STATE
ZIP-level market 76031
- Home prices YoY
- -17.6%
- Active inventory
- 338
- Price-to-rent
- 9.4×
Monthly cashflow live
- Estimated rent
- $1,288 high interval (Pro) →
- Mortgage (P&I)
- −$760
- Tax from tax record
- −$263 /mo · $3,154/yr
- Insurance
- −$60
- HOA
- −$0
- Vacancy / Maint / Mgmt
- −$271
- Net cashflow
- $-66
Break-even live
Sensitivity live
| Price | -10% $16 | -5% $-25 | +0% $-66 | +5% $-107 | +10% $-148 |
|---|---|---|---|---|---|
| Rent | -10% $-168 | -5% $-117 | +0% $-66 | +5% $-15 | +10% $36 |
| Rate | -1.0pp $7 | -0.5pp $-29 | base $-66 | +0.5pp $-103 | +1.0pp $-142 |
UW: 25.0% down · 7.5% · 30yr · 1.5% tax · 5.0% vac · 8.0% maint · 8.0% mgmt
Financing live
Cash to close
- Down payment
- $36,250
- Closing costs
- $4,350
- Reserves months
- —
- Total cash needed
- —
Loan-product check · same deal, 3 products live
Conventional
25% down · 7.5% · 30yr
- Down + closing
- —
- Monthly P&I
- —
- Monthly cashflow
- —
- DSCR
- —
- Eligible?
- —
Personal DTI + credit; lowest rate.
DSCR
20% down · 8.5% · 30yr
- Down + closing
- —
- Monthly P&I
- —
- Monthly cashflow
- —
- DSCR
- —
- Eligible?
- —
No personal income docs; deal must DSCR.
Hard money
10% down · 12.0% · 12mo
- Down + closing
- —
- Monthly P&I
- —
- Monthly cashflow
- —
- DSCR
- —
- Eligible?
- —
Short-term bridge; refi at stabilization.
Rent comps 17 comps
| Address | Beds | Baths | Sqft | Rent | $/sqft | DOM | Units | Dist |
|---|---|---|---|---|---|---|---|---|
| 122 Ramsey St #124 Cleburne, TX | 2.0 | 1.0 | 880 | $1,050 | $1.19 | 24d | 1 | 0.63mi |
| 122 Ramsey Ave Cleburne, TX | 2.0 | 1.0 | 880 | $1,050 | $1.19 | 0d | 1 | 0.63mi |
| 1610 N Anglin St Cleburne, TX | 3.0 | 1.0 | 900 | $1,500 | $1.67 | 20d | 1 | 0.66mi |
| 1705 N Robinson St Cleburne, TX | 3.0 | 1.5 | 1076 | $1,450 | $1.35 | 0d | 1 | 0.67mi |
| 1705 N Robinson St Cleburne, TX | 3.0 | 2.0 | 1076 | $1,450 | $1.35 | 26d | 1 | 0.67mi |
| 901 N Border St Unit A Cleburne, TX | 2.0 | 1.0 | 900 | $950 | $1.06 | 45d | 1 | 0.77mi |
| 1308 N Brazos Ave Cleburne, TX | 3.0 | 2.0 | 1028 | $1,595 | $1.55 | 26d | 1 | 0.84mi |
| 2205 Pipeline Rd Cleburne, TX | 2.0 | 1.0–2.0 | 949 | $1,308 | $1.38 | 0d | 53 | 1.16mi |
| 400 Phillips St Cleburne, TX | 2.0–3.0 | 1.0–1.5 | 1000 | $1,255 | $1.25 | 0d | 4 | 1.17mi |
| 601 Royal St Cleburne, TX | 2.0 | 1.0 | 720 | $1,325 | $1.84 | 45d | 1 | 1.19mi |
| 601 Royal St Cleburne, TX | 2.0 | 1.0 | 720 | $1,300 | $1.81 | 9d | 1 | 1.19mi |
| 601 Royal St Cleburne, TX | 2.0 | 1.0 | 720 | $1,375 | $1.91 | 4d | 1 | 1.19mi |
| 431 N Wilhite St Unit 431 Cleburne, TX | 2.0 | 1.0 | 750 | $1,195 | $1.59 | 21d | 1 | 1.20mi |
| 112 W Wilson St Cleburne, TX | 2.0 | 1.0 | 1002 | $1,400 | $1.40 | 45d | 1 | 1.32mi |
| 305 N Robinson St Unit C, Upstairs Right Cleburne, TX | 1.0 | 1.0 | 574 | $799 | $1.39 | 5d | 1 | 1.39mi |
| 305 N Robinson St Cleburne, TX | 1.0 | 1.0 | 574 | $849 | $1.48 | 12d | 1 | 1.39mi |
| 115 Cleburne Station Pkwy Cleburne, TX | 1.0–3.0 | 1.0–2.0 | 977 | $2,045 | $2.09 | 0d | 1 | 1.40mi |
Listing history 12 events
-
2026-06-21days on market $145,000 Active 19 DOM
-
2026-06-18days on market $145,000 Active 16 DOM
-
2026-06-17days on market $145,000 Active 15 DOM
-
2026-06-16days on market $145,000 Active 14 DOM
-
2026-06-15days on market $145,000 Active 13 DOM
-
2026-06-13days on market $145,000 Active 11 DOM
-
2026-06-09days on market $145,000 Active 7 DOM
-
2026-06-08days on market $145,000 Active 6 DOM
-
2026-06-07days on market $145,000 Active 5 DOM
-
2026-06-04days on market $145,000 Active 2 DOM
-
2026-06-02remarks 532-char remark
-
2026-06-02$145,000 Active 1 DOM
ⓘ Source: listings_history table (triggers on properties + properties_extension) + one-shot
backfill from property_details.listing_events for pre-trigger history.
Tax reassessment forecast TX · Resets to sale price
- Current annual tax
- $3,154 · $263/mo
- Projected year-2 tax
- $3,154 · $263/mo
- Expected delta
- $0/yr ($0/mo · 0.0%)
ⓘ Screening estimate from a state-policy table — verify with the county assessor before closing.
Climate risk First Street
- Flood 1/10 Low FEMA zone X (unshaded) · 0% chance over 30 yrs
- Wildfire 5/10 Major
- Heat 7/10 Severe 7 d/yr ≥109°F today · 24 d/yr by 30 yrs out
- Wind 6/10 Major 27% chance of damaging wind over 30 yrs
- Air quality 2/10 Low 1 unhealthy d/yr today · 2 by 30 yrs out
Nearby sold comps map
Loading sold comps map…
Walkable amenities ~0.75 mi
Loading nearby amenities…
Taxation est. · year 1
- Rental income
- $15,460
- − Mortgage interest
- −$8,122
- − Property taxes
- −$3,154
- − Insurance
- −$725
- − Repairs & maintenance
- −$1,237
- − Management
- −$1,237
- − Depreciation
- −$4,218
- Taxable loss
- −$3,233
- Est. tax savings @ 24.0%
- +$776
- After-tax cash flow
- $-14/yr
For passive investors: Depreciation is non-cash, so a rental often shows a tax loss while cash-flowing — sheltering income. Rental losses are passive: they offset passive income freely, and up to $25,000/yr can offset ordinary (W-2) income if you actively participate and your MAGI is under $100k (phasing out to $0 by $150k); unused losses carry forward. On sale, claimed depreciation is recaptured at up to 25%, and gains may owe capital-gains tax (a 1031 exchange can defer both). Figures are a year-1 estimate at your 24.0% rate — not tax advice; consult a CPA.
Schools (NCES district)
- District
- Cleburne ISD
- NCES district ID
- 4814310
- Math proficiency
- 34% ▼ -2.00%
- Reading proficiency
- 33% ▼ -2.00%
- Median HH income
- $48,788
- Composite
- 29.0/100
- National rank
- #6618
- State rank
- #537 of 826 in TX
Livability — Cleburne
- Score
- 68/100
- State rank
- #460
- US rank
- #9292
Category grades
Schools grade is shown separately in the Schools card above.
Census & demographics
- Census place
- Cleburne, TX
- City population
- 29,538
- Population (ZIP)
- 18,697
Population outlook (Johnson County) Hauer SSP2
- Today (2025)
- 179,678 people
- By 2030
- 189,208 · +5.3%
- By 2040
- 207,261 · +15.4%
- By 2050
- 223,064 · +24.1%
- By 2075
- 259,979 · +44.7%
- By 2100
- 275,395 · +53.3%
Race, ethnicity, and origin ACS 2023
- Neighborhood character
- Predominantly White (66%)
- Race & ethnicity
- White 66% Hispanic / Latino 28% Two or more races 12% Black 3%
- Hispanic origin (detail)
- Mexican 23% Puerto Rican 3%
- Common ancestry
- Italian 1% Lithuanian 1% Slovak 1%
- Foreign-born
- 5% · Canada, Vietnam
- Languages at home
- 77% English-only · Spanish 22% Vietnamese 0%
Political lean MEDSL · Johnson
- 2024 margin
- Solid R (+51.4) · D 23.9% · R 75.3%
- 2008→2024 swing
- -3.9pp toward R · 2008: -47.5pp · 2024: -51.4pp
- All cycles
- 2024: R+51.4 2020: R+53.0 2016: R+58.3 2012: R+55.6 2008: R+47.5
Not yet ingested
- Civics
- —
Market trends
- HPI YoY
- ▼ -59.43%
- Current HPI
- 277.598
- Rent YoY
- —
- Metro
- —
- State GDP YoY
- ▲ 3.95%
- F500 in state
- 110
Industry mix (Fortune 500 HQ in TX)
| Industry | F500 HQs | Revenue |
|---|---|---|
| Energy | 16 | $1,198B |
|
||
| Technology | 5 | $198B |
|
||
| Engineering / Construction | 4 | $72B |
|
||
| Energy Services | 3 | $60B |
|
||
| Utilities | 3 | $41B |
|
||
| Healthcare | 2 | $330B |
|
||
Price history
+45.0% since first listed15 events — show timeline
- 2026-05-06 Listed $145,000 NTREIS
- 2026-04-28 Sold (Public Records) — Public Records
- 2023-12-20 Sold (MLS) — NTREIS
- 2023-12-11 Pending — NTREIS
- 2023-12-01 Contingent — NTREIS
- 2023-11-20 Relisted — NTREIS
- 2023-11-18 Contingent — NTREIS
- 2023-11-01 Listed $160,000 NTREIS
- 2022-03-01 Sold (Public Records) — Public Records
- 2022-02-25 Sold (MLS) — NTREIS
- 2022-02-18 Pending — NTREIS
- 2022-02-07 Relisted — NTREIS
- 2022-02-04 Contingent — NTREIS
- 2022-01-31 Listed $100,000 NTREIS
- 1996-11-14 Sold (Public Records) — Public Records
Property tax history
+13.5%/yrLatest (2025): $3,154 · +1.5% YoY. Source: county tax records.
Cash-flow waterfall
monthlySold comps — $/sqft
last 12 mo · ≤1 miLoading sold comps…