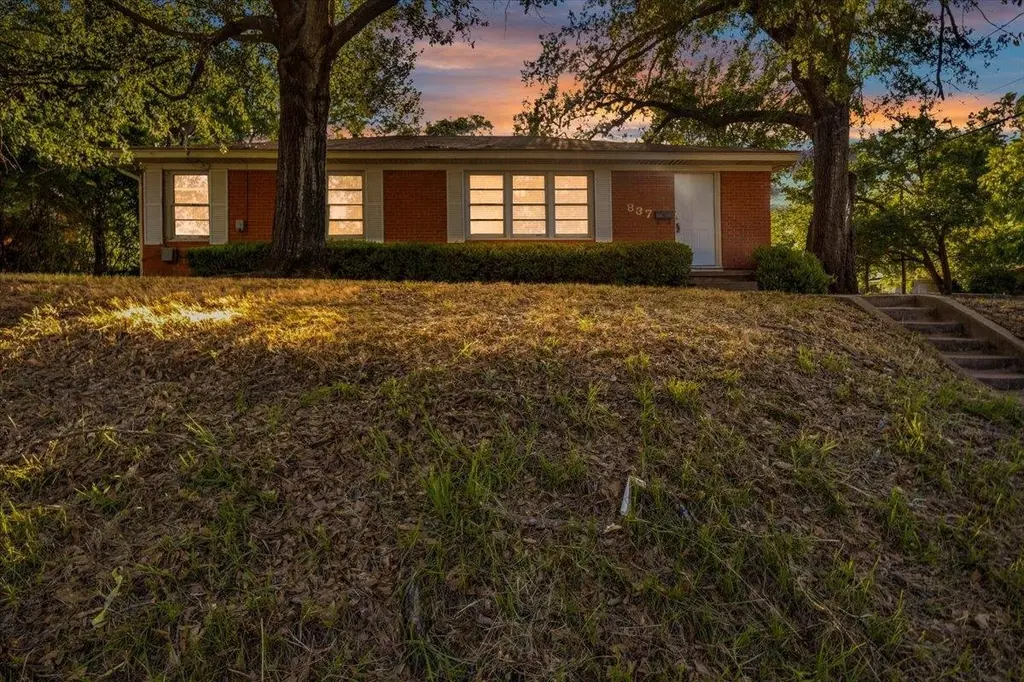
837 S Palmer Ave · Tyler, TX
Flood risk 1/10 · Minimal
- FEMA flood zone
- X (unshaded)
- Chance of flooding over 30 yrs
- 0.0%
- Est. flood insurance / yr
- $507 – $1,088
Fire risk 1/10 · Minimal
- Est. fire insurance / yr
- $1,222 – $2,270
Heat risk 7/10 · Major
- Hot days now (above 109°F)
- 7 days/yr
- Hot days in 30 yrs
- 26 days/yr
Wind risk 6/10 · Moderate
- Chance of severe wind over 30 yrs
- 63.0%
Air-quality risk 2/10 · Minimal
- Unhealthy air days now
- 0 days/yr
- Unhealthy air days in 30 yrs
- 1 days/yr
Risk factors via First Street. Map © Google.
Why this score? — see what drove the D- grade
The composite is a weighted blend of 9 inputs, each scored 0–100. Each bar is that input's sub-score; the figure is the points it added to the 100-point composite (weight × sub-score).
- Cash flow +11.8/30.0
- ARV discount +8.1/15.0
- Livability +3.8/5.0
- 1% rule +3.6/10.0
- DSCR +3.5/10.0
- Schools +3.3/10.0
- Rent growth +3.1/5.0
- Condition / age +2.5/5.0
- Appreciation +0.0/10.0
$164,900
🖨 Deal sheet (PDF) 📄 Offer letter ✓ Due diligence
Listing remarks MLS
This 3-bedroom, 1-bathroom home in Tyler, Texas offers an excellent opportunity for investors or buyers seeking a foreclosure property with strong potential. The residence includes an open attached carport with additional storage space and a garage area with an attached shed or storage closet for added functionality. The home features a practical layout that’s ready for updates, offering a solid foundation for renovation or rental use. Whether you’re looking to fix and flip or expand your rental portfolio, this property presents a compelling option in a sought-after location. Just a short walk from Tyler Junior College and only blocks from both major hospitals, the home is ideally situated for students, healthcare professionals, or future tenants. Its central location, combined with accessible amenities and strong structural bones, make it a worthwhile project for those with vision and a willingness to invest in improvements. Don’t miss the chance to transform this property into a rewarding investment in one of Tyler’s most convenient and high-demand areas. Schedule your showing today.
Key facts
- Practical layout
- Attached shed
- Garage area
Tags
Property features AI
Exterior
- Parking: 1-car garage
- Utilities: Public water; Public sewer
- Home design: Single family residence; Single-story
- Construction: Brick veneer construction
- Exterior features: Chain link fence; Composition roof; Lot approximately 105' x 75' (0.18 acres)
Interior
- Kitchen: Dishwasher; Refrigerator
- Bathrooms: 1 full bathroom
- Heating & cooling: Central heating (electric); Central air; Ceiling fans
- Interior features: Dishwasher; Refrigerator; Three total rooms
Neighborhood map
What this means for you Summary
Snapshot
- This is a 3-bed/1.5-bath single-family listed at $165k.
Deal economics
- At list price, monthly cash flow is $-46 ($-556/yr) — negative.
- To cash-flow at today's rent, offer at most $157k (5.0% below list).
- To meet the 1% rule (rent ≥ 1% of price), the offer needs to be $142k (13.9% below list).
- Recommended offer: $142k (13.9% below list) — sets the bar for 1% rule.
- Cap rate 6.0% vs local median 3.5% in Tyler — top-decile yield for the area; either an underpriced asset or a hidden risk that comps aren't pricing in. Stress-test before assuming the spread holds.
Location & tenants
- Location reads 75/100 on livability (#147 in TX, #4,181 nationally) — a middle-class / working-renter tenant base. Strengths: cost of living A+, housing A+, health & safety A+; Watch: employment C-, crime D+, commute F.
- Tyler ISD (urban): math 39% / reading 38% proficiency, ranked #449 of 826 in TX (top 54%) — families likely to look elsewhere, expect single-tenant / working-renter base with shorter leases; 66% free/reduced lunch — lower-income household profile, screen leases tightly.
- Zoned schools: Bell El (math 48% / reading 47%, grade D, #989 of 4,322 statewide, top 23%, 533 students, 88% FRL); Moore Mst Magnet School (math 46% / reading 39%, grade D-, #553 of 1,662 statewide, top 34%, 1,113 students, 87% FRL); Tyler H S (math 26% / reading 27%, grade F, #1,228 of 1,632 statewide, top 76%, 2,164 students, 90% FRL) — zoned schools average 88% FRL vs 66% district-wide (23 pts higher); higher-poverty schools than district average — tighter screening recommended.
- Market conditions: Rents rising (+2.3%/yr); 156 active listings in the ZIP; 26 comparable units currently listed for rent nearby; rentals at typical pace (median 23d on market — plan ~3-4 weeks tenant-placement turnaround); 595 units permitted in Smith County in 2024 (45 in 5+ unit buildings).
- This rent runs 33% of the median local income ($52k/yr) — at the standard rent-burdened threshold; future hikes will face affordability resistance.
Forward outlook
- Local home prices are declining (-3.0%/yr); year-one equity from $1k of loan paydown is wiped out by about $5k of value loss. Plan a longer hold.
- Smith County population projected at +24% by 2050 — long-run rental-demand tailwind backs the buy-and-hold thesis.
Negotiation context
- It's been on market 40 days — a 3% lower offer ($160k) is reasonable based on typical stale-listing flexibility.
- 4 sale attempts since 3y ago with the ask held roughly flat each time — persistent listings suggest the price (not the market) is what's stuck; bring a comps-based counter.
Risks & watch-outs
- Watch-outs: built in 1954 — expect roof / HVAC / electrical / plumbing capex.
- Climate carrying-cost: major wind risk, 63% chance of damaging wind over 30y; extreme-heat days projected 7→26/yr by 2055 (HVAC capex compounding) — expect insurance premiums to compound above CPI over the hold.
Questions for the listing agent
- What do current leases actually rent for vs. the listed asking? Can we see a recent rent roll and the last 12 months of T-12 income?
- It's been on market 40 days. Have you received any prior offers? Is the seller open to a 14% concession, seller financing, or rate buy-down credit?
- Built in 1954 — when were the roof, HVAC, electrical panel, plumbing, and water heater last replaced?
- Is there a deadline driving the sale (1031 exchange, divorce, estate, relocation)? That informs how much negotiation room exists.
- Schools are D-rated, which usually means shorter tenancies and higher turnover. Who's the typical renter profile here, and what's been the actual vacancy rate?
- Crime grade is D in this area — have there been break-ins, vandalism, or insurance claims at this property in the last 3 years? What carrier currently insures it and at what premium?
- The area grade is low — what's the realistic commute time and amenity access for the typical tenant pool here? Any planned neighborhood developments (good or bad) we should know about?
- What's the average days-on-market for RENTAL listings here right now (not sales)? A rising rental-DOM trend means longer vacancies and softer asking-rent achievability than the comps imply.
- What's the recent tenant-quality profile in this submarket — average credit score on applications, eviction rate, late-payment / NSF rate, and stable-employment percentage? A property-management company in the area should have these aggregated.
- How much new for-sale + rental construction is in the pipeline within 1–3 miles? Heavy new supply typically softens prices + rents 12–24 months out; constrained supply supports both.
Investment metrics
- 1% rule
- 0.86% ✗
- Cap rate
- 5.96%
- Cash-on-cash
- -1.20%
- DSCR
- 0.95
- GRM
- 9.7
CMA / ARV
- ARV (median comp)
- $167,214
- List price
- $164,900
- Delta
- -1.38%
- Verdict
- FAIR
- Comps
- 20 within 1.0 mi
Show comp detail 5 sales within ~0.75 mi
| Address | Dist | Beds/Ba | Sqft | Sold | Price | $/sf | Match |
|---|---|---|---|---|---|---|---|
| 827 S Palmer | 0.03mi | 3/2.0 | 1,279 (+9%) | 17mo | $215,000 | $168 | 68 |
| 2203 Airline Dr | 0.59mi | 3/1.5 | 1,188 (+1%) | 16mo | $148,500 | $125 | 58 |
| 1905 Parklen St | 0.32mi | 3/1.5 | 1,300 (+10%) | 16mo | $219,900 | $169 | 54 |
| 734 Pinkerton | 0.64mi | 3/1.5 | 1,079 (-8%) | 4mo | $195,900 | $182 | 53 |
| 736 Crestway Dr | 0.35mi | 2/1.0 (-1) | 1,015 (-14%) | 4mo | $135,000 | $133 | 51 |
Match score weights: distance 35% · size 25% · config 20% · recency 20%. Top-matched comps best support the ARV.
Projected returns pro-forma
-3.0% appreciation · 2.27% rent growth · sell at horizon
- IRR
- -19.1%
- Equity multiple
- 0.34×
- Total profit
- $-30,667
- Equity at exit
- $24,587
- IRR
- -13.2%
- Equity multiple
- 0.25×
- Total profit
- $-34,532
- Equity at exit
- $14,258
Cash invested: $46,172 (down + closing). Projections, not guarantees.
Landlord ↔ Tenant lean methodology
- Overall (STATE)
- 87 Strongly Landlord-Friendly
- State Texas
- 87 Strongly Landlord-Friendly · R+5
- County
- — inherits STATE
- City
- — inherits STATE
ZIP-level market 75702
- Home prices YoY
- -5.8%
- Rents YoY
- 2.3%
- Active inventory
- 156
- Price-to-rent
- 9.7×
Monthly cashflow live
- Estimated rent
- $1,420 high interval (Pro) →
- Mortgage (P&I)
- −$865
- Tax from tax record
- −$234 /mo · $2,812/yr
- Insurance
- −$69
- HOA
- −$0
- Vacancy / Maint / Mgmt
- −$298
- Net cashflow
- $-46
Break-even live
Sensitivity live
| Price | -10% $47 | -5% $0 | +0% $-46 | +5% $-93 | +10% $-140 |
|---|---|---|---|---|---|
| Rent | -10% $-158 | -5% $-102 | +0% $-46 | +5% $10 | +10% $66 |
| Rate | -1.0pp $37 | -0.5pp $-4 | base $-46 | +0.5pp $-89 | +1.0pp $-133 |
UW: 25.0% down · 7.5% · 30yr · 1.5% tax · 5.0% vac · 8.0% maint · 8.0% mgmt
Financing live
Cash to close
- Down payment
- $41,225
- Closing costs
- $4,947
- Reserves months
- —
- Total cash needed
- —
Loan-product check · same deal, 3 products live
Conventional
25% down · 7.5% · 30yr
- Down + closing
- —
- Monthly P&I
- —
- Monthly cashflow
- —
- DSCR
- —
- Eligible?
- —
Personal DTI + credit; lowest rate.
DSCR
20% down · 8.5% · 30yr
- Down + closing
- —
- Monthly P&I
- —
- Monthly cashflow
- —
- DSCR
- —
- Eligible?
- —
No personal income docs; deal must DSCR.
Hard money
10% down · 12.0% · 12mo
- Down + closing
- —
- Monthly P&I
- —
- Monthly cashflow
- —
- DSCR
- —
- Eligible?
- —
Short-term bridge; refi at stabilization.
Rent comps 26 comps
| Address | Beds | Baths | Sqft | Rent | $/sqft | DOM | Units | Dist |
|---|---|---|---|---|---|---|---|---|
| 1421 E Idel St Tyler, TX | 3.0 | 1.5 | 1080 | $1,300 | $1.20 | 15d | 1 | 0.16mi |
| 1004 S Porter Ave Unit 1004 Tyler, TX | 2.0 | 1.0 | 926 | $1,395 | $1.51 | 45d | 1 | 0.23mi |
| 1729 E Arnold St Tyler, TX | 2.0 | 1.0 | 1074 | $1,295 | $1.21 | 23d | 1 | 0.25mi |
| 2009 E Devine St Tyler, TX | 3.0 | 2.0 | 1200 | $1,600 | $1.33 | 45d | 1 | 0.31mi |
| 613 S Baxter Ave Tyler, TX | 3.0 | 2.0 | 1090 | $1,250 | $1.15 | 23d | 1 | 0.38mi |
| 1313 S Tipton Ave Tyler, TX | 2.0 | 1.0 | 816 | $1,200 | $1.47 | 15d | 1 | 0.45mi |
| 1118 S Fleishel Ave Tyler, TX | 3.0 | 2.0 | 1425 | $1,495 | $1.05 | 15d | 1 | 0.48mi |
| 1421 E Front St Tyler, TX | 2.0 | 1.0 | 965 | $1,125 | $1.17 | 15d | 1 | 0.51mi |
| 1712 Redbud Ave Tyler, TX | 3.0 | 1.5 | 1305 | $1,475 | $1.13 | 23d | 1 | 0.58mi |
| 2332 Pinkerton Dr Tyler, TX | 3.0 | 2.0 | 930 | $1,400 | $1.51 | 45d | 1 | 0.60mi |
| 211 Patricia Ct Tyler, TX | 3.0 | 2.0 | 1314 | $1,795 | $1.37 | 45d | 1 | 0.65mi |
| 2319 Hunter St Tyler, TX | 3.0 | 1.0 | 1200 | $1,225 | $1.02 | 45d | 1 | 0.83mi |
| 420 E Dodge St Tyler, TX | 3.0 | 2.0 | 940 | $950 | $1.01 | 15d | 1 | 0.90mi |
| 311 N Virginia Ave Tyler, TX | 3.0 | 1.0 | 1040 | $1,395 | $1.34 | 23d | 1 | 1.02mi |
| 305 E Lake St Tyler, TX | 2.0 | 1.5 | 1287 | $1,695 | $1.32 | 15d | 1 | 1.03mi |
| 411 N Fuller Ave Tyler, TX | 3.0 | 2.0 | 1246 | $1,850 | $1.48 | 45d | 1 | 1.03mi |
| 132 Rowland Pl Unit b Tyler, TX | 2.0 | 1.0 | 1170 | $1,295 | $1.11 | 23d | 1 | 1.07mi |
| 431 S College Ave Tyler, TX | 2.0 | 1.0 | 1380 | $1,650 | $1.20 | 23d | 1 | 1.33mi |
| 431 S College Ave Tyler, TX | 2.0 | 1.0 | 1380 | $1,750 | $1.27 | 45d | 1 | 1.33mi |
| 328 Mockingbird Ln Tyler, TX | 2.0 | 1.0 | 1200 | $950 | $0.79 | 15d | 1 | 1.37mi |
| 826 Wilma St Tyler, TX | 3.0 | 2.0 | 1210 | $1,800 | $1.49 | 15d | 1 | 1.39mi |
| 425 E Oakwood St Tyler, TX | 3.0 | 2.0 | 1298 | $1,540 | $1.19 | 45d | 1 | 1.39mi |
| 507 W Shaw St Tyler, TX | 2.0 | 1.0 | 1005 | $1,250 | $1.24 | 15d | 1 | 1.43mi |
| 522 W Dobbs St Tyler, TX | 3.0 | 1.0 | 1127 | $1,395 | $1.24 | 15d | 1 | 1.48mi |
| 526 S Bonner Ave Apt 4 Tyler, TX | 2.0 | 1.0 | 1120 | $1,175 | $1.05 | 23d | 1 | 1.49mi |
| 1115 S Robertson Ave Tyler, TX | 2.0 | 1.0 | 1366 | $1,550 | $1.13 | 15d | 1 | 1.49mi |
Listing history 30 events
-
2026-06-22days on market $164,900 Active 40 DOM
-
2026-06-19days on market $164,900 Active 38 DOM
-
2026-06-18days on market $164,900 Active 37 DOM
-
2026-06-17days on market $164,900 Active 36 DOM
-
2026-06-16days on market $164,900 Active 35 DOM
-
2026-06-15days on market $164,900 Active 34 DOM
-
2026-06-14days on market $164,900 Active 32 DOM
-
2026-06-13days on market $164,900 Active 31 DOM
-
2026-06-10days on market $164,900 Active 29 DOM
-
2026-06-09days on market $164,900 Active 28 DOM
-
2026-06-08days on market $164,900 Active 27 DOM
-
2026-06-07days on market $164,900 Active 26 DOM
-
2026-06-05days on market $164,900 Active 23 DOM
-
2026-06-02days on market $164,900 Active 21 DOM
-
2026-06-01days on market $164,900 Active 20 DOM
-
2026-05-31days on market $164,900 Active 19 DOM
-
2026-05-30days on market $164,900 Active 18 DOM
-
2026-05-12$164,900 Active 1126-char remark
Show marketing remark (1126 chars)
This 3-bedroom, 1-bathroom home in Tyler, Texas offers an excellent opportunity for investors or buyers seeking a foreclosure property with strong potential. The residence includes an open attached carport with additional storage space and a garage area with an attached shed or storage closet for added functionality. The home features a practical layout that’s ready for updates, offering a solid foundation for renovation or rental use. Whether you’re looking to fix and flip or expand your rental portfolio, this property presents a compelling option in a sought-after location. Just a short walk from Tyler Junior College and only blocks from both major hospitals, the home is ideally situated for students, healthcare professionals, or future tenants. Its central location, combined with accessible amenities and strong structural bones, make it a worthwhile project for those with vision and a willingness to invest in improvements. Don’t miss the chance to transform this property into a rewarding investment in one of Tyler’s most convenient and high-demand areas. Schedule your showing today.
-
2026-03-18price $164,900
-
2026-03-18price $164,900
-
2025-12-19price $169,900
-
2025-08-20price $179,900
-
2025-07-16price $184,900
-
2025-05-24$169,900 Active
-
2023-08-25soldstatus
-
2023-08-25soldstatus
-
2023-07-24$153,000
-
2014-02-19soldstatus
-
2003-02-28soldstatus
ⓘ Source: listings_history table (triggers on properties + properties_extension) + one-shot
backfill from property_details.listing_events for pre-trigger history.
Tax reassessment forecast TX · Resets to sale price
- Current annual tax
- $2,812 · $234/mo
- Projected year-2 tax
- $3,018 · $251/mo
- Expected delta
- +$205/yr (+$17/mo · 7.3%)
ⓘ Screening estimate from a state-policy table — verify with the county assessor before closing.
Climate risk First Street
- Flood 1/10 Low FEMA zone X (unshaded) · 0% chance over 30 yrs
- Wildfire 1/10 Low
- Heat 7/10 Severe 7 d/yr ≥109°F today · 26 d/yr by 30 yrs out
- Wind 6/10 Major 63% chance of damaging wind over 30 yrs
- Air quality 2/10 Low 0 unhealthy d/yr today · 1 by 30 yrs out
Nearby sold comps map
Loading sold comps map…
Walkable amenities ~0.75 mi
Loading nearby amenities…
Taxation est. · year 1
- Rental income
- $17,036
- − Mortgage interest
- −$9,237
- − Property taxes
- −$2,812
- − Insurance
- −$824
- − Repairs & maintenance
- −$1,363
- − Management
- −$1,363
- − Depreciation
- −$4,797
- Taxable loss
- −$3,361
- Est. tax savings @ 24.0%
- +$807
- After-tax cash flow
- $251/yr
For passive investors: Depreciation is non-cash, so a rental often shows a tax loss while cash-flowing — sheltering income. Rental losses are passive: they offset passive income freely, and up to $25,000/yr can offset ordinary (W-2) income if you actively participate and your MAGI is under $100k (phasing out to $0 by $150k); unused losses carry forward. On sale, claimed depreciation is recaptured at up to 25%, and gains may owe capital-gains tax (a 1031 exchange can defer both). Figures are a year-1 estimate at your 24.0% rate — not tax advice; consult a CPA.
Schools (NCES district)
- District
- Tyler ISD
- NCES district ID
- 4843470
- Math proficiency
- 39% ▼ -4.00%
- Reading proficiency
- 38% ▼ -1.00%
- Median HH income
- $44,090
- Composite
- 32.69/100
- National rank
- #5650
- State rank
- #449 of 826 in TX
Livability — Tyler
- Score
- 75/100
- State rank
- #147
- US rank
- #4181
Category grades
Schools grade is shown separately in the Schools card above.
Census & demographics
- Census place
- Tyler, TX
- County
- Smith County · 180,570 people
- City population
- 127,842
- Metro
- Tyler, TX
- Population (ZIP)
- 27,927
- Household income
- $51,564
- Rent vs Own
- Severe rent burden
- 803.0
Population outlook (Smith County) Hauer SSP2
- Today (2025)
- 248,890 people
- By 2030
- 261,665 · +5.1%
- By 2040
- 286,114 · +15.0%
- By 2050
- 308,006 · +23.8%
- By 2075
- 354,171 · +42.3%
- By 2100
- 372,828 · +49.8%
Race, ethnicity, and origin ACS 2023
- Neighborhood character
- Diverse neighborhood (Simpson 0.61)
- Race & ethnicity
- Hispanic / Latino 49% Black 37% White 12% Two or more races 11% Native American 1%
- Hispanic origin (detail)
- Mexican 47%
- Common ancestry
- Lithuanian 1%
- Foreign-born
- 20% · Canada
- Languages at home
- 56% English-only · Spanish 44%
Political lean MEDSL · Smith
- 2024 margin
- Solid R (+45.1) · D 27.0% · R 72.1%
- 2008→2024 swing
- -5.6pp toward R · 2008: -39.5pp · 2024: -45.1pp
- All cycles
- 2024: R+45.1 2020: R+39.4 2016: R+43.9 2012: R+46.9 2008: R+39.5
Not yet ingested
- Civics
- —
Market trends
- HPI YoY
- ▼ -12.63%
- Current HPI
- 207.1573
- Rent YoY
- ▲ 2.27%
- Metro
- Tyler, TX
- State GDP YoY
- ▲ 3.95%
- F500 in state
- 110
Industry mix (Fortune 500 HQ in TX)
| Industry | F500 HQs | Revenue |
|---|---|---|
| Energy | 16 | $1,198B |
|
||
| Technology | 5 | $198B |
|
||
| Engineering / Construction | 4 | $72B |
|
||
| Energy Services | 3 | $60B |
|
||
| Utilities | 3 | $41B |
|
||
| Healthcare | 2 | $330B |
|
||
Price history
+7.8% since first listed13 events — show timeline
- 2026-05-12 Listed $164,900 GTAR
- 2026-05-12 Listed $164,900 LAAR
- 2026-03-18 Price Changed $164,900 LAAR
- 2026-03-18 Price Changed $164,900 GTAR
- 2025-12-19 Price Changed $169,900 GTAR
- 2025-08-20 Price Changed $179,900 GTAR
- 2025-07-16 Price Changed $184,900 GTAR
- 2025-05-24 Listed $169,900 LAAR
- 2023-08-25 Sold (Public Records) — Public Records
- 2023-08-25 Sold (MLS) — GTAR
- 2023-07-24 Listed $153,000 GTAR
- 2014-02-19 Sold (Public Records) — Public Records
- 2003-02-28 Sold (Public Records) — Public Records
Property tax history
+5.9%/yrLatest (2024): $2,812 · +21.7% YoY. Source: county tax records.
Cash-flow waterfall
monthlySold comps — $/sqft
last 12 mo · ≤1 miLoading sold comps…