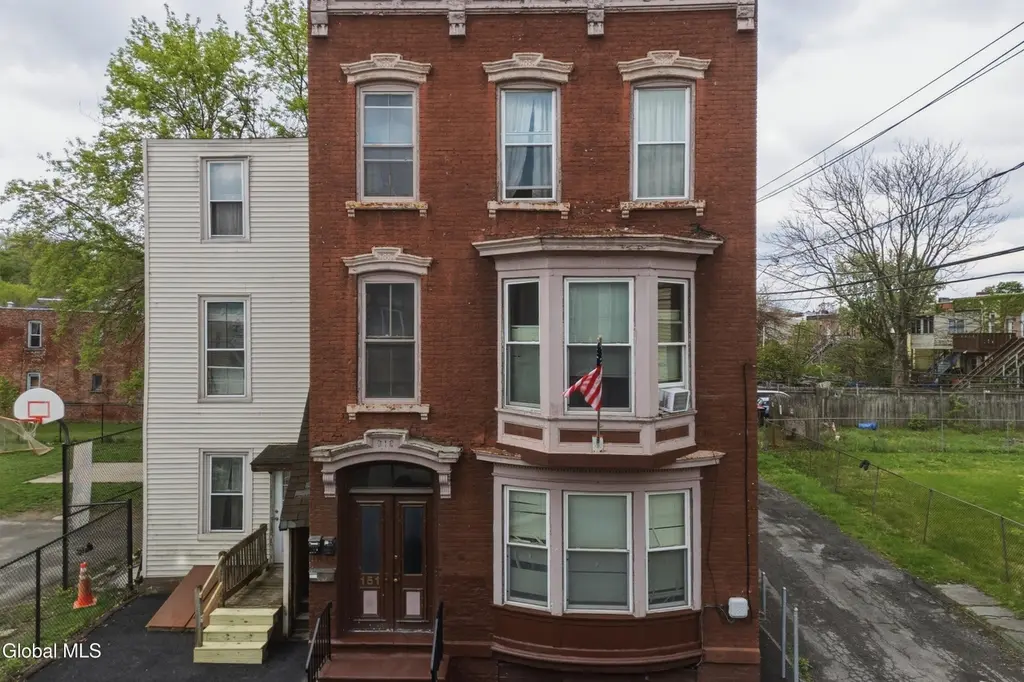
 Triplex
151 Jackson St · Troy, NY
Flood risk 10/10 · Severe
- FEMA flood zone
- AE
- Chance of flooding over 30 yrs
- 0.99%
- Est. flood insurance / yr
- $2,026 – $9,024
Fire risk 1/10 · Minimal
- Est. fire insurance / yr
- $691 – $1,283
Heat risk 4/10 · Minor
- Hot days now (above 96°F)
- 7 days/yr
- Hot days in 30 yrs
- 16 days/yr
Wind risk 3/10 · Minor
- Chance of severe wind over 30 yrs
- 6.0%
Air-quality risk 2/10 · Minimal
- Unhealthy air days now
- 0 days/yr
- Unhealthy air days in 30 yrs
- 1 days/yr
Risk factors via First Street. Map © Google.
Why this score? — see what drove the B grade
The composite is a weighted blend of 9 inputs, each scored 0–100. Each bar is that input's sub-score; the figure is the points it added to the 100-point composite (weight × sub-score).
- Cash flow +30.0/30.0
- ARV discount +11.6/15.0
- DSCR +10.0/10.0
- 1% rule +9.1/10.0
- Livability +4.0/5.0
- Schools +3.8/10.0
- Rent growth +3.7/5.0
- Condition / age +2.5/5.0
- Appreciation +0.0/10.0
$340,000
🖨 Deal sheet 📄 Offer letter ✓ Due diligence
Multi-family units
County records classify this as Multi-Family (2-4 Unit). Listing-text estimate: 3 units. confirmed
Listing remarks
Large brick 3-unit property in Troy featuring spacious layouts and separate utilities. This free-standing building located next to a Hope Park offers an excellent opportunity for investors or owner-occupants looking to build equity in a well maintained property. Each unit includes in-unit laundry for added convenience. Ideally located near downtown Troy, RPI, shopping, and major transportation routes.
Key facts
- 2,613 sq ft lot
- Built 1890
- Listed 44 days
Property features AI
Finance
- Financial info: Three-unit property; Tenants pay hot water, electricity, and gas; Owner pays water and sewer
Exterior
- Utilities: Public water; Public sewer
- Home design: Triplex; Brick and vinyl siding exterior; Mid-block location (see directions)
- Construction: Brick and vinyl siding construction; Brick/mortar foundation; Rubber roof
- Exterior features: Deck; Back yard with fencing; Level lot
Interior
- Bedrooms: Unit 1: three bedrooms (all on the 1st floor); Unit 2: two bedrooms (on the 2nd floor); Unit 3: one bedroom (on the 3rd floor)
- Flooring: Carpet; Laminate
- Bathrooms: Three full bathrooms total — one on each floor (1st, 2nd, 3rd)
- Heating & cooling: Heating present: electric, natural gas, and space heaters
- Interior features: Carpet and laminate flooring
- Laundry & utility: Laundry closet
Neighborhood map
What this means for you Summary
Snapshot
- This is a 3 × 2-bed/1.0-bath units multifamily listed at $340k.
Deal economics
- At list price, monthly cash flow is $1k ($13k/yr) — positive. Per door: $350/mo.
- The deal already cash-flows at list — no discount required.
- Meets the 1% rule at list price ($5k rent vs $340k).
- Recommended offer: $330k (3.0% below list) — sets the bar for market timing.
- Cap rate 11.6% vs local median 5.3% in Troy — top-decile yield for the area; either an underpriced asset or a hidden risk that comps aren't pricing in. Stress-test before assuming the spread holds.
Location & tenants
- Location reads 81/100 on livability (#88 in NY, #1,350 nationally) — a professional / high-income tenant draw. Strengths: amenities A+, commute A+, housing A+; Watch: schools C-, employment C-, crime F.
- Troy City School District (urban): math 44% / reading 46% proficiency, ranked #467 of 590 in NY (top 79%) — families likely to look elsewhere, expect single-tenant / working-renter base with shorter leases; 62% free/reduced lunch — lower-income household profile, screen leases tightly.
- Market conditions: Rents rising fast (+4.9%/yr); 220 active listings in the ZIP; 3 comparable units currently listed for rent nearby; rentals at typical pace (median 19d on market — plan ~3-4 weeks tenant-placement turnaround); solid renter incomes; 405 units permitted in Rensselaer County in 2024 (224 in 5+ unit buildings).
- At $4,801/mo this rent would consume 76% of the median local household income ($76k/yr) (locally 2698% of renters already pay >50% of income on rent) — very limited rent-growth headroom before tenants either downsize or default.
Forward outlook
- Local home prices are declining (-3.0%/yr); year-one equity from $2k of loan paydown is wiped out by about $10k of value loss. Plan a longer hold.
- Rensselaer County population projected to shrink 6% by 2050 — rents likely to lag national; underwrite the cash flow, not the appreciation.
- At projected returns (-3.0% appreciation + 4.9% rent growth), your $95k cash investment doubles in ~8 years — after that, you're playing with house money.
Negotiation context
- It's been on market 44 days — a 3% lower offer ($330k) is reasonable based on typical stale-listing flexibility.
- Current owner paid $85k; list at $340k implies a 300% gain — meaningful room to come down on a strong offer.
Risks & watch-outs
- Watch-outs: flood insurance adds $460/mo; built in 1890 — expect roof / HVAC / electrical / plumbing capex.
- Climate carrying-cost: in FEMA flood zone AE (mandatory federal flood insurance) — expect insurance premiums to compound above CPI over the hold.
Questions for the listing agent
- It's been on market 44 days. Have you received any prior offers? Is the seller open to a 3% concession, seller financing, or rate buy-down credit?
- Can we see the unit-by-unit rent roll, current vacancy, and any below-market leases? What's the average tenancy length?
- What capital expenditures (roof, boiler, parking lot, exteriors) have been made in the last 5 years, and what's planned in the next 2?
- Built in 1890 — when were the roof, HVAC, electrical panel, plumbing, and water heater last replaced?
- What's the actual annual flood-insurance premium (NFIP or private), and is the property in a SFHA with mandatory coverage?
- Is there a deadline driving the sale (1031 exchange, divorce, estate, relocation)? That informs how much negotiation room exists.
- Crime grade is F in this area — have there been break-ins, vandalism, or insurance claims at this property in the last 3 years? What carrier currently insures it and at what premium?
- What's the average days-on-market for RENTAL listings here right now (not sales)? A rising rental-DOM trend means longer vacancies and softer asking-rent achievability than the comps imply.
- What's the recent tenant-quality profile in this submarket — average credit score on applications, eviction rate, late-payment / NSF rate, and stable-employment percentage? A property-management company in the area should have these aggregated.
- How much new apartment / multifamily construction is in the pipeline within 1–3 miles? Heavy new supply (>2% of stock underway) typically softens rents 12–24 months out; light construction supports rent growth.
Investment metrics
- 1% rule
- 1.41% ✓
- Cap rate
- 11.62%
- Cash-on-cash
- 19.03%
- DSCR
- 1.85
- GRM
- 5.9
CMA / ARV
- ARV (median comp)
- $374,133
- List price
- $340,000
- Delta
- -9.12%
- Verdict
- FAIR
- Comps
- 20 within 1.0 mi
Show comp detail 12 sales within ~0.75 mi
| Address | Dist | Beds/Ba | Sqft | Sold | Price | $/sf | Match |
|---|---|---|---|---|---|---|---|
| 96 Hanover St | 0.17mi | 6/3.0 (+1) | 2,768 (-5%) | 4mo | $160,000 | $58 | 75 |
| 325 1st St | 0.17mi | 5/2.0 | 2,726 (-7%) | 14mo | $240,000 | $88 | 66 |
| 327 4th St | 0.42mi | 5/2.0 | 2,720 (-7%) | 4mo | $215,000 | $79 | 61 |
| 277 4th St | 0.54mi | 4/3.0 (-1) | 2,720 (-7%) | 3mo | $240,000 | $88 | 56 |
| 362 3rd St | 0.21mi | 6/2.0 (+1) | 2,666 (-9%) | 16mo | $173,000 | $65 | 54 |
| 157 1st St | 0.63mi | 4/3.0 (-1) | 3,044 (+4%) | 10mo | $310,000 | $102 | 50 |
| 204 13th St | 0.68mi | 6/3.0 (+1) | 2,794 (-4%) | 8mo | $289,900 | $104 | 50 |
| 544 1st St | 0.42mi | 5/4.0 | 2,551 (-13%) | 14mo | $370,000 | $145 | 44 |
| 153 2nd St | 0.72mi | 5/2.0 | 2,640 (-10%) | 7mo | $350,000 | $133 | 41 |
| 1266 5th Ave | 0.66mi | 6/2.0 (+1) | 2,540 (-13%) | 1mo | $240,000 | $94 | 38 |
| 711 3rd Ave | 0.54mi | 4/2.5 (-1) | 3,252 (+11%) | 17mo | $298,000 | $92 | 34 |
| 536 3rd Ave | 0.64mi | 5/4.0 | 3,214 (+10%) | 18mo | $315,000 | $98 | 34 |
Match score weights: distance 35% · size 25% · config 20% · recency 20%. Top-matched comps best support the ARV.
Projected returns pro-forma
-3.0% appreciation · 4.88% rent growth · sell at horizon
- IRR
- 5.6%
- Equity multiple
- 1.22×
- Total profit
- $21,311
- Equity at exit
- $50,695
- IRR
- 16.9%
- Equity multiple
- 2.53×
- Total profit
- $145,352
- Equity at exit
- $29,397
Cash invested: $95,200 (down + closing). Projections, not guarantees.
Landlord ↔ Tenant lean methodology
- Overall (STATE)
- 15 Strongly Tenant-Friendly
- State New York
- 15 Strongly Tenant-Friendly · D+10
- County
- — inherits STATE
- City
- — inherits STATE
ZIP-level market 12180
- Home prices YoY
- -33.3%
- Rents YoY
- 4.9%
- Active inventory
- 220
- Price-to-rent
- 17.7×
Monthly cashflow live
- Estimated rent
- $4,801 high interval (Pro) →
- Mortgage (P&I)
- −$1,783
- Tax from tax record
- −$358 /mo · $4,299/yr
- Insurance
- −$142
- Flood insurance flood zone
- −$460 /mo · $5,525/yr
- HOA
- −$0
- Vacancy / Maint / Mgmt
- −$1,008
- Net cashflow
- $1,049
Break-even live
3-unit breakdown (identical units grouped — click to expand)
| Units | Beds | Baths | Est. rent |
|---|---|---|---|
| 3× units | 2 | 1 | $4,800 |
| #1 | 2 | 1 | $1,600 |
| #2 | 2 | 1 | $1,600 |
| #3 | 2 | 1 | $1,600 |
| Total (3 units) | $4,801 | ||
UW: 25.0% down · 7.5% · 30yr · 1.5% tax · 5.0% vac · 8.0% maint · 8.0% mgmt
Financing live
Cash to close
- Down payment
- $85,000
- Closing costs
- $10,200
- Reserves months
- —
- Total cash needed
- —
Loan-product check · same deal, 3 products live
Conventional
25% down · 7.5% · 30yr
- Down + closing
- —
- Monthly P&I
- —
- Monthly cashflow
- —
- DSCR
- —
- Eligible?
- —
Personal DTI + credit; lowest rate.
DSCR
20% down · 8.5% · 30yr
- Down + closing
- —
- Monthly P&I
- —
- Monthly cashflow
- —
- DSCR
- —
- Eligible?
- —
No personal income docs; deal must DSCR.
Hard money
10% down · 12.0% · 12mo
- Down + closing
- —
- Monthly P&I
- —
- Monthly cashflow
- —
- DSCR
- —
- Eligible?
- —
Short-term bridge; refi at stabilization.
Rent comps 3 comps
| Address | Beds | Baths | Sqft | Rent | $/sqft | DOM | Units | Dist |
|---|---|---|---|---|---|---|---|---|
| 150 2nd St Troy, NY | 4.0 | 1.5 | 2442 | $3,000 | $1.23 | 21d | 1 | 0.71mi |
| 17 State St Troy, NY | 4.0 | 1.0–1.5 | 1810 | $3,635 | $2.01 | 14d | 7 | 1.01mi |
| 51 14th St Unit 2 Troy, NY | 4.0 | 2.0 | 2000 | $725 | $0.36 | 19d | 1 | 1.03mi |
Listing history 17 events
-
2026-06-18days on market $340,000 Active 44 DOM
-
2026-06-17days on market $340,000 Active 43 DOM
-
2026-06-16days on market $340,000 Active 42 DOM
-
2026-06-15days on market $340,000 Active 41 DOM
-
2026-06-14days on market $340,000 Active 39 DOM
-
2026-06-13days on market $340,000 Active 38 DOM
-
2026-06-10days on market $340,000 Active 36 DOM
-
2026-06-09days on market $340,000 Active 35 DOM
-
2026-06-08days on market $340,000 Active 34 DOM
-
2026-06-07days on market $340,000 Active 33 DOM
-
2026-06-03days on market $340,000 Active 29 DOM
-
2026-06-02days on market $340,000 Active 28 DOM
-
2026-06-01days on market $340,000 Active 27 DOM
-
2026-05-31days on market $340,000 Active 26 DOM
-
2026-05-31days on market $340,000 Active 25 DOM
-
2026-05-05$340,000 Active 404-char remark
-
2005-08-16soldstatus $85,000
ⓘ Source: listings_history table (triggers on properties + properties_extension) + one-shot
backfill from property_details.listing_events for pre-trigger history.
Tax reassessment forecast NY · Partial reset (capped growth)
- Current annual tax
- $4,299 · $358/mo
- Projected year-2 tax
- $5,023 · $419/mo
- Expected delta
- +$723/yr (+$60/mo · 16.8%)
ⓘ Screening estimate from a state-policy table — verify with the county assessor before closing.
Climate risk First Street
- Flood 10/10 Extreme FEMA zone AE · 99% chance over 30 yrs
- Wildfire 1/10 Low
- Heat 4/10 Moderate 7 d/yr ≥96°F today · 16 d/yr by 30 yrs out
- Wind 3/10 Moderate 6% chance of damaging wind over 30 yrs
- Air quality 2/10 Low 0 unhealthy d/yr today · 1 by 30 yrs out
Nearby sold comps map
Loading sold comps map…
Walkable amenities ~0.75 mi
Loading nearby amenities…
Taxation est. · year 1
- Rental income
- $57,612
- − Mortgage interest
- −$19,045
- − Property taxes
- −$4,299
- − Insurance
- −$7,225
- − Repairs & maintenance
- −$4,609
- − Management
- −$4,609
- − Depreciation
- −$9,891
- Taxable income
- $7,934
- Est. tax owed @ 24.0%
- −$1,904
- After-tax cash flow
- $10,689/yr
For passive investors: Depreciation is non-cash, so a rental often shows a tax loss while cash-flowing — sheltering income. Rental losses are passive: they offset passive income freely, and up to $25,000/yr can offset ordinary (W-2) income if you actively participate and your MAGI is under $100k (phasing out to $0 by $150k); unused losses carry forward. On sale, claimed depreciation is recaptured at up to 25%, and gains may owe capital-gains tax (a 1031 exchange can defer both). Figures are a year-1 estimate at your 24.0% rate — not tax advice; consult a CPA.
Schools (NCES district)
- District
- Troy City School District
- NCES district ID
- 3628950
- Math proficiency
- 44% ▲ 6.00%
- Reading proficiency
- 46% ▲ 6.00%
- Median HH income
- $42,143
- Composite
- 37.89/100
- National rank
- #4318
- State rank
- #467 of 590 in NY
Livability — Troy
- Score
- 81/100
- State rank
- #88
- US rank
- #1350
Category grades
Schools grade is shown separately in the Schools card above.
Census & demographics
- Census place
- Troy, NY
- County
- Rensselaer County · 75,590 people
- City population
- 53,479
- Metro
- Albany-Schenectady-Troy, NY
- Population (ZIP)
- 53,479
- Household income
- $75,851
- Rent vs Own
- Severe rent burden
- 2698.0
Population outlook (Rensselaer County) Hauer SSP2
- Today (2025)
- 162,400 people
- By 2030
- 161,746 · -0.4%
- By 2040
- 158,095 · -2.7%
- By 2050
- 152,966 · -5.8%
- By 2075
- 140,767 · -13.3%
- By 2100
- 124,727 · -23.2%
Race, ethnicity, and origin ACS 2023
- Neighborhood character
- Predominantly White (70%)
- Race & ethnicity
- White 70% Black 12% Hispanic / Latino 8% Two or more races 8% Asian 5%
- Hispanic origin (detail)
- Mexican 1% Puerto Rican 4%
- Common ancestry
- Romanian 5% Lithuanian 5% Slovak 1%
- Foreign-born
- 10% · Canada, China
- Languages at home
- 88% English-only · Spanish 4% Other Indo-European 2% Arabic 2%
Political lean MEDSL · Rensselaer
- 2024 margin
- Toss-up / Even · D 50.7% · R 49.3%
- 2008→2024 swing
- -8.0pp toward R · 2008: 9.3pp · 2024: 1.4pp
- All cycles
- 2024: D+1.4 2020: D+5.6 2016: R+2.9 2012: D+11.8 2008: D+9.3
Not yet ingested
- Civics
- —
Market trends
- HPI YoY
- ▼ -142.53%
- Current HPI
- 285.0762
- Rent YoY
- ▲ 4.88%
- Metro
- Albany-Schenectady-Troy, NY
- State GDP YoY
- ▲ 2.60%
- F500 in state
- 92
Industry mix (Fortune 500 HQ in NY)
| Industry | F500 HQs | Revenue |
|---|---|---|
| Financial Services | 10 | $950B |
|
||
| Consumer Goods | 9 | $162B |
|
||
| Insurance | 4 | $225B |
|
||
| Telecommunications | 2 | $144B |
|
||
| Pharmaceuticals | 2 | $112B |
|
||
| Media / Entertainment | 2 | $69B |
|
||
Price history
+300.0% since first listed2 events — show timeline
- 2026-05-05 Listed $340,000 Global MLS
- 2005-08-16 Sold (Public Records) $85,000 Public Records
Property tax history
+12.8%/yrLatest (2025): $4,299 · +2.3% YoY. Source: county tax records.
Cash-flow waterfall
monthlySold comps — $/sqft
last 12 mo · ≤1 miLoading sold comps…