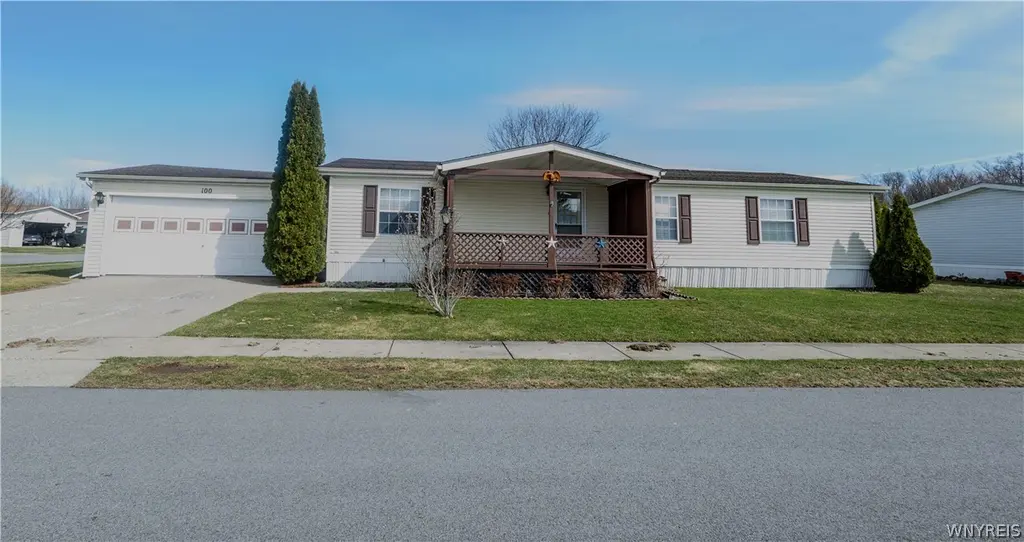
100 Golden Pond Est Blvd · Akron, NY
Flood risk 1/10 · Minimal
- FEMA flood zone
- X (unshaded)
- Chance of flooding over 30 yrs
- 0.0%
- Est. flood insurance / yr
- $507 – $1,088
Fire risk 4/10 · Minor
- Est. fire insurance / yr
- $691 – $1,283
Heat risk 3/10 · Minor
- Hot days now (above 94°F)
- 7 days/yr
- Hot days in 30 yrs
- 16 days/yr
Wind risk 1/10 · Minimal
- Chance of severe wind over 30 yrs
- —
Air-quality risk 2/10 · Minimal
- Unhealthy air days now
- 1 days/yr
- Unhealthy air days in 30 yrs
- 2 days/yr
Risk factors via First Street. Map © Google.
Why this score? — see what drove the B+ grade
The composite is a weighted blend of 9 inputs, each scored 0–100. Each bar is that input's sub-score; the figure is the points it added to the 100-point composite (weight × sub-score).
- Cash flow +30.0/30.0
- ARV discount +12.1/15.0
- 1% rule +10.0/10.0
- DSCR +10.0/10.0
- Schools +4.9/10.0
- Livability +3.7/5.0
- Rent growth +2.5/5.0
- Condition / age +2.5/5.0
- Appreciation +0.0/10.0
$69,000
🖨 Deal sheet 📄 Offer letter ✓ Due diligence
Listing remarks MLS
This very affordable, 3 bed, 2 bath home in desirable Golden Pond Estates has huge closets and very spacious rooms. Very clean and well maintained. Huge soaking tub in master bath. Large 2 car attached garage (with ramp). Come take a look!
Key facts
- 4,356 sq ft lot
- 2 garage spots
- Built 1994
Neighborhood map
What this means for you Summary
Snapshot
- This is a 3-bed/2.0-bath manufactured listed at $69k.
Deal economics
- At list price, monthly cash flow is $554 ($7k/yr) — positive.
- The deal already cash-flows at list — no discount required.
- Meets the 1% rule at list price ($1k rent vs $69k).
- Recommended offer: $68k (1.5% below list) — sets the bar for market timing.
- Cap rate 15.9% vs local median 2.4% in Akron — top-decile yield for the area; either an underpriced asset or a hidden risk that comps aren't pricing in. Stress-test before assuming the spread holds.
Location & tenants
- Location reads 74/100 on livability (#297 in NY, #4,809 nationally) — a middle-class / working-renter tenant base. Strengths: housing A+, health & safety A+, schools A; Watch: employment D+, amenities F, commute F.
- Akron Central School District (town): math 56% / reading 58% proficiency, ranked #272 of 590 in NY (top 46%) — acceptable for families but not a draw, mixed tenant base, ~2y average lease.
- Market conditions: 85 active listings in the ZIP; 1,244 units permitted in Erie County in 2024 (563 in 5+ unit buildings).
Forward outlook
- Local home prices are declining (-3.0%/yr); year-one equity from $477 of loan paydown is wiped out by about $2k of value loss. Plan a longer hold.
- At projected returns (-3.0% appreciation + 3.0% rent growth), your $19k cash investment doubles in ~4 years — after that, you're playing with house money.
Negotiation context
- It's been on market 19 days — a 2% lower offer ($68k) is reasonable based on typical stale-listing flexibility.
- 2 sale attempts since 13y ago with the ask held roughly flat each time — persistent listings suggest the price (not the market) is what's stuck; bring a comps-based counter.
- Current owner paid $35k; list at $69k implies a 97% gain — meaningful room to come down on a strong offer.
Questions for the listing agent
- Is there a deadline driving the sale (1031 exchange, divorce, estate, relocation)? That informs how much negotiation room exists.
- Schools are A-rated — typically a magnet for longer-tenancy family renters. What's the average tenant stay here, and is there a school-zone premium baked into asking?
- What's the average days-on-market for RENTAL listings here right now (not sales)? A rising rental-DOM trend means longer vacancies and softer asking-rent achievability than the comps imply.
- What's the recent tenant-quality profile in this submarket — average credit score on applications, eviction rate, late-payment / NSF rate, and stable-employment percentage? A property-management company in the area should have these aggregated.
- How much new for-sale + rental construction is in the pipeline within 1–3 miles? Heavy new supply typically softens prices + rents 12–24 months out; constrained supply supports both.
Investment metrics
- 1% rule
- 1.76% ✓
- Cap rate
- 15.93%
- Cash-on-cash
- 34.40%
- DSCR
- 2.53
- GRM
- 4.7
CMA / ARV
- ARV (on-the-fly)
- $76,908
- Comps found
- 10
Show comp detail 10 sales within ~0.75 mi
| Address | Dist | Beds/Ba | Sqft | Sold | Price | $/sf | Match |
|---|---|---|---|---|---|---|---|
| 100 Golden Pond Est Blvd | 0.00mi | 3/2.0 | 1,326 (0%) | 1mo | $57,000 | $43 | 99 |
| 79 Golden Pond | 0.00mi | 3/2.0 | 1,326 (0%) | 3mo | $94,900 | $72 | 98 |
| 71 Golden Pond | 0.01mi | 3/2.0 | 1,404 (+6%) | 12mo | $75,000 | $53 | 80 |
| 165 Golden Pond | 0.00mi | 2/2.0 (-1) | 1,372 (+4%) | 15mo | $79,900 | $58 | 77 |
| 62 Golden Pond Pkwy | 0.29mi | 3/2.0 | 1,352 (+2%) | 16mo | $70,000 | $52 | 70 |
| 20 Golden Pond | 0.30mi | 3/2.0 | 1,213 (-8%) | 2mo | $52,000 | $43 | 70 |
| 179 Golden Pond | 0.24mi | 3/2.0 | 1,456 (+10%) | 7mo | $85,000 | $58 | 67 |
| 215 Golden Pond | 0.21mi | 3/2.0 | 1,485 (+12%) | 10mo | $108,000 | $73 | 62 |
| 44 Belmont Rd | 0.05mi | 2/1.5 (-1) | 1,230 (-7%) | 21mo | $82,900 | $67 | 61 |
| 44 Golden Pond | 0.29mi | 2/1.5 (-1) | 1,188 (-10%) | 14mo | $90,000 | $76 | 51 |
Match score weights: distance 35% · size 25% · config 20% · recency 20%. Top-matched comps best support the ARV.
Projected returns pro-forma
-3.0% appreciation · 3.0% rent growth · sell at horizon
- IRR
- 29.8%
- Equity multiple
- 2.25×
- Total profit
- $24,068
- Equity at exit
- $10,288
- IRR
- 37.1%
- Equity multiple
- 4.43×
- Total profit
- $66,271
- Equity at exit
- $5,966
Cash invested: $19,320 (down + closing). Projections, not guarantees.
Landlord ↔ Tenant lean methodology
- Overall (STATE)
- 15 Strongly Tenant-Friendly
- State New York
- 15 Strongly Tenant-Friendly · D+10
- County
- — inherits STATE
- City
- — inherits STATE
ZIP-level market 14001
- Home prices YoY
- -7.1%
- Active inventory
- 85
- Price-to-rent
- 4.7×
Monthly cashflow live
- Estimated rent
- $1,211 medium interval (Pro) →
- Mortgage (P&I)
- −$362
- Tax from tax record
- −$12 /mo · $147/yr
- Insurance
- −$29
- HOA
- −$0
- Vacancy / Maint / Mgmt
- −$254
- Net cashflow
- $554
Break-even live
UW: 25.0% down · 7.5% · 30yr · 1.5% tax · 5.0% vac · 8.0% maint · 8.0% mgmt
Financing live
Cash to close
- Down payment
- $17,250
- Closing costs
- $2,070
- Reserves months
- —
- Total cash needed
- —
Loan-product check · same deal, 3 products live
Conventional
25% down · 7.5% · 30yr
- Down + closing
- —
- Monthly P&I
- —
- Monthly cashflow
- —
- DSCR
- —
- Eligible?
- —
Personal DTI + credit; lowest rate.
DSCR
20% down · 8.5% · 30yr
- Down + closing
- —
- Monthly P&I
- —
- Monthly cashflow
- —
- DSCR
- —
- Eligible?
- —
No personal income docs; deal must DSCR.
Hard money
10% down · 12.0% · 12mo
- Down + closing
- —
- Monthly P&I
- —
- Monthly cashflow
- —
- DSCR
- —
- Eligible?
- —
Short-term bridge; refi at stabilization.
Listing history 4 events
-
2026-04-15status Pending
-
2026-03-26$69,000 Active
-
2013-08-10soldstatus $35,000 239-char remark
Show marketing remark (239 chars)
This very affordable, 3 bed, 2 bath home in desirable Golden Pond Estates has huge closets and very spacious rooms. Very clean and well maintained. Huge soaking tub in master bath. Large 2 car attached garage (with ramp). Come take a look!
-
2013-06-29$40,000 239-char remark
Show marketing remark (239 chars)
This very affordable, 3 bed, 2 bath home in desirable Golden Pond Estates has huge closets and very spacious rooms. Very clean and well maintained. Huge soaking tub in master bath. Large 2 car attached garage (with ramp). Come take a look!
ⓘ Source: listings_history table (triggers on properties + properties_extension) + one-shot
backfill from property_details.listing_events for pre-trigger history.
Tax reassessment forecast NY · Partial reset (capped growth)
- Current annual tax
- $147 · $12/mo
- Projected year-2 tax
- $657 · $55/mo
- Expected delta
- +$509/yr (+$42/mo · 345.8%)
ⓘ Screening estimate from a state-policy table — verify with the county assessor before closing.
Climate risk First Street
- Flood 1/10 Low FEMA zone X (unshaded) · 0% chance over 30 yrs
- Wildfire 4/10 Moderate
- Heat 3/10 Moderate 7 d/yr ≥94°F today · 16 d/yr by 30 yrs out
- Wind 1/10 Low
- Air quality 2/10 Low 1 unhealthy d/yr today · 2 by 30 yrs out
Nearby sold comps map
Loading sold comps map…
Walkable amenities ~0.75 mi
Loading nearby amenities…
Taxation est. · year 1
- Rental income
- $14,533
- − Mortgage interest
- −$3,865
- − Property taxes
- −$147
- − Insurance
- −$345
- − Repairs & maintenance
- −$1,163
- − Management
- −$1,163
- − Depreciation
- −$2,007
- Taxable income
- $5,843
- Est. tax owed @ 24.0%
- −$1,402
- After-tax cash flow
- $5,244/yr
For passive investors: Depreciation is non-cash, so a rental often shows a tax loss while cash-flowing — sheltering income. Rental losses are passive: they offset passive income freely, and up to $25,000/yr can offset ordinary (W-2) income if you actively participate and your MAGI is under $100k (phasing out to $0 by $150k); unused losses carry forward. On sale, claimed depreciation is recaptured at up to 25%, and gains may owe capital-gains tax (a 1031 exchange can defer both). Figures are a year-1 estimate at your 24.0% rate — not tax advice; consult a CPA.
Schools (NCES district)
- District
- Akron Central School District
- NCES district ID
- 3602430
- Math proficiency
- 56% ▼ -13.00%
- Reading proficiency
- 58% ▼ -1.00%
- Median HH income
- $56,769
- Composite
- 49.23/100
- National rank
- #2035
- State rank
- #272 of 590 in NY
Livability — Akron
- Score
- 74/100
- State rank
- #297
- US rank
- #4809
Category grades
Schools grade is shown separately in the Schools card above.
Census & demographics
- Population (ZIP)
- 9,122
Population outlook (Erie County) Hauer SSP2
- Today (2025)
- 933,037 people
- By 2030
- 935,181 · +0.2%
- By 2040
- 928,531 · -0.5%
- By 2050
- 905,725 · -2.9%
- By 2075
- 834,037 · -10.6%
- By 2100
- 708,033 · -24.1%
Race, ethnicity, and origin ACS 2023
- Neighborhood character
- Predominantly White (91%)
- Race & ethnicity
- White 91% Hispanic / Latino 5% Two or more races 4%
- Hispanic origin (detail)
- Mexican 1% Puerto Rican 2% Dominican 2%
- Common ancestry
- Romanian 21% Slovak 3% Lithuanian 2%
- Foreign-born
- 2% · Canada
- Languages at home
- 97% English-only · Spanish 2%
Political lean MEDSL · Erie
- 2024 margin
- Lean D (+9.7) · D 54.8% · R 45.2%
- 2008→2024 swing
- -7.9pp toward R · 2008: 17.5pp · 2024: 9.7pp
- All cycles
- 2024: D+9.7 2020: D+14.7 2016: D+4.8 2012: D+15.6 2008: D+17.5
Not yet ingested
- Civics
- —
Market trends
- HPI YoY
- ▼ -24.68%
- Current HPI
- 322.1897
- Rent YoY
- —
- Metro
- —
- State GDP YoY
- ▲ 2.60%
- F500 in state
- 92
Industry mix (Fortune 500 HQ in NY)
| Industry | F500 HQs | Revenue |
|---|---|---|
| Financial Services | 10 | $950B |
|
||
| Consumer Goods | 9 | $162B |
|
||
| Insurance | 4 | $225B |
|
||
| Telecommunications | 2 | $144B |
|
||
| Pharmaceuticals | 2 | $112B |
|
||
| Media / Entertainment | 2 | $69B |
|
||
Price history
+72.5% since first listed4 events — show timeline
- 2026-04-15 Pending — WNYREIS
- 2026-03-26 Listed $69,000 WNYREIS
- 2013-08-10 Sold (MLS) $35,000 WNYREIS
- 2013-06-29 Listed $40,000 WNYREIS
Property tax history
-2.8%/yrLatest (2025): $147 · +0.0% YoY. Source: county tax records.
Cash-flow waterfall
monthlySold comps — $/sqft
last 12 mo · ≤1 miLoading sold comps…