 🏗️ New Construction
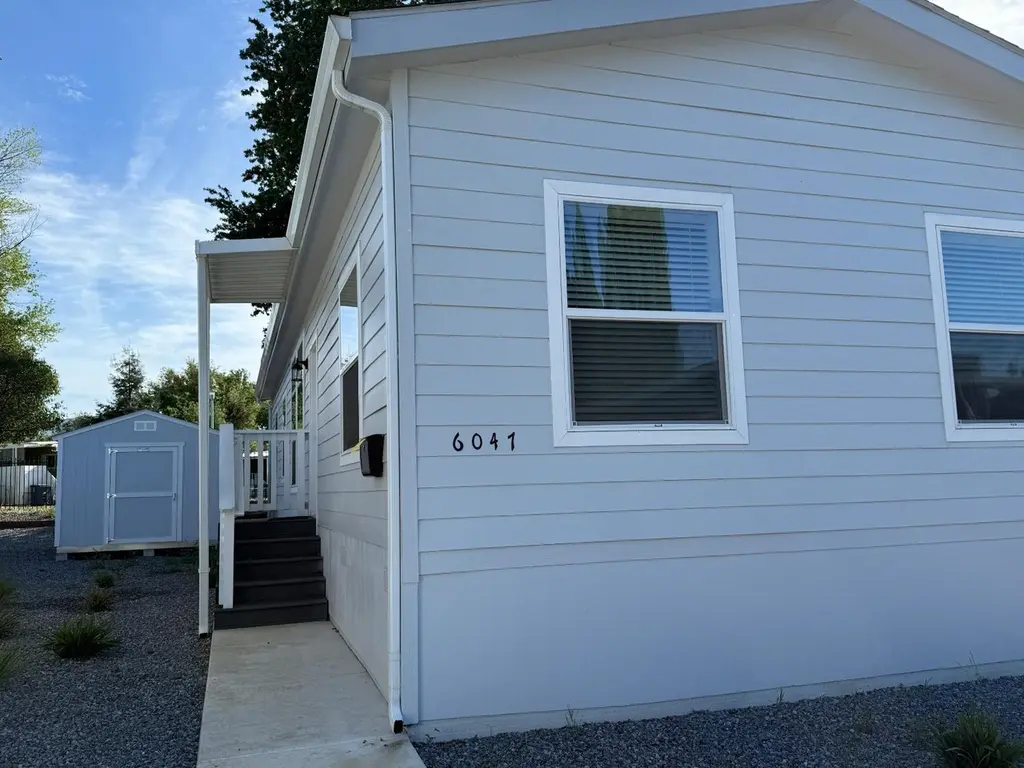
6047 Declaration Cir · Citrus Heights, CA
Flood risk 5/10 · Moderate
- FEMA flood zone
- X (unshaded)
- Chance of flooding over 30 yrs
- 0.32%
- Est. flood insurance / yr
- $507 – $1,088
Fire risk 1/10 · Minimal
- Est. fire insurance / yr
- $659 – $1,223
Heat risk 7/10 · Major
- Hot days now (above 102°F)
- 7 days/yr
- Hot days in 30 yrs
- 16 days/yr
Wind risk 1/10 · Minimal
- Chance of severe wind over 30 yrs
- —
Air-quality risk 10/10 · Severe
- Unhealthy air days now
- 34 days/yr
- Unhealthy air days in 30 yrs
- 36 days/yr
Risk factors via First Street. Map © Google.
Why this score? — see what drove the B grade
The composite is a weighted blend of 9 inputs, each scored 0–100. Each bar is that input's sub-score; the figure is the points it added to the 100-point composite (weight × sub-score).
- Cash flow +30.0/30.0
- 1% rule +10.0/10.0
- DSCR +10.0/10.0
- ARV discount +7.5/15.0
- Schools +4.4/10.0
- Rent growth +3.0/5.0
- Livability +3.0/5.0
- Condition / age +2.5/5.0
- Appreciation +0.0/10.0
$199,900
🖨 Deal sheet 📄 Offer letter ✓ Due diligence
Listing remarks
BRAND NEW EVERYTHING. Be the original owner of this beautiful three bedroom home. Light open modern. Top of the line appliances and plenty of room for a beautiful garden in the extra large lot. Located in Creekside estates a desirable park close to everything: Golf, Healthcare, shopping, restaurants, and activities. WELCOME HOME
Key facts
- Close to everything
- Beautiful garden
- Extra large lot
Tags
Property features AI
Finance
- Other: Property located at 6047 Decloration Cir, Citrus Heights, CA 95621; Directions: I80 to Greenback Lane; turn right on Plymouth Rock into the park; Declaration Circle is first left; home is just around the bend.
- Financial info: Land lease amount listed (for reference) $1,193
- HOA & community: No homeowners association; Not a senior community; Not a land-lease (land lease listed as No)
Exterior
- Parking: Attached covered parking
- Utilities: Cable available; Individual electric meter; Individual gas meter; 220 volts in kitchen; Public sewer; Public water
- Home design: Manufactured in park (double wide); New construction; Built in 2025
- Construction: Composition roof; Skyline manufactured home
- Exterior features: Backyard; Corner lot; Fenced; Irregular lot shape; Garden; Carport awning; Shed(s) / storage
Interior
- Kitchen: Free standing gas range; Hood over range; Microwave; Dishwasher; Free standing refrigerator; Ice maker; Breakfast area; Pantry cabinet; Marble counters; Breakfast nook and dining bar / space in kitchen
- Bedrooms: 3 bedrooms (including master bedroom)
- Flooring: Carpet; Wood
- Bathrooms: 2 full bathrooms; Bathrooms with double sinks, tub with shower over, and separate shower stall(s)
- Heating & cooling: Central heating; Central air conditioning; Ceiling fan(s)
- Interior features: Cathedral ceiling; Dual pane full windows; Storage area
- Laundry & utility: Laundry inside (hookups only); Gas hook-up for laundry; 220 volts in laundry
Neighborhood map
What this means for you Summary
Snapshot
- This is a 2-bed/1.5-bath manufactured listed at $200k.
Deal economics
- At list price, monthly cash flow is $1k ($13k/yr) — positive.
- The deal already cash-flows at list — no discount required.
- To meet the 1% rule (rent ≥ 1% of price), the offer needs to be $192k (4.1% below list).
- Recommended offer: $192k (4.1% below list) — sets the bar for 1% rule.
- Cap rate 29.1% vs local median 3.4% in Citrus Heights — top-decile yield for the area; either an underpriced asset or a hidden risk that comps aren't pricing in. Stress-test before assuming the spread holds.
Location & tenants
- Location reads 60/100 on livability (#614 in CA) — a middle-class / working-renter tenant base. Strengths: housing A+; Watch: schools D, crime D-, amenities F.
- San Juan Unified (suburban): math 40% / reading 62% proficiency, ranked #138 of 517 in CA (top 27%) — acceptable for families but not a draw, mixed tenant base, ~2y average lease.
- Market conditions: Rents rising (+1.9%/yr); 210 active listings in the ZIP; 14 comparable units currently listed for rent nearby; rentals leasing fast (median 4d on market — plan ~1-2 weeks tenant-placement turnaround); solid renter incomes; 6,825 units permitted in Sacramento County in 2024 (1,752 in 5+ unit buildings).
Forward outlook
- Local home prices are declining (-3.0%/yr); year-one equity from $403 of loan paydown is wiped out by about $2k of value loss. Plan a longer hold.
- Sacramento County population projected at +17% by 2050 — long-run rental-demand tailwind backs the buy-and-hold thesis.
- At projected returns (-3.0% appreciation + 1.9% rent growth), your $16k cash investment doubles in ~2 years — after that, you're playing with house money.
Negotiation context
- It's been on market 35 days — a 3% lower offer ($194k) is reasonable based on typical stale-listing flexibility.
Risks & watch-outs
- Climate carrying-cost: moderate flood risk; extreme-heat days projected 7→16/yr by 2055 (HVAC capex compounding) — expect insurance premiums to compound above CPI over the hold.
Questions for the listing agent
- It's been on market 35 days. Have you received any prior offers? Is the seller open to a 4% concession, seller financing, or rate buy-down credit?
- Is there a deadline driving the sale (1031 exchange, divorce, estate, relocation)? That informs how much negotiation room exists.
- Schools are D-rated, which usually means shorter tenancies and higher turnover. Who's the typical renter profile here, and what's been the actual vacancy rate?
- Crime grade is D in this area — have there been break-ins, vandalism, or insurance claims at this property in the last 3 years? What carrier currently insures it and at what premium?
- What's the average days-on-market for RENTAL listings here right now (not sales)? A rising rental-DOM trend means longer vacancies and softer asking-rent achievability than the comps imply.
- What's the recent tenant-quality profile in this submarket — average credit score on applications, eviction rate, late-payment / NSF rate, and stable-employment percentage? A property-management company in the area should have these aggregated.
- How much new for-sale + rental construction is in the pipeline within 1–3 miles? Heavy new supply typically softens prices + rents 12–24 months out; constrained supply supports both.
Investment metrics
- 1% rule
- 3.29% ✓
- Cap rate
- 29.15%
- Cash-on-cash
- 81.63%
- DSCR
- 4.63
- GRM
- 2.5
CMA / ARV
- ARV (on-the-fly)
- $58,320
- Comps found
- 8
Show comp detail 8 sales within ~0.75 mi
| Address | Dist | Beds/Ba | Sqft | Sold | Price | $/sf | Match |
|---|---|---|---|---|---|---|---|
| 5935 Auburn Blvd #160 | 0.27mi | 2/1.5 | 684 (-5%) | 4mo | $45,000 | $66 | 76 |
| 5935 Auburn Blvd #189 | 0.31mi | 2/2.0 | 690 (-4%) | 2mo | $29,900 | $43 | 75 |
| 6219 Tyee Ave #142 | 0.28mi | 2/1.0 | 720 (0%) | 20mo | $59,000 | $82 | 68 |
| 6222 Gettysburg Ln | 0.12mi | 2/1.0 | 672 (-7%) | 17mo | $70,000 | $104 | 68 |
| 5722 Clearwater Dr #18 | 0.41mi | 1/1.0 (-1) | 675 (-6%) | 1mo | $54,900 | $81 | 63 |
| 5935 Auburn Blvd #78 | 0.32mi | 1/1.5 (-1) | 672 (-7%) | 9mo | $38,000 | $57 | 61 |
| 6226 Manitoba Ave #70 | 0.38mi | 1/1.0 (-1) | 700 (-3%) | 12mo | $40,000 | $57 | 61 |
| 5935 Auburn Blvd #154 | 0.31mi | 2/1.0 | 800 (+11%) | 8mo | $77,500 | $97 | 59 |
Match score weights: distance 35% · size 25% · config 20% · recency 20%. Top-matched comps best support the ARV.
Projected returns pro-forma
-3.0% appreciation · 1.9% rent growth · sell at horizon
- IRR
- 80.6%
- Equity multiple
- 4.63×
- Total profit
- $59,225
- Equity at exit
- $8,696
- IRR
- 83.8%
- Equity multiple
- 9.23×
- Total profit
- $134,364
- Equity at exit
- $5,042
Cash invested: $16,330 (down + closing). Projections, not guarantees.
Landlord ↔ Tenant lean methodology
- Overall (STATE)
- 18 Strongly Tenant-Friendly
- State California
- 18 Strongly Tenant-Friendly · D+13
- County
- — inherits STATE
- City
- — inherits STATE
ZIP-level market 95621
- Rents YoY
- 1.9%
- Active inventory
- 210
- Price-to-rent
- 8.7×
Monthly cashflow live
- Estimated rent
- $1,916 high interval (Pro) →
- Mortgage (P&I)
- −$306
- Tax est. 1.5%
- −$73 /mo · $875/yr
- Insurance
- −$24
- HOA
- −$0
- Vacancy / Maint / Mgmt
- −$402
- Net cashflow
- $1,111
Break-even live
UW: 25.0% down · 7.5% · 30yr · 1.5% tax · 5.0% vac · 8.0% maint · 8.0% mgmt
Financing live
Cash to close
- Down payment
- $14,580
- Closing costs
- $1,750
- Reserves months
- —
- Total cash needed
- —
Loan-product check · same deal, 3 products live
Conventional
25% down · 7.5% · 30yr
- Down + closing
- —
- Monthly P&I
- —
- Monthly cashflow
- —
- DSCR
- —
- Eligible?
- —
Personal DTI + credit; lowest rate.
DSCR
20% down · 8.5% · 30yr
- Down + closing
- —
- Monthly P&I
- —
- Monthly cashflow
- —
- DSCR
- —
- Eligible?
- —
No personal income docs; deal must DSCR.
Hard money
10% down · 12.0% · 12mo
- Down + closing
- —
- Monthly P&I
- —
- Monthly cashflow
- —
- DSCR
- —
- Eligible?
- —
Short-term bridge; refi at stabilization.
Rent comps 14 comps
| Address | Beds | Baths | Sqft | Rent | $/sqft | DOM | Units | Dist |
|---|---|---|---|---|---|---|---|---|
| 6011 Shadow Ln Citrus Heights, CA | 1.0–2.0 | 1.0–2.0 | 779 | $2,348 | $3.01 | 1d | 15 | 0.22mi |
| 5979 Devecchi Ave Citrus Heights, CA | 1.0–2.0 | 1.0–2.0 | 775 | $1,871 | $2.41 | 1d | 15 | 0.41mi |
| 6430 Verner Ave Sacramento, CA | 1.0–2.0 | 1.0–2.0 | 705 | $2,295 | $3.25 | 23d | 1 | 0.56mi |
| 6546 Auburn Blvd Citrus Heights, CA | 2.0 | 1.0 | 624 | $1,853 | $2.97 | 4d | 10 | 0.76mi |
| 5501 Keoncrest Cir Unit 1 Sacramento, CA | 2.0 | 1.0 | 750 | $1,300 | $1.73 | 1d | 1 | 0.92mi |
| 6650 Crosswoods Cir Citrus Heights, CA | 1.0 | 1.0 | 465 | $1,575 | $3.39 | 2d | 6 | 1.06mi |
| 5244 Hackberry Ln Sacramento, CA | 2.0 | 1.0 | 712 | $1,712 | $2.41 | 43d | 1 | 1.31mi |
| 5425 Garfield Ave Sacramento, CA | 1.0–2.0 | 1.0–2.0 | 787 | $1,650 | $2.10 | 20d | 5 | 1.34mi |
| 5322 Hemlock St Sacramento, CA | 1.0–2.0 | 1.0 | 800 | $1,875 | $2.34 | 2d | 2 | 1.40mi |
| 5500 Foothill Garden Ct Sacramento, CA | 1.0 | 1.0 | 750 | $1,472 | $1.96 | 2d | 2 | 1.44mi |
| 5755 Callie Ln Sacramento, CA | 1.0–2.0 | 1.0–2.0 | 723 | $2,000 | $2.76 | 3d | 13 | 1.44mi |
| 6111 Shupe Dr Unit 53 Citrus Heights, CA | 1.0 | 1.0 | 667 | $1,600 | $2.40 | 22d | 1 | 1.46mi |
| 6111 Shupe Dr Unit 44 Citrus Heights, CA | 1.0 | 1.0 | 667 | $1,600 | $2.40 | 43d | 1 | 1.46mi |
| 6111 Shupe Dr Unit 15 Citrus Heights, CA | 1.0 | 1.0 | 667 | $1,575 | $2.36 | 17d | 1 | 1.46mi |
Listing history 14 events
-
2026-06-18days on market $199,900 Active 35 DOM
-
2026-06-17days on market $199,900 Active 34 DOM
-
2026-06-16days on market $199,900 Active 33 DOM
-
2026-06-15days on market $199,900 Active 32 DOM
-
2026-06-13days on market $199,900 Active 30 DOM
-
2026-06-13days on market $199,900 Active 29 DOM
-
2026-06-09days on market $199,900 Active 26 DOM
-
2026-06-08days on market $199,900 Active 25 DOM
-
2026-06-07days on market $199,900 Active 24 DOM
-
2026-06-05days on market $199,900 Active 21 DOM
-
2026-06-03days on market $199,900 Active 20 DOM
-
2026-06-02days on market $199,900 Active 19 DOM
-
2026-06-01days on market $199,900 Active 18 DOM
-
2026-05-31days on market $199,900 Active 17 DOM
ⓘ Source: listings_history table (triggers on properties + properties_extension) + one-shot
backfill from property_details.listing_events for pre-trigger history.
Climate risk First Street
- Flood 5/10 Major FEMA zone X (unshaded) · 32% chance over 30 yrs
- Wildfire 1/10 Low
- Heat 7/10 Severe 7 d/yr ≥102°F today · 16 d/yr by 30 yrs out
- Wind 1/10 Low
- Air quality 10/10 Extreme 34 unhealthy d/yr today · 36 by 30 yrs out
Nearby sold comps map
Loading sold comps map…
Walkable amenities ~0.75 mi
Loading nearby amenities…
Taxation est. · year 1
- Rental income
- $22,994
- − Mortgage interest
- −$3,267
- − Property taxes
- −$875
- − Insurance
- −$292
- − Repairs & maintenance
- −$1,840
- − Management
- −$1,840
- − Depreciation
- −$1,697
- Taxable income
- $13,185
- Est. tax owed @ 24.0%
- −$3,164
- After-tax cash flow
- $10,165/yr
For passive investors: Depreciation is non-cash, so a rental often shows a tax loss while cash-flowing — sheltering income. Rental losses are passive: they offset passive income freely, and up to $25,000/yr can offset ordinary (W-2) income if you actively participate and your MAGI is under $100k (phasing out to $0 by $150k); unused losses carry forward. On sale, claimed depreciation is recaptured at up to 25%, and gains may owe capital-gains tax (a 1031 exchange can defer both). Figures are a year-1 estimate at your 24.0% rate — not tax advice; consult a CPA.
Schools (NCES district)
- District
- San Juan Unified
- NCES district ID
- 0634620
- Math proficiency
- 40% ▲ 3.00%
- Reading proficiency
- 62% ▲ 16.00%
- Median HH income
- $55,655
- Composite
- 44.07/100
- National rank
- #2878
- State rank
- #138 of 517 in CA
Livability — Citrus Heights
- Score
- 60/100
- State rank
- #614
- US rank
- #19580
Category grades
Schools grade is shown separately in the Schools card above.
Census & demographics
- Census place
- Citrus Heights, CA
- County
- Sacramento County · 1,539,646 people
- City population
- 89,370
- Metro
- Sacramento-Roseville-Folsom, CA
- Population (ZIP)
- 42,442
- Household income
- $80,901
- Rent vs Own
- Severe rent burden
- 1854.0
Population outlook (Sacramento County) Hauer SSP2
- Today (2025)
- 1,660,763 people
- By 2030
- 1,732,990 · +4.3%
- By 2040
- 1,855,755 · +11.7%
- By 2050
- 1,941,335 · +16.9%
- By 2075
- 2,046,162 · +23.2%
- By 2100
- 1,961,444 · +18.1%
Race, ethnicity, and origin ACS 2023
- Neighborhood character
- Predominantly White (66%)
- Race & ethnicity
- White 66% Hispanic / Latino 19% Two or more races 11% Asian 6% Black 2%
- Hispanic origin (detail)
- Mexican 16%
- Common ancestry
- Subsaharan African 3% Lithuanian 3% Scotch-Irish 2%
- Foreign-born
- 15% · Canada, Vietnam
- Languages at home
- 78% English-only · Spanish 10% Russian/Polish/Slavic 6% Other Indo-European 3%
Political lean MEDSL · Sacramento
- 2024 margin
- D (+19.7) · D 58.1% · R 38.4% · Other 3.5%
- 2008→2024 swing
- +0.7pp no change · 2008: 19.0pp · 2024: 19.7pp
- All cycles
- 2024: D+19.7 2020: D+25.3 2016: D+23.7 2012: D+16.3 2008: D+19.0
Not yet ingested
- Civics
- —
Market trends
- HPI YoY
- ▼ -408.14%
- Current HPI
- 351.9333
- Rent YoY
- ▲ 1.90%
- Metro
- Sacramento-Roseville-Folsom, CA
- State GDP YoY
- ▲ 3.21%
- F500 in state
- 116
Industry mix (Fortune 500 HQ in CA)
| Industry | F500 HQs | Revenue |
|---|---|---|
| Technology | 27 | $1,492B |
|
||
| Financial Services | 3 | $174B |
|
||
| Retail | 3 | $44B |
|
||
| Insurance | 3 | $26B |
|
||
| Media / Entertainment | 2 | $115B |
|
||
| Pharmaceuticals / Biotech | 2 | $62B |
|
||
Property tax history
+1.3%/yrLatest (2024): $108 · +2.6% YoY. Source: county tax records.
Cash-flow waterfall
monthlySold comps — $/sqft
last 12 mo · ≤1 miLoading sold comps…