 6-Plex
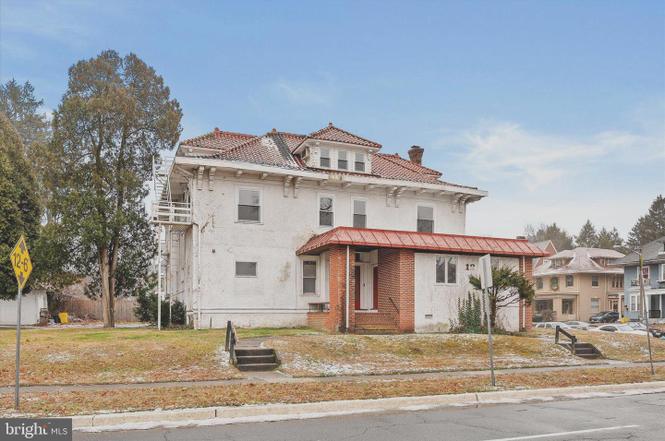
12 Parkside Ave · Trenton, NJ
Flood risk No data
- FEMA flood zone
- —
- Chance of flooding over 30 yrs
- —
- Est. flood insurance / yr
- —
Fire risk No data
- Est. fire insurance / yr
- —
Heat risk No data
- Hot days now (above threshold)
- —
- Hot days in 30 yrs
- —
Wind risk No data
- Chance of severe wind over 30 yrs
- —
Air-quality risk No data
- Unhealthy air days now
- —
- Unhealthy air days in 30 yrs
- —
Risk factors via First Street. Map © Google.
Why this score? — see what drove the B- grade
The composite is a weighted blend of 9 inputs, each scored 0–100. Each bar is that input's sub-score; the figure is the points it added to the 100-point composite (weight × sub-score).
- Cash flow +30.0/30.0
- 1% rule +10.0/10.0
- DSCR +10.0/10.0
- ARV discount +7.5/15.0
- Livability +3.8/5.0
- Rent growth +3.2/5.0
- Condition / age +2.5/5.0
- Schools +0.7/10.0
- Appreciation +0.0/10.0
$740,000
🖨 Deal sheet 📄 Offer letter ✓ Due diligence
Multi-family units
County records classify this as Multi-Family (5+ Unit). Listing-text estimate: 6 units. confirmed
5+ unit building — per-unit beds/baths from public records are typically unavailable; the breakdown below (if shown) is an estimate from the listing text.
Listing remarks
Located in the heart of Trenton’s sought-after historic area, this nicely updated 6-unit multifamily property offers a rare blend of classic charm and modern improvements. The building features spacious units with thoughtful renovations, preserving original character while providing today’s conveniences. Updates include refreshed interiors, well-maintained common areas, and strong mechanicals, making this a turnkey opportunity for investors or owner-occupants. Conveniently situated near downtown, public transportation, government offices, and local amenities, this property delivers both historic appeal and consistent rental demand. A solid addition to any investment portfolio.
Key facts
- Strong mechanicals
- Historic area
- Refreshed interiors
Tags
Property features AI
Exterior
- Parking: Detached garage with front entry; Covered parking; Driveway; Total of 2 garage/parking spaces (2-car garage)
- Utilities: Public water; Public sewer; 200+ amp electric service; Natural gas for heating and hot water
- Home design: Detached structure; Shingle roof; Fee simple ownership
- Construction: Concrete construction; Concrete perimeter foundation; Estimated year built
- Exterior features: Lot dimensions approximately 125 x 100; Tidal water not present; Other structures above and below grade
Interior
- Bedrooms: Three 1-room units; Two 1-bedroom units; One 3-bedroom unit
- Flooring: Wood
- Heating & cooling: Hot water heating (natural gas); Wall cooling units (natural gas cooling fuel)
- Interior features: Wood flooring; Full unfinished basement; One fireplace
Neighborhood map
What this means for you Summary
Snapshot
- This is a 6 × 5-bed/?-bath units multifamily listed at $740k.
Deal economics
- At list price, monthly cash flow is $7k ($88k/yr) — positive. Per door: $1k/mo.
- The deal already cash-flows at list — no discount required.
- Meets the 1% rule at list price ($15k rent vs $740k).
- Recommended offer: $673k (9.0% below list) — sets the bar for market timing.
- Cap rate 18.2% vs local median 6.3% in Trenton — top-decile yield for the area; either an underpriced asset or a hidden risk that comps aren't pricing in. Stress-test before assuming the spread holds.
Location & tenants
- Location reads 76/100 on livability (#133 in NJ, #3,533 nationally) — a middle-class / working-renter tenant base. Strengths: amenities A+, commute A+, health & safety A+; Watch: schools F, crime F, employment F.
- Trenton Public School District (urban): math 2% / reading 16% proficiency, ranked #471 of 472 in NJ (top 100%) — low school quality limits family demand, transient renter base, plan for 1-2y turnover; 80% free/reduced lunch — lower-income household profile, screen leases tightly.
- Market conditions: Rents rising (+2.6%/yr); 144 active listings in the ZIP; 2,256 units permitted in Mercer County in 2024 (1,303 in 5+ unit buildings).
- At $15,473/mo this rent would consume 368% of the median local household income ($50k/yr) (locally 2116% of renters already pay >50% of income on rent) — very limited rent-growth headroom before tenants either downsize or default.
Forward outlook
- Local home prices are declining (-3.0%/yr); year-one equity from $5k of loan paydown is wiped out by about $22k of value loss. Plan a longer hold.
- Mercer County population projected at +4% by 2050 — modest demand growth; plan on rents tracking national, not racing it.
- At projected returns (-3.0% appreciation + 2.6% rent growth), your $207k cash investment doubles in ~3 years — after that, you're playing with house money.
Negotiation context
- It's been on market 107 days — a 9% lower offer ($673k) is reasonable based on typical stale-listing flexibility.
- 2 sale attempts since 22y ago with the ask held roughly flat each time — persistent listings suggest the price (not the market) is what's stuck; bring a comps-based counter.
- Current owner paid $51k; list at $740k implies a 1351% gain — meaningful room to come down on a strong offer.
Risks & watch-outs
- Watch-outs: built in 1914 — expect roof / HVAC / electrical / plumbing capex.
Questions for the listing agent
- It's been on market 107 days. Have you received any prior offers? Is the seller open to a 9% concession, seller financing, or rate buy-down credit?
- Can we see the unit-by-unit rent roll, current vacancy, and any below-market leases? What's the average tenancy length?
- What capital expenditures (roof, boiler, parking lot, exteriors) have been made in the last 5 years, and what's planned in the next 2?
- Built in 1914 — when were the roof, HVAC, electrical panel, plumbing, and water heater last replaced?
- Why hasn't it sold? Are there any deal-killer items the seller is aware of (foundation, flood, title, zoning, code violations)?
- Is there a deadline driving the sale (1031 exchange, divorce, estate, relocation)? That informs how much negotiation room exists.
- Schools are F-rated, which usually means shorter tenancies and higher turnover. Who's the typical renter profile here, and what's been the actual vacancy rate?
- Crime grade is F in this area — have there been break-ins, vandalism, or insurance claims at this property in the last 3 years? What carrier currently insures it and at what premium?
- What's the average days-on-market for RENTAL listings here right now (not sales)? A rising rental-DOM trend means longer vacancies and softer asking-rent achievability than the comps imply.
- What's the recent tenant-quality profile in this submarket — average credit score on applications, eviction rate, late-payment / NSF rate, and stable-employment percentage? A property-management company in the area should have these aggregated.
- How much new apartment / multifamily construction is in the pipeline within 1–3 miles? Heavy new supply (>2% of stock underway) typically softens rents 12–24 months out; light construction supports rent growth.
Investment metrics
- 1% rule
- 2.09% ✓
- Cap rate
- 18.25%
- Cash-on-cash
- 42.69%
- DSCR
- 2.90
- GRM
- 4.0
CMA / ARV
No comps found within radius.
Projected returns pro-forma
-3.0% appreciation · 2.6% rent growth · sell at horizon
- IRR
- 39.0%
- Equity multiple
- 2.66×
- Total profit
- $343,386
- Equity at exit
- $110,336
- IRR
- 45.2%
- Equity multiple
- 5.24×
- Total profit
- $878,527
- Equity at exit
- $63,982
Cash invested: $207,200 (down + closing). Projections, not guarantees.
Landlord ↔ Tenant lean methodology
- Overall (STATE)
- 21 Tenant-Leaning
- State New Jersey
- 21 Tenant-Leaning · D+6
- County
- — inherits STATE
- City
- — inherits STATE
ZIP-level market 08618
- Rents YoY
- 2.6%
- Active inventory
- 144
- Price-to-rent
- 23.9×
Monthly cashflow live
- Estimated rent
- $15,473 medium interval (Pro) →
- Mortgage (P&I)
- −$3,881
- Tax from tax record
- −$664 /mo · $7,971/yr
- Insurance
- −$308
- HOA
- −$0
- Vacancy / Maint / Mgmt
- −$3,249
- Net cashflow
- $7,370
Break-even live
6-unit breakdown (identical units grouped — click to expand)
| Units | Beds | Baths | Est. rent |
|---|---|---|---|
| 6× units | 5 | — | $15,474 |
| #1 | 5 | — | $2,579 |
| #2 | 5 | — | $2,579 |
| #3 | 5 | — | $2,579 |
| #4 | 5 | — | $2,579 |
| #5 | 5 | — | $2,579 |
| #6 | 5 | — | $2,579 |
| Total (6 units) | $15,473 | ||
UW: 25.0% down · 7.5% · 30yr · 1.5% tax · 5.0% vac · 8.0% maint · 8.0% mgmt
Financing live
Cash to close
- Down payment
- $185,000
- Closing costs
- $22,200
- Reserves months
- —
- Total cash needed
- —
Loan-product check · same deal, 3 products live
Conventional
25% down · 7.5% · 30yr
- Down + closing
- —
- Monthly P&I
- —
- Monthly cashflow
- —
- DSCR
- —
- Eligible?
- —
Personal DTI + credit; lowest rate.
DSCR
20% down · 8.5% · 30yr
- Down + closing
- —
- Monthly P&I
- —
- Monthly cashflow
- —
- DSCR
- —
- Eligible?
- —
No personal income docs; deal must DSCR.
Hard money
10% down · 12.0% · 12mo
- Down + closing
- —
- Monthly P&I
- —
- Monthly cashflow
- —
- DSCR
- —
- Eligible?
- —
Short-term bridge; refi at stabilization.
Listing history 6 events
-
2026-05-12status Pending
-
2026-02-25price $740,000
-
2026-01-25$750,000 Active
-
2004-09-15historical
-
2004-06-21$325,000
-
1975-09-16soldstatus $51,000
ⓘ Source: listings_history table (triggers on properties + properties_extension) + one-shot
backfill from property_details.listing_events for pre-trigger history.
Tax reassessment forecast NJ · Partial reset (capped growth)
- Current annual tax
- $7,971 · $664/mo
- Projected year-2 tax
- $13,198 · $1,100/mo
- Expected delta
- +$5,228/yr (+$436/mo · 65.6%)
ⓘ Screening estimate from a state-policy table — verify with the county assessor before closing.
Nearby sold comps map
Loading sold comps map…
Walkable amenities ~0.75 mi
Loading nearby amenities…
Taxation est. · year 1
- Rental income
- $185,676
- − Mortgage interest
- −$41,452
- − Property taxes
- −$7,971
- − Insurance
- −$3,700
- − Repairs & maintenance
- −$14,854
- − Management
- −$14,854
- − Depreciation
- −$21,527
- Taxable income
- $81,318
- Est. tax owed @ 24.0%
- −$19,516
- After-tax cash flow
- $68,929/yr
For passive investors: Depreciation is non-cash, so a rental often shows a tax loss while cash-flowing — sheltering income. Rental losses are passive: they offset passive income freely, and up to $25,000/yr can offset ordinary (W-2) income if you actively participate and your MAGI is under $100k (phasing out to $0 by $150k); unused losses carry forward. On sale, claimed depreciation is recaptured at up to 25%, and gains may owe capital-gains tax (a 1031 exchange can defer both). Figures are a year-1 estimate at your 24.0% rate — not tax advice; consult a CPA.
Schools (NCES district)
- District
- Trenton Public School District
- NCES district ID
- 3416290
- Math proficiency
- 2% ▼ -8.00%
- Reading proficiency
- 16% ▼ -4.00%
- Median HH income
- $35,078
- Composite
- 7.31/100
- National rank
- #9956
- State rank
- #471 of 472 in NJ
Livability — Trenton
- Score
- 76/100
- State rank
- #133
- US rank
- #3533
Category grades
Schools grade is shown separately in the Schools card above.
Census & demographics
- Census place
- Trenton, NJ
- County
- Mercer County · 327,655 people
- City population
- 177,819
- Metro
- Trenton-Princeton, NJ
- Population (ZIP)
- 35,634
- Household income
- $50,390
- Rent vs Own
- Severe rent burden
- 2116.0
Population outlook (Mercer County) Hauer SSP2
- Today (2025)
- 381,395 people
- By 2030
- 384,640 · +0.9%
- By 2040
- 391,431 · +2.6%
- By 2050
- 397,845 · +4.3%
- By 2075
- 417,281 · +9.4%
- By 2100
- 420,327 · +10.2%
Race, ethnicity, and origin ACS 2023
- Neighborhood character
- Diverse neighborhood (Simpson 0.59)
- Race & ethnicity
- Black 59% White 19% Hispanic / Latino 16% Two or more races 7% Asian 3%
- Hispanic origin (detail)
- Mexican 1% Puerto Rican 6% Dominican 3%
- Common ancestry
- Romanian 2% Hispanic 1% Scotch-Irish 1%
- Foreign-born
- 14% · Canada, China, South Korea
- Languages at home
- 80% English-only · Spanish 10% Other Indo-European 3% Arabic 1%
Political lean MEDSL · Mercer
- 2024 margin
- Solid D (+33.9) · D 65.9% · R 32.0% · Other 2.1%
- 2008→2024 swing
- -2.2pp toward R · 2008: 36.1pp · 2024: 33.9pp
- All cycles
- 2024: D+33.9 2020: D+40.0 2016: D+36.2 2012: D+36.8 2008: D+36.1
Not yet ingested
- Civics
- —
Market trends
- HPI YoY
- ▼ -309.54%
- Current HPI
- 288.6841
- Rent YoY
- ▲ 2.60%
- Metro
- Trenton-Princeton, NJ
- State GDP YoY
- ▲ 2.05%
- F500 in state
- 34
Industry mix (Fortune 500 HQ in NJ)
| Industry | F500 HQs | Revenue |
|---|---|---|
| Consumer Goods | 3 | $31B |
|
||
| Pharmaceuticals | 2 | $153B |
|
||
| Technology | 2 | $21B |
|
||
| Insurance | 2 | $20B |
|
||
| Healthcare | 2 | $19B |
|
||
| Financial Services | 1 | $70B |
|
||
Price history
+1351.0% since first listed6 events — show timeline
- 2026-05-12 Pending — BRIGHT MLS
- 2026-02-25 Price Changed $740,000 BRIGHT MLS
- 2026-01-25 Listed $750,000 BRIGHT MLS
- 2004-09-15 Listing Removed — BRIGHT MLS
- 2004-06-21 Listed $325,000 BRIGHT MLS
- 1975-09-16 Sold (Public Records) $51,000 Public Records
Property tax history
+4.8%/yrLatest (2014): $7,971 · +0.6% YoY. Source: county tax records.
Cash-flow waterfall
monthlySold comps — $/sqft
last 12 mo · ≤1 miLoading sold comps…