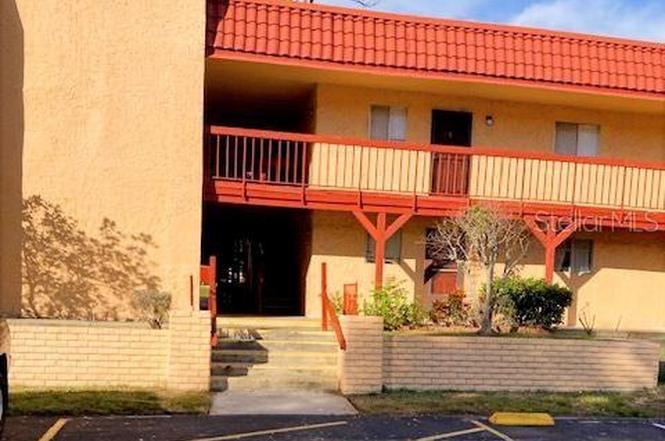
2804 N Powers Dr #27 · Pine Hills, FL
Flood risk 1/10 · Minimal
- FEMA flood zone
- X (unshaded)
- Chance of flooding over 30 yrs
- 0.0%
- Est. flood insurance / yr
- $507 – $1,088
Fire risk 1/10 · Minimal
- Est. fire insurance / yr
- $947 – $1,759
Heat risk 9/10 · Severe
- Hot days now (above 108°F)
- 7 days/yr
- Hot days in 30 yrs
- 23 days/yr
Wind risk 9/10 · Severe
- Chance of severe wind over 30 yrs
- 99.0%
Air-quality risk 1/10 · Minimal
- Unhealthy air days now
- 0 days/yr
- Unhealthy air days in 30 yrs
- 0 days/yr
Risk factors via First Street. Map © Google.
Why this score? — see what drove the C grade
The composite is a weighted blend of 9 inputs, each scored 0–100. Each bar is that input's sub-score; the figure is the points it added to the 100-point composite (weight × sub-score).
- Cash flow +23.4/30.0
- 1% rule +9.1/10.0
- DSCR +7.5/10.0
- ARV discount +7.5/15.0
- Schools +4.1/10.0
- Livability +3.7/5.0
- Condition / age +2.5/5.0
- Rent growth +1.8/5.0
- Appreciation +0.0/10.0
$115,000
🖨 Deal sheet 📄 Offer letter ✓ Due diligence
Listing remarks
PRICE REDUCED! Make your next home this first-floor unit with 2 bedrooms & 1 bathroom in a beautifully maintained, gated community that is exclusively owner-occupied (no investors/rentals permitted). The open living and dining area has sliding glass doors that extend your space with your private covered, screened back patio for added natural light and relaxation. Relax while enjoying the landscaped view. The patio includes a storage closet for extra space. The Unit has tile floors throughout, spacious bedroom closets, and a pass-through window/ counter from kitchen to dining area. Kitchen appliances included. Tankless water heater. The Community offers a Club House, Community Pool,
Key facts
- Gated community
- Tile floors
- Pass-through window
Tags
Property features AI
Finance
- Other: Unfurnished unit; Pets allowed: cats and dogs (with number limit)
- Financial info: Total annual association fees $3,720; Condo fees paid monthly
- HOA & community: Monthly condo fee of $310; Association requires approval; Association amenities include clubhouse, pool, maintenance, grounds maintenance, management, laundry, park, playground, shuffleboard court, vehicle restrictions; Community features include buyer approval required, community mailbox, deed restrictions, sidewalks, tennis courts
Exterior
- Parking: Assigned parking; Guest parking
- Security: Gated community
- Utilities: Public water; Public sewer; Public utilities
- Home design: Residential condominium, attached; One-level unit (floor 1); North-facing; 2-story building
- Construction: Block and concrete construction; Shingle roof; Built on slab
- Exterior features: Covered, screened patio; Patio; Sidewalk; Sliding doors; Storage
Interior
- Kitchen: Dishwasher; Disposal; Microwave; Range; Refrigerator; Tankless water heater
- Bedrooms: 2 bedrooms
- Flooring: Tile; Slab foundation
- Bathrooms: 1 full bathroom
- Heating & cooling: Central heating; Central air conditioning
- Interior features: Ceiling fans; Living room/dining room combo; Blinds on windows
- Laundry & utility: Common area laundry
Neighborhood map
What this means for you Summary
Snapshot
- This is a 2-bed/1.0-bath condo listed at $115k.
Deal economics
- At list price, monthly cash flow is $213 ($3k/yr) — positive.
- The deal already cash-flows at list — no discount required.
- Meets the 1% rule at list price ($2k rent vs $115k).
- Recommended offer: $101k (12.0% below list) — sets the bar for market timing.
- Cap rate 8.5% vs local median 4.9% in Pine Hills — top-decile yield for the area; either an underpriced asset or a hidden risk that comps aren't pricing in. Stress-test before assuming the spread holds.
Location & tenants
- Location reads 73/100 on livability (#317 in FL) — a middle-class / working-renter tenant base. Strengths: commute A+, cost of living A+, housing A+; Watch: crime D+, employment D, amenities F.
- Orange (suburban): math 46% / reading 51% proficiency, ranked #43 of 73 in FL (top 59%) — families likely to look elsewhere, expect single-tenant / working-renter base with shorter leases.
- Market conditions: Rents soft (-2.7%/yr); 178 active listings in the ZIP; 15 comparable units currently listed for rent nearby; rentals at typical pace (median 22d on market — plan ~3-4 weeks tenant-placement turnaround); 8,053 units permitted in Orange County in 2024 (3,133 in 5+ unit buildings).
- This rent runs 31% of the median local income ($63k/yr) — at the standard rent-burdened threshold; future hikes will face affordability resistance.
Forward outlook
- Local home prices are declining (-3.0%/yr); year-one equity from $795 of loan paydown is wiped out by about $3k of value loss. Plan a longer hold.
- Orange County population projected at +52% by 2050 — long-run rental-demand tailwind backs the buy-and-hold thesis.
Negotiation context
- It's been on market 153 days — a 12% lower offer ($101k) is reasonable based on typical stale-listing flexibility.
- Current owner paid $63k; list at $115k implies a 83% gain — meaningful room to come down on a strong offer.
Risks & watch-outs
- Climate carrying-cost: severe wind risk, 99% chance of damaging wind over 30y; extreme-heat days projected 7→23/yr by 2055 (HVAC capex compounding) — expect insurance premiums to compound above CPI over the hold.
Questions for the listing agent
- It's been on market 153 days. Have you received any prior offers? Is the seller open to a 12% concession, seller financing, or rate buy-down credit?
- Built in 1979 — when were the roof, HVAC, electrical panel, plumbing, and water heater last replaced?
- What does the HOA fee cover, when was the last increase, and are there any pending special assessments or reserve-fund shortfalls?
- Any open or pending special assessments — roof, HVAC, plumbing, elevator, façade? What's the per-unit balance and payoff schedule, and is the seller paying it off at close or rolling it to the buyer?
- Why hasn't it sold? Are there any deal-killer items the seller is aware of (foundation, flood, title, zoning, code violations)?
- Is there a deadline driving the sale (1031 exchange, divorce, estate, relocation)? That informs how much negotiation room exists.
- Schools are B-rated — typically a magnet for longer-tenancy family renters. What's the average tenant stay here, and is there a school-zone premium baked into asking?
- Crime grade is D in this area — have there been break-ins, vandalism, or insurance claims at this property in the last 3 years? What carrier currently insures it and at what premium?
- What's the average days-on-market for RENTAL listings here right now (not sales)? A rising rental-DOM trend means longer vacancies and softer asking-rent achievability than the comps imply.
- What's the recent tenant-quality profile in this submarket — average credit score on applications, eviction rate, late-payment / NSF rate, and stable-employment percentage? A property-management company in the area should have these aggregated.
- How much new apartment / multifamily construction is in the pipeline within 1–3 miles? Heavy new supply (>2% of stock underway) typically softens rents 12–24 months out; light construction supports rent growth.
Investment metrics
- 1% rule
- 1.41% ✓
- Cap rate
- 8.51%
- Cash-on-cash
- 7.92%
- DSCR
- 1.35
- GRM
- 5.9
CMA / ARV
No comps found within radius.
Projected returns pro-forma
-3.0% appreciation · 0.0% rent growth · sell at horizon
- IRR
- -8.5%
- Equity multiple
- 0.70×
- Total profit
- $-9,659
- Equity at exit
- $17,147
- IRR
- -4.9%
- Equity multiple
- 0.73×
- Total profit
- $-8,563
- Equity at exit
- $9,943
Cash invested: $32,200 (down + closing). Projections, not guarantees.
Landlord ↔ Tenant lean methodology
- Overall (STATE)
- 87 Strongly Landlord-Friendly
- State Florida
- 87 Strongly Landlord-Friendly · R+3
- County
- — inherits STATE
- City
- — inherits STATE
ZIP-level market 32818
- Home prices YoY
- -22.5%
- Rents YoY
- -2.7%
- Active inventory
- 178
- Price-to-rent
- 5.9×
Monthly cashflow live
- Estimated rent
- $1,621 high interval (Pro) →
- Mortgage (P&I)
- −$603
- Tax from tax record
- −$107 /mo · $1,289/yr
- Insurance
- −$48
- HOA
- −$310
- Vacancy / Maint / Mgmt
- −$340
- Net cashflow
- $213
Break-even live
UW: 25.0% down · 7.5% · 30yr · 1.5% tax · 5.0% vac · 8.0% maint · 8.0% mgmt
Financing live
Cash to close
- Down payment
- $28,750
- Closing costs
- $3,450
- Reserves months
- —
- Total cash needed
- —
Loan-product check · same deal, 3 products live
Conventional
25% down · 7.5% · 30yr
- Down + closing
- —
- Monthly P&I
- —
- Monthly cashflow
- —
- DSCR
- —
- Eligible?
- —
Personal DTI + credit; lowest rate.
DSCR
20% down · 8.5% · 30yr
- Down + closing
- —
- Monthly P&I
- —
- Monthly cashflow
- —
- DSCR
- —
- Eligible?
- —
No personal income docs; deal must DSCR.
Hard money
10% down · 12.0% · 12mo
- Down + closing
- —
- Monthly P&I
- —
- Monthly cashflow
- —
- DSCR
- —
- Eligible?
- —
Short-term bridge; refi at stabilization.
Rent comps 15 comps
| Address | Beds | Baths | Sqft | Rent | $/sqft | DOM | Units | Dist |
|---|---|---|---|---|---|---|---|---|
| 3024 N Powers Dr Orlando, FL | 1.0–2.0 | 1.0–2.0 | 915 | $1,470 | $1.61 | 16d | 80 | 0.15mi |
| 6408 Sunshine St Orlando, FL | 3.0 | 1.5 | 1000 | $1,900 | $1.90 | 4d | 1 | 0.31mi |
| 6872 Alta Westgate Dr Orlando, FL | 2.0–3.0 | 2.0 | 1190 | $1,466 | $1.23 | 7d | 1 | 0.55mi |
| 6508 Spring Glade Ct Orlando, FL | 3.0 | 2.0 | 1032 | $1,325 | $1.28 | 21d | 1 | 0.63mi |
| 5600 Silver Star Rd Orlando, FL | 1.0–3.0 | 1.0–2.0 | 850 | $1,310 | $1.54 | 14d | 6 | 0.67mi |
| 5402 Pine Chase Dr Orlando, FL | 2.0–3.0 | 2.0 | 1133 | $1,449 | $1.28 | 1d | 4 | 0.78mi |
| 2603 Silkwood Cir Orlando, FL | 2.0–3.0 | 2.0 | 1114 | $1,632 | $1.46 | 3d | 18 | 0.78mi |
| 1537 Ridge Pointe Dr Orlando, FL | 3.0 | 2.0 | 1108 | $2,200 | $1.99 | 23d | 1 | 0.84mi |
| 1529 Ridge Pointe Dr Orlando, FL | 3.0 | 2.0 | 1108 | $1,995 | $1.80 | 7d | 1 | 0.85mi |
| 2203 Silver Pines Pl #601 Orlando, FL | 2.0 | 1.0 | 962 | $1,500 | $1.56 | 23d | 1 | 0.90mi |
| 5249 Champagne Cir Orlando, FL | 2.0 | 2.0 | 980 | $1,795 | $1.83 | 23d | 1 | 1.08mi |
| 5505 Hernandes Dr #113 Orlando, FL | 2.0 | 1.0 | 728 | $1,175 | $1.61 | 23d | 1 | 1.14mi |
| 3285 Split Willow Dr Orlando, FL | 2.0 | 1.0 | 845 | $1,400 | $1.66 | 23d | 1 | 1.43mi |
| 3043 Willow Bend Blvd Orlando, FL | 2.0 | 2.0 | 900 | $1,450 | $1.61 | 23d | 1 | 1.46mi |
| 2920 Eastern Willow Ave Orlando, FL | 2.0 | 2.0 | 868 | $1,500 | $1.73 | 23d | 1 | 1.50mi |
HOA detail condo
- Monthly dues
- $310 · $3,720/yr
- Likely covers
- waterpoolsecurity
- Assessments
- None detected in remarks — confirm with the listing agent.
Listing history 18 events
-
2026-06-18days on market $115,000 Active 153 DOM
-
2026-06-17days on market $115,000 Active 152 DOM
-
2026-06-16days on market $115,000 Active 151 DOM
-
2026-06-15days on market $115,000 Active 150 DOM
-
2026-06-13days on market $115,000 Active 148 DOM
-
2026-06-13days on market $115,000 Active 147 DOM
-
2026-06-09days on market $115,000 Active 144 DOM
-
2026-06-08days on market $115,000 Active 143 DOM
-
2026-06-07days on market $115,000 Active 142 DOM
-
2026-06-04days on market $115,000 Active 139 DOM
-
2026-06-03days on market $115,000 Active 138 DOM
-
2026-06-02days on market $115,000 Active 137 DOM
-
2026-06-02days on market $115,000 Active 136 DOM
-
2026-05-31days on market $115,000 Active 135 DOM
-
2026-05-12price $115,000
-
2026-01-16$125,000 Active
-
2020-10-09soldstatus $63,000
-
1979-12-01soldstatus $24,500
ⓘ Source: listings_history table (triggers on properties + properties_extension) + one-shot
backfill from property_details.listing_events for pre-trigger history.
Tax reassessment forecast FL · Resets to sale price
- Current annual tax
- $1,289 · $107/mo
- Projected year-2 tax
- $1,289 · $107/mo
- Expected delta
- $0/yr ($0/mo · 0.0%)
ⓘ Screening estimate from a state-policy table — verify with the county assessor before closing.
Climate risk First Street
- Flood 1/10 Low FEMA zone X (unshaded) · 0% chance over 30 yrs
- Wildfire 1/10 Low
- Heat 9/10 Extreme 7 d/yr ≥108°F today · 23 d/yr by 30 yrs out
- Wind 9/10 Extreme 99% chance of damaging wind over 30 yrs
- Air quality 1/10 Low 0 unhealthy d/yr today · 0 by 30 yrs out
Nearby sold comps map
Loading sold comps map…
Walkable amenities ~0.75 mi
Loading nearby amenities…
Taxation est. · year 1
- Rental income
- $19,456
- − Mortgage interest
- −$6,442
- − Property taxes
- −$1,289
- − Insurance
- −$575
- − Repairs & maintenance
- −$1,557
- − Management
- −$1,557
- − HOA
- −$3,720
- − Depreciation
- −$3,345
- Taxable income
- $973
- Est. tax owed @ 24.0%
- −$233
- After-tax cash flow
- $2,317/yr
For passive investors: Depreciation is non-cash, so a rental often shows a tax loss while cash-flowing — sheltering income. Rental losses are passive: they offset passive income freely, and up to $25,000/yr can offset ordinary (W-2) income if you actively participate and your MAGI is under $100k (phasing out to $0 by $150k); unused losses carry forward. On sale, claimed depreciation is recaptured at up to 25%, and gains may owe capital-gains tax (a 1031 exchange can defer both). Figures are a year-1 estimate at your 24.0% rate — not tax advice; consult a CPA.
Schools (NCES district)
- District
- Orange
- NCES district ID
- 1201440
- Math proficiency
- 46% ▼ -9.00%
- Reading proficiency
- 51% ▼ -2.00%
- Median HH income
- $49,350
- Composite
- 41.47/100
- National rank
- #3461
- State rank
- #43 of 73 in FL
Livability — Pine Hills
- Score
- 73/100
- State rank
- #317
- US rank
- #5362
Category grades
Schools grade is shown separately in the Schools card above.
Census & demographics
- Census place
- Pine Hills, FL
- County
- Orange County · 1,471,359 people
- City population
- 60,203
- Metro
- Orlando-Kissimmee-Sanford, FL
- Population (ZIP)
- 59,114
- Household income
- $63,061
- Rent vs Own
- Severe rent burden
- 2059.0
Population outlook (Orange County) Hauer SSP2
- Today (2025)
- 1,618,226 people
- By 2030
- 1,787,404 · +10.5%
- By 2040
- 2,125,621 · +31.4%
- By 2050
- 2,454,016 · +51.6%
- By 2075
- 3,173,711 · +96.1%
- By 2100
- 3,607,781 · +122.9%
Race, ethnicity, and origin ACS 2023
- Neighborhood character
- Predominantly Black (69%)
- Race & ethnicity
- Black 69% Hispanic / Latino 14% White 10% Two or more races 6% Asian 3%
- Hispanic origin (detail)
- Mexican 3% Puerto Rican 5% Cuban 1%
- Common ancestry
- Hispanic 21% Estonian 1% Romanian 1%
- Foreign-born
- 40% · Canada, Vietnam, China
- Languages at home
- 59% English-only · French/Haitian/Cajun 25% Spanish 11% Vietnamese 2%
Political lean MEDSL · Orange
- 2024 margin
- D (+13.6) · D 56.1% · R 42.5% · Other 1.3%
- 2008→2024 swing
- -5.0pp toward R · 2008: 18.6pp · 2024: 13.6pp
- All cycles
- 2024: D+13.6 2020: D+23.1 2016: D+24.6 2012: D+18.2 2008: D+18.6
Not yet ingested
- Civics
- —
Market trends
- HPI YoY
- ▼ -93.40%
- Current HPI
- 321.5821
- Rent YoY
- ▼ -2.66%
- Metro
- Orlando-Kissimmee-Sanford, FL
- State GDP YoY
- ▲ 3.28%
- F500 in state
- 36
Industry mix (Fortune 500 HQ in FL)
| Industry | F500 HQs | Revenue |
|---|---|---|
| Industrial Technology | 2 | $29B |
|
||
| Insurance | 2 | $17B |
|
||
| Retail | 1 | $60B |
|
||
| Technology Distribution | 1 | $58B |
|
||
| Homebuilding | 1 | $35B |
|
||
| Technology Manufacturing | 1 | $35B |
|
||
Price history
+369.4% since first listed4 events — show timeline
- 2026-05-12 Price Changed $115,000 Stellar MLS as Distributed by MLS Grid
- 2026-01-16 Listed $125,000 Stellar MLS as Distributed by MLS Grid
- 2020-10-09 Sold (Public Records) $63,000 Public Records
- 1979-12-01 Sold (Public Records) $24,500 Public Records
Property tax history
+11.5%/yrLatest (2025): $1,289 · +20.2% YoY. Source: county tax records.
Cash-flow waterfall
monthlySold comps — $/sqft
last 12 mo · ≤1 miLoading sold comps…