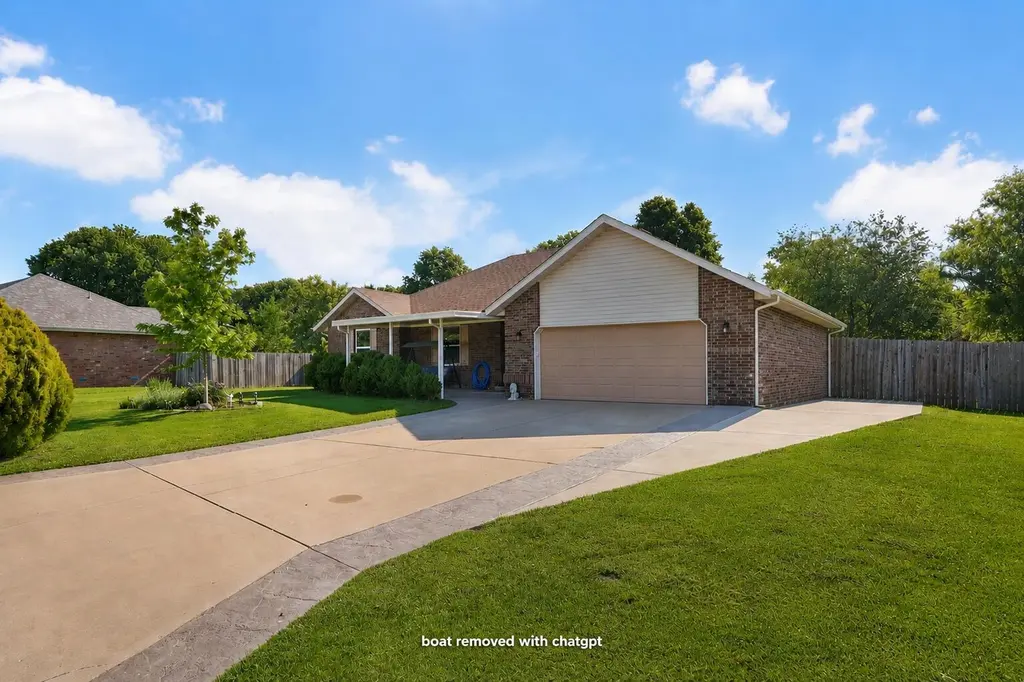
606 Ryleigh Cir · Nixa, MO
Flood risk 1/10 · Minimal
- FEMA flood zone
- X (unshaded)
- Chance of flooding over 30 yrs
- 0.0%
- Est. flood insurance / yr
- $473 – $860
Fire risk 3/10 · Minor
- Est. fire insurance / yr
- $1,054 – $1,958
Heat risk 5/10 · Moderate
- Hot days now (above 104°F)
- 7 days/yr
- Hot days in 30 yrs
- 19 days/yr
Wind risk 2/10 · Minimal
- Chance of severe wind over 30 yrs
- —
Air-quality risk 1/10 · Minimal
- Unhealthy air days now
- 0 days/yr
- Unhealthy air days in 30 yrs
- 0 days/yr
Risk factors via First Street. Map © Google.
Why this score? — see what drove the D- grade
The composite is a weighted blend of 9 inputs, each scored 0–100. Each bar is that input's sub-score; the figure is the points it added to the 100-point composite (weight × sub-score).
- Cash flow +11.1/30.0
- ARV discount +7.5/15.0
- Schools +5.6/10.0
- Rent growth +3.9/5.0
- Livability +3.7/5.0
- DSCR +3.2/10.0
- Condition / age +2.5/5.0
- 1% rule +2.3/10.0
- Appreciation +0.0/10.0
$289,900
🖨 Deal sheet 📄 Offer letter ✓ Due diligence
Listing remarks
From the moment you pull up to the covered front porch, you'll feel the warmth and care that has gone into this home. Located in desirable Nixa, this property has been lovingly updated with gorgeous new granite countertops and refreshed flooring that give every room a bright, welcoming feel. Outside, a spacious patio sets the stage for summer barbecues and relaxed evenings, while the extra parking spot adds everyday practicality. This home is truly ready for its next chapter
Key facts
- Covered front porch
- Extra parking spot
- Refreshed flooring
Tags
Property features AI
Exterior
- Parking: 2-car garage; Paved driveway; Garage door opener; Additional parking
- Security: Smoke detector(s)
- Utilities: Public water; Public sewer; Cable available; Public maintained road (city street, asphalt)
- Home design: Single family residence; One level
- Construction: Asphalt roof
- Exterior features: Garden; Front, side and rear covered porches; Wood privacy fencing; Shed(s); Few trees; Has view
Interior
- Kitchen: Dishwasher; Microwave; Disposal; Electric oven; Free-standing electric oven; Granite counters
- Bedrooms: Bedrooms with walk-in closet(s)
- Flooring: Tile
- Bathrooms: 2 full bathrooms; Therapeutic whirlpool (accessibility feature)
- Heating & cooling: Central heating; Natural gas heating; Fireplace with gas insert, glass doors, blower fan; Central air; Ceiling fans; Attic fan
- Interior features: Granite counters; High ceilings; Walk-in closets; Insulated double-pane windows with blinds and window coverings; Therapeutic whirlpool; Smoke detector(s)
- Laundry & utility: Gas water heater
Neighborhood map
What this means for you Summary
Snapshot
- This is a 3-bed/2.0-bath other listed at $290k.
Deal economics
- At list price, monthly cash flow is $-119 ($-1k/yr) — negative.
- To cash-flow at today's rent, offer at most $269k (7.3% below list).
- To meet the 1% rule (rent ≥ 1% of price), the offer needs to be $213k (26.6% below list).
- Recommended offer: $213k (26.6% below list) — sets the bar for 1% rule.
- Cap rate 5.8% vs local median 3.7% in Nixa — top-decile yield for the area; either an underpriced asset or a hidden risk that comps aren't pricing in. Stress-test before assuming the spread holds.
Location & tenants
- Location reads 74/100 on livability (#68 in MO, #4,558 nationally) — a middle-class / working-renter tenant base. Strengths: crime A+, cost of living A+, housing A+; Watch: amenities F, commute F, health & safety F.
- Nixa Public Schools (suburban): math 66% / reading 65% proficiency, ranked #6 of 324 in MO (top 2%) — acceptable for families but not a draw, mixed tenant base, ~2y average lease.
- Zoned schools: Nixa Junior High (math 70% / reading 61%, grade A-, #3 of 391 statewide, top 1%, 1,067 students, 29% FRL); Nixa High (math 70% / reading 77%, grade B+, #6 of 521 statewide, top 1%, 1,957 students, 24% FRL) — zoned schools at 26% FRL track the district average.
- Market conditions: Rents rising fast (+5.7%/yr); 396 active listings in the ZIP; 5 comparable units currently listed for rent nearby; rentals leasing fast (median 14d on market — plan ~1-2 weeks tenant-placement turnaround); solid renter incomes; 537 units permitted in Christian County in 2024 (0 in 5+ unit buildings).
Forward outlook
- Local home prices are declining (-3.0%/yr); year-one equity from $2k of loan paydown is wiped out by about $9k of value loss. Plan a longer hold.
- Christian County population projected at +24% by 2050 — long-run rental-demand tailwind backs the buy-and-hold thesis.
Negotiation context
- Only 12 days on market — expect competitive offers; lowballing is unlikely to land.
Risks & watch-outs
- Climate carrying-cost: extreme-heat days projected 7→19/yr by 2055 (HVAC capex compounding) — expect insurance premiums to compound above CPI over the hold.
Questions for the listing agent
- What do current leases actually rent for vs. the listed asking? Can we see a recent rent roll and the last 12 months of T-12 income?
- Is there a deadline driving the sale (1031 exchange, divorce, estate, relocation)? That informs how much negotiation room exists.
- Schools are B-rated — typically a magnet for longer-tenancy family renters. What's the average tenant stay here, and is there a school-zone premium baked into asking?
- The area grade is low — what's the realistic commute time and amenity access for the typical tenant pool here? Any planned neighborhood developments (good or bad) we should know about?
- What's the average days-on-market for RENTAL listings here right now (not sales)? A rising rental-DOM trend means longer vacancies and softer asking-rent achievability than the comps imply.
- What's the recent tenant-quality profile in this submarket — average credit score on applications, eviction rate, late-payment / NSF rate, and stable-employment percentage? A property-management company in the area should have these aggregated.
- How much new for-sale + rental construction is in the pipeline within 1–3 miles? Heavy new supply typically softens prices + rents 12–24 months out; constrained supply supports both.
Investment metrics
- 1% rule
- 0.73% ✗
- Cap rate
- 5.80%
- Cash-on-cash
- -1.76%
- DSCR
- 0.92
- GRM
- 11.4
CMA / ARV
No comps found within radius.
Projected returns pro-forma
-3.0% appreciation · 5.67% rent growth · sell at horizon
- IRR
- -16.6%
- Equity multiple
- 0.40×
- Total profit
- $-48,781
- Equity at exit
- $43,225
- IRR
- -4.6%
- Equity multiple
- 0.67×
- Total profit
- $-27,179
- Equity at exit
- $25,065
Cash invested: $81,172 (down + closing). Projections, not guarantees.
Landlord ↔ Tenant lean methodology
- Overall (STATE)
- 81 Strongly Landlord-Friendly
- State Missouri
- 81 Strongly Landlord-Friendly · R+10
- County
- — inherits STATE
- City
- — inherits STATE
ZIP-level market 65714
- Home prices YoY
- -25.0%
- Rents YoY
- 5.7%
- Active inventory
- 396
- Price-to-rent
- 11.4×
Monthly cashflow live
- Estimated rent
- $2,128 high interval (Pro) →
- Mortgage (P&I)
- −$1,520
- Tax from tax record
- −$159 /mo · $1,906/yr
- Insurance
- −$121
- HOA
- −$0
- Vacancy / Maint / Mgmt
- −$447
- Net cashflow
- $-119
Break-even live
UW: 25.0% down · 7.5% · 30yr · 1.5% tax · 5.0% vac · 8.0% maint · 8.0% mgmt
Financing live
Cash to close
- Down payment
- $72,475
- Closing costs
- $8,697
- Reserves months
- —
- Total cash needed
- —
Loan-product check · same deal, 3 products live
Conventional
25% down · 7.5% · 30yr
- Down + closing
- —
- Monthly P&I
- —
- Monthly cashflow
- —
- DSCR
- —
- Eligible?
- —
Personal DTI + credit; lowest rate.
DSCR
20% down · 8.5% · 30yr
- Down + closing
- —
- Monthly P&I
- —
- Monthly cashflow
- —
- DSCR
- —
- Eligible?
- —
No personal income docs; deal must DSCR.
Hard money
10% down · 12.0% · 12mo
- Down + closing
- —
- Monthly P&I
- —
- Monthly cashflow
- —
- DSCR
- —
- Eligible?
- —
Short-term bridge; refi at stabilization.
Rent comps 5 comps
| Address | Beds | Baths | Sqft | Rent | $/sqft | DOM | Units | Dist |
|---|---|---|---|---|---|---|---|---|
| 922 S Pindall Ln Nixa, MO | 3.0 | 2.0 | 1608 | $2,195 | $1.37 | 13d | 1 | 1.30mi |
| 926 S Pindall Ln Nixa, MO | 4.0 | 2.0 | 1861 | $2,495 | $1.34 | 13d | 1 | 1.30mi |
| 930 S Pindall Ln Nixa, MO | 3.0 | 2.0 | 1608 | $2,195 | $1.37 | 13d | 1 | 1.31mi |
| 652 W Brook Hollow Rd Nixa, MO | 3.0 | 2.0 | 1608 | $2,195 | $1.37 | 13d | 1 | 1.34mi |
| 640 Harrison St Unit 658 Nixa, MO | 2.0 | 2.0 | 1264 | $1,895 | $1.50 | 21d | 1 | 1.39mi |
Listing history 3 events
-
2026-05-25status Pending
-
2026-05-12$289,900 Active
-
2003-06-18soldstatus
ⓘ Source: listings_history table (triggers on properties + properties_extension) + one-shot
backfill from property_details.listing_events for pre-trigger history.
Tax reassessment forecast MO · Resets to sale price
- Current annual tax
- $1,906 · $159/mo
- Projected year-2 tax
- $2,812 · $234/mo
- Expected delta
- +$906/yr (+$75/mo · 47.5%)
ⓘ Screening estimate from a state-policy table — verify with the county assessor before closing.
Climate risk First Street
- Flood 1/10 Low FEMA zone X (unshaded) · 0% chance over 30 yrs
- Wildfire 3/10 Moderate
- Heat 5/10 Major 7 d/yr ≥104°F today · 19 d/yr by 30 yrs out
- Wind 2/10 Low
- Air quality 1/10 Low 0 unhealthy d/yr today · 0 by 30 yrs out
Nearby sold comps map
Loading sold comps map…
Walkable amenities ~0.75 mi
Loading nearby amenities…
Taxation est. · year 1
- Rental income
- $25,533
- − Mortgage interest
- −$16,239
- − Property taxes
- −$1,906
- − Insurance
- −$1,450
- − Repairs & maintenance
- −$2,043
- − Management
- −$2,043
- − Depreciation
- −$8,433
- Taxable loss
- −$6,581
- Est. tax savings @ 24.0%
- +$1,579
- After-tax cash flow
- $151/yr
For passive investors: Depreciation is non-cash, so a rental often shows a tax loss while cash-flowing — sheltering income. Rental losses are passive: they offset passive income freely, and up to $25,000/yr can offset ordinary (W-2) income if you actively participate and your MAGI is under $100k (phasing out to $0 by $150k); unused losses carry forward. On sale, claimed depreciation is recaptured at up to 25%, and gains may owe capital-gains tax (a 1031 exchange can defer both). Figures are a year-1 estimate at your 24.0% rate — not tax advice; consult a CPA.
Schools (NCES district)
- District
- Nixa Public Schools
- NCES district ID
- 2922530
- Math proficiency
- 66% ▲ 8.00%
- Reading proficiency
- 65% ▲ 4.00%
- Median HH income
- $54,073
- Composite
- 56.04/100
- National rank
- #1186
- State rank
- #6 of 324 in MO
Livability — Nixa
- Score
- 74/100
- State rank
- #68
- US rank
- #4558
Category grades
Schools grade is shown separately in the Schools card above.
Census & demographics
- Census place
- Nixa, MO
- County
- Christian County · 70,465 people
- City population
- 37,013
- Metro
- Springfield, MO
- Population (ZIP)
- 37,013
- Household income
- $86,765
- Rent vs Own
- Severe rent burden
- 769.0
Population outlook (Christian County) Hauer SSP2
- Today (2025)
- 95,071 people
- By 2030
- 100,379 · +5.6%
- By 2040
- 109,902 · +15.6%
- By 2050
- 117,487 · +23.6%
- By 2075
- 130,738 · +37.5%
- By 2100
- 131,730 · +38.6%
Race, ethnicity, and origin ACS 2023
- Neighborhood character
- Predominantly White (89%)
- Race & ethnicity
- White 89% Two or more races 4% Hispanic / Latino 4% Asian 2% Black 1%
- Common ancestry
- Italian 3% Slovak 3% Lithuanian 2%
- Foreign-born
- 4% · Canada, Vietnam
- Languages at home
- 94% English-only · Spanish 3% Russian/Polish/Slavic 2% Vietnamese 1%
Political lean MEDSL · Christian
- 2024 margin
- Solid R (+52.2) · D 23.3% · R 75.6% · Other 1.1%
- 2008→2024 swing
- -16.4pp toward R · 2008: -35.8pp · 2024: -52.2pp
- All cycles
- 2024: R+52.2 2020: R+50.8 2016: R+54.2 2012: R+46.5 2008: R+35.8
Not yet ingested
- Civics
- —
Market trends
- HPI YoY
- ▼ -71.42%
- Current HPI
- 213.8371
- Rent YoY
- ▲ 5.67%
- Metro
- Springfield, MO
- State GDP YoY
- ▲ 1.84%
- F500 in state
- 20
Industry mix (Fortune 500 HQ in MO)
| Industry | F500 HQs | Revenue |
|---|---|---|
| Healthcare | 1 | $163B |
|
||
| Insurance | 1 | $21B |
|
||
| Industrial Technology | 1 | $17B |
|
||
| Retail | 1 | $16B |
|
||
| Industrial Distribution | 1 | $10B |
|
||
| Utilities | 1 | $9B |
|
||
Price history
3 events — show timeline
- 2026-05-25 Pending — SOMO
- 2026-05-12 Listed $289,900 SOMO
- 2003-06-18 Sold (Public Records) — Public Records
Property tax history
+2.9%/yrLatest (2025): $1,906 · +5.6% YoY. Source: county tax records.
Cash-flow waterfall
monthlySold comps — $/sqft
last 12 mo · ≤1 miLoading sold comps…