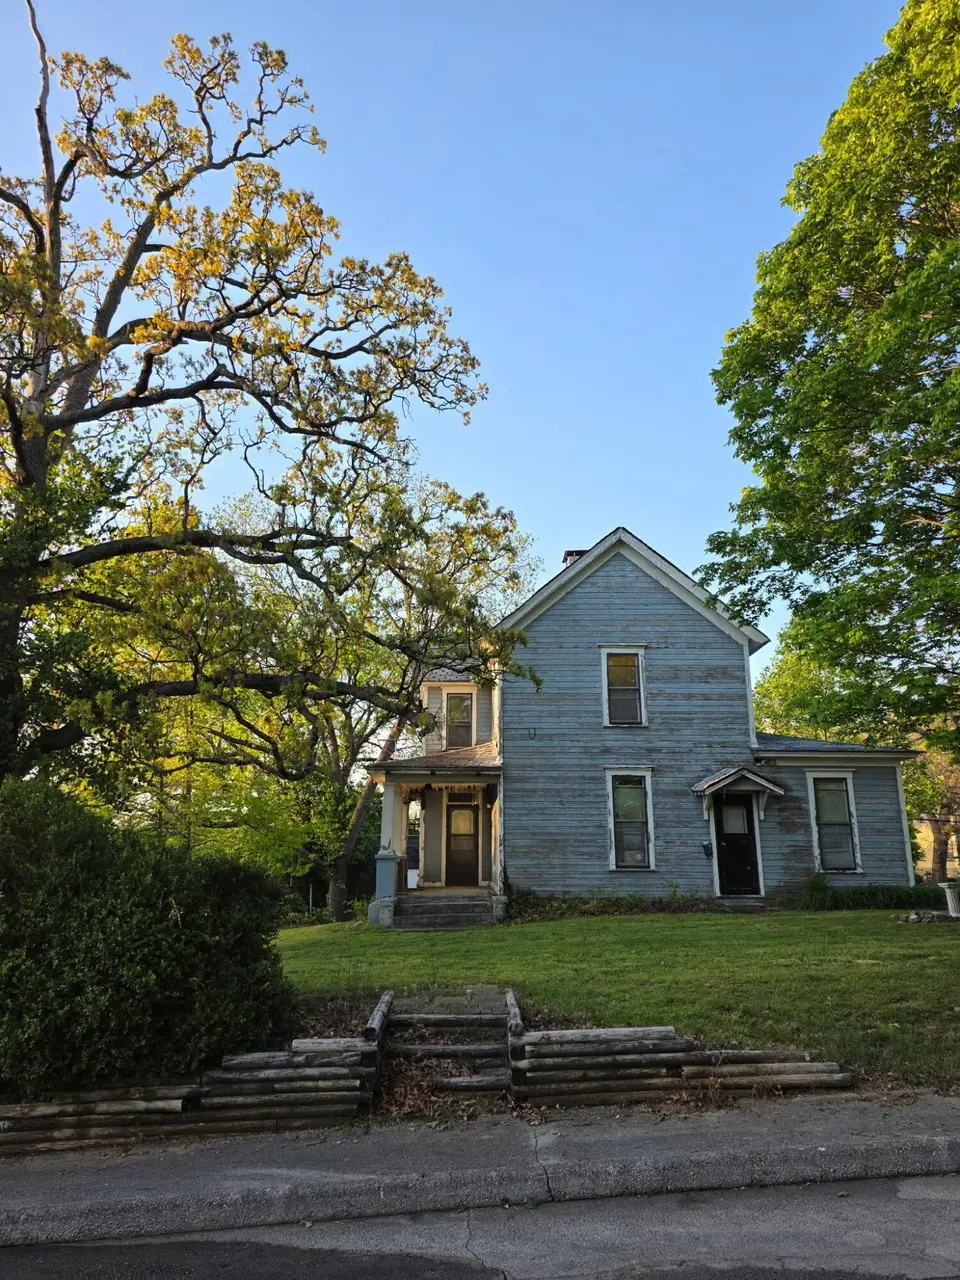
328 N Mccanse St · Mount Vernon, MO
Flood risk 1/10 · Minimal
- FEMA flood zone
- X (unshaded)
- Chance of flooding over 30 yrs
- 0.0%
- Est. flood insurance / yr
- $507 – $1,088
Fire risk 4/10 · Minor
- Est. fire insurance / yr
- $1,054 – $1,958
Heat risk 5/10 · Moderate
- Hot days now (above 105°F)
- 7 days/yr
- Hot days in 30 yrs
- 19 days/yr
Wind risk 2/10 · Minimal
- Chance of severe wind over 30 yrs
- 1.0%
Air-quality risk 2/10 · Minimal
- Unhealthy air days now
- 1 days/yr
- Unhealthy air days in 30 yrs
- 2 days/yr
Risk factors via First Street. Map © Google.
Why this score? — see what drove the B- grade
The composite is a weighted blend of 9 inputs, each scored 0–100. Each bar is that input's sub-score; the figure is the points it added to the 100-point composite (weight × sub-score).
- Cash flow +30.0/30.0
- 1% rule +10.0/10.0
- DSCR +10.0/10.0
- ARV discount +7.5/15.0
- Livability +3.6/5.0
- Schools +3.5/10.0
- Rent growth +2.5/5.0
- Condition / age +1.0/5.0
- Appreciation +0.0/10.0
$69,900
🖨 Deal sheet 📄 Offer letter ✓ Due diligence
Listing remarks
As-Is ready to be flipped!Charming opportunity on 328 N McCanse -- a classic home in a picturesque neighborhood full of Victorian charm, tree-lined sidewalks, and character homes. Featuring beautiful original trim and hardwood floors, a stunning fireplace, and a clean slate inside, it's ready to be completely transformed into your dream renovation. A true blank canvas brimming with potential. Use Caution, front porch and kitchen floor may be unsafe. Not responsible for accidents. Black and white shed, mower and personal items not for sale.
Key facts
- Stunning fireplace
- Hardwood floors
- 7,841 sq ft lot
Tags
Property features AI
Exterior
- Utilities: Public water; Public sewer
- Home design: Single-family residence; Two levels
- Exterior features: Shed(s) and outbuilding on the property; Lot approximately 70 x 112 (0.18 acre)
Interior
- Bedrooms: Two-story home (bedroom locations not specified)
- Bathrooms: 2 full bathrooms
- Heating & cooling: Central heating (electric); Central air conditioning
- Interior features: Fireplace; Ceiling fan(s); Main level laundry
- Laundry & utility: Laundry on the main level
Neighborhood map
What this means for you Summary
Snapshot
- This is a 3-bed/2.0-bath single-family listed at $70k. Condition is rated poor.
Deal economics
- At list price, monthly cash flow is $806 ($10k/yr) — positive.
- The deal already cash-flows at list — no discount required.
- Meets the 1% rule at list price ($2k rent vs $70k).
- Recommended offer: $68k (3.0% below list) — sets the bar for market timing.
- Cap rate 20.1% vs local median 4.3% in Mount Vernon — top-decile yield for the area; either an underpriced asset or a hidden risk that comps aren't pricing in. Stress-test before assuming the spread holds.
Location & tenants
- Location reads 72/100 on livability (#98 in MO) — a middle-class / working-renter tenant base. Strengths: crime A+, cost of living A+, housing A+; Watch: amenities F, commute F, employment F.
- Mt. Vernon R-V (town): math 35% / reading 48% proficiency, ranked #129 of 324 in MO (top 40%) — families likely to look elsewhere, expect single-tenant / working-renter base with shorter leases.
- Zoned schools: Mt. Vernon Elem. (308 students, 53% FRL); Mt. Vernon Middle (math 36% / reading 43%, grade F, #189 of 391 statewide, top 51%, 361 students, 48% FRL); Mt. Vernon High (math 17% / reading 52%, grade F, #321 of 521 statewide, top 67%, 458 students, 37% FRL) — zoned schools at 46% FRL track the district average.
- Market conditions: 87 active listings in the ZIP; 2 comparable units currently listed for rent nearby; 67 units permitted in Lawrence County in 2024 (35 in 5+ unit buildings).
Forward outlook
- Local home prices are declining (-3.0%/yr); year-one equity from $483 of loan paydown is wiped out by about $2k of value loss. Plan a longer hold.
- Lawrence County population projected at -15% by 2050 — secular population decline; favor cash flow + early exit over multi-decade hold.
- At projected returns (-3.0% appreciation + 3.0% rent growth), your $20k cash investment doubles in ~3 years — after that, you're playing with house money.
Negotiation context
- It's been on market 59 days — a 3% lower offer ($68k) is reasonable based on typical stale-listing flexibility.
Risks & watch-outs
- Watch-outs: built in 1925 — expect roof / HVAC / electrical / plumbing capex.
- Climate carrying-cost: extreme-heat days projected 7→19/yr by 2055 (HVAC capex compounding) — expect insurance premiums to compound above CPI over the hold.
Questions for the listing agent
- It's been on market 59 days. Have you received any prior offers? Is the seller open to a 3% concession, seller financing, or rate buy-down credit?
- Have any recent inspections been done? Can we get a copy of the seller's disclosures and any deferred-maintenance estimates?
- Built in 1925 — when were the roof, HVAC, electrical panel, plumbing, and water heater last replaced?
- Is there a deadline driving the sale (1031 exchange, divorce, estate, relocation)? That informs how much negotiation room exists.
- What's the average days-on-market for RENTAL listings here right now (not sales)? A rising rental-DOM trend means longer vacancies and softer asking-rent achievability than the comps imply.
- What's the recent tenant-quality profile in this submarket — average credit score on applications, eviction rate, late-payment / NSF rate, and stable-employment percentage? A property-management company in the area should have these aggregated.
- How much new for-sale + rental construction is in the pipeline within 1–3 miles? Heavy new supply typically softens prices + rents 12–24 months out; constrained supply supports both.
Investment metrics
- 1% rule
- 2.33% ✓
- Cap rate
- 20.12%
- Cash-on-cash
- 49.39%
- DSCR
- 3.20
- GRM
- 3.6
CMA / ARV
- ARV (on-the-fly)
- $232,000
- Comps found
- 12
Show comp detail 12 sales within ~0.75 mi
| Address | Dist | Beds/Ba | Sqft | Sold | Price | $/sf | Match |
|---|---|---|---|---|---|---|---|
| 559 E Pleasant St | 0.13mi | 3/2.0 | 1,556 (-3%) | 1mo | $225,000 | $145 | 89 |
| 515 E Center St | 0.11mi | 3/2.0 | 1,579 (-1%) | 9mo | $239,000 | $151 | 85 |
| 530 E Center St | 0.18mi | 3/1.0 | 1,479 (-8%) | 2mo | $189,900 | $128 | 73 |
| 1007 S Walnut Terrace Dr | 0.43mi | 3/2.0 | 1,567 (-2%) | 9mo | $175,000 | $112 | 69 |
| 103 S Landrum St | 0.48mi | 3/2.0 | 1,495 (-7%) | 0mo | $199,990 | $134 | 66 |
| 922 Shafer St | 0.54mi | 4/2.0 (+1) | 1,540 (-4%) | 2mo | $225,000 | $146 | 62 |
| 1161 Robins Nest Hl | 0.64mi | 3/2.0 | 1,536 (-4%) | 3mo | $250,000 | $163 | 61 |
| 400 S East St | 0.26mi | 2/2.0 (-1) | 1,454 (-9%) | 11mo | $249,500 | $172 | 58 |
| 613 King St | 0.23mi | 3/1.5 | 1,388 (-13%) | 9mo | $214,000 | $154 | 58 |
| 710 King St | 0.32mi | 3/2.0 | 1,839 (+15%) | 6mo | $190,000 | $103 | 55 |
| 704 King St | 0.29mi | 3/1.5 | 1,831 (+14%) | 8mo | $259,900 | $142 | 54 |
| 917 Wood St | 0.74mi | 3/2.0 | 1,625 (+2%) | 11mo | $175,000 | $108 | 53 |
Match score weights: distance 35% · size 25% · config 20% · recency 20%. Top-matched comps best support the ARV.
Projected returns pro-forma
-3.0% appreciation · 3.0% rent growth · sell at horizon
- IRR
- 47.0%
- Equity multiple
- 3.04×
- Total profit
- $40,003
- Equity at exit
- $10,422
- IRR
- 52.7%
- Equity multiple
- 6.16×
- Total profit
- $100,997
- Equity at exit
- $6,044
Cash invested: $19,572 (down + closing). Projections, not guarantees.
Landlord ↔ Tenant lean methodology
- Overall (STATE)
- 81 Strongly Landlord-Friendly
- State Missouri
- 81 Strongly Landlord-Friendly · R+10
- County
- — inherits STATE
- City
- — inherits STATE
ZIP-level market 65712
- Home prices YoY
- -17.5%
- Active inventory
- 87
- Price-to-rent
- 3.6×
Monthly cashflow live
- Estimated rent
- $1,631 medium interval (Pro) →
- Mortgage (P&I)
- −$367
- Tax est. 1.5%
- −$87 /mo · $1,048/yr
- Insurance
- −$29
- HOA
- −$0
- Vacancy / Maint / Mgmt
- −$343
- Net cashflow
- $806
Break-even live
UW: 25.0% down · 7.5% · 30yr · 1.5% tax · 5.0% vac · 8.0% maint · 8.0% mgmt
Financing live
Cash to close
- Down payment
- $17,475
- Closing costs
- $2,097
- Reserves months
- —
- Total cash needed
- —
Loan-product check · same deal, 3 products live
Conventional
25% down · 7.5% · 30yr
- Down + closing
- —
- Monthly P&I
- —
- Monthly cashflow
- —
- DSCR
- —
- Eligible?
- —
Personal DTI + credit; lowest rate.
DSCR
20% down · 8.5% · 30yr
- Down + closing
- —
- Monthly P&I
- —
- Monthly cashflow
- —
- DSCR
- —
- Eligible?
- —
No personal income docs; deal must DSCR.
Hard money
10% down · 12.0% · 12mo
- Down + closing
- —
- Monthly P&I
- —
- Monthly cashflow
- —
- DSCR
- —
- Eligible?
- —
Short-term bridge; refi at stabilization.
Rent comps 2 comps
| Address | Beds | Baths | Sqft | Rent | $/sqft | DOM | Units | Dist |
|---|---|---|---|---|---|---|---|---|
| 212 W Blaze Rd Mount Vernon, MO | 3.0 | 2.0 | 1600 | $1,650 | $1.03 | 13d | 1 | 0.47mi |
| 1706 S Hazel St Mt Vernon, MO | 3.0 | 2.0 | 1419 | $1,595 | $1.12 | 13d | 1 | 0.79mi |
Listing history 16 events
-
2026-06-18days on market $69,900 Active 59 DOM
-
2026-06-17days on market $69,900 Active 58 DOM
-
2026-06-16days on market $69,900 Active 57 DOM
-
2026-06-15days on market $69,900 Active 56 DOM
-
2026-06-14days on market $69,900 Active 54 DOM
-
2026-06-13days on market $69,900 Active 53 DOM
-
2026-06-10days on market $69,900 Active 51 DOM
-
2026-06-09days on market $69,900 Active 50 DOM
-
2026-06-08days on market $69,900 Active 49 DOM
-
2026-06-07days on market $69,900 Active 48 DOM
-
2026-06-03days on market $69,900 Active 44 DOM
-
2026-06-02days on market $69,900 Active 43 DOM
-
2026-06-01days on market $69,900 Active 42 DOM
-
2026-05-31days on market $69,900 Active 41 DOM
-
2026-05-30days on market $69,900 Active 40 DOM
-
2026-04-20$69,900 Active
ⓘ Source: listings_history table (triggers on properties + properties_extension) + one-shot
backfill from property_details.listing_events for pre-trigger history.
Climate risk First Street
- Flood 1/10 Low FEMA zone X (unshaded) · 0% chance over 30 yrs
- Wildfire 4/10 Moderate
- Heat 5/10 Major 7 d/yr ≥105°F today · 19 d/yr by 30 yrs out
- Wind 2/10 Low 100% chance of damaging wind over 30 yrs
- Air quality 2/10 Low 1 unhealthy d/yr today · 2 by 30 yrs out
Nearby sold comps map
Loading sold comps map…
Walkable amenities ~0.75 mi
Loading nearby amenities…
Taxation est. · year 1
- Rental income
- $19,574
- − Mortgage interest
- −$3,915
- − Property taxes
- −$1,048
- − Insurance
- −$350
- − Repairs & maintenance
- −$1,566
- − Management
- −$1,566
- − Depreciation
- −$2,033
- Taxable income
- $9,095
- Est. tax owed @ 24.0%
- −$2,183
- After-tax cash flow
- $7,484/yr
For passive investors: Depreciation is non-cash, so a rental often shows a tax loss while cash-flowing — sheltering income. Rental losses are passive: they offset passive income freely, and up to $25,000/yr can offset ordinary (W-2) income if you actively participate and your MAGI is under $100k (phasing out to $0 by $150k); unused losses carry forward. On sale, claimed depreciation is recaptured at up to 25%, and gains may owe capital-gains tax (a 1031 exchange can defer both). Figures are a year-1 estimate at your 24.0% rate — not tax advice; consult a CPA.
Condition & rehab AI · 12 photos
This property requires extensive repairs and updates to bring it up to a livable condition. Significant investment is needed to address the unsafe flooring and siding issues, as well as paint touch-ups. Once renovated, it has the potential to be a charming and attractive home.
Repairs flagged
- Major Kitchen flooring — Severe damage
- Major Bathroom flooring — Severe damage
- Major Exterior siding — Weathered and possibly rotting
Value-add opportunities
- Resale New kitchen flooring — Improves safety and appearance
- Resale New bathroom flooring — Improves safety and appearance
- Resale New exterior siding — Enhances curb appeal and durability
Renovation cost estimate screening
| Repair item | Severity | Est. cost |
|---|---|---|
| Kitchen flooring · Severe damage | Major | $15,000–50,000 |
| Bathroom flooring · Severe damage | Major | $15,000–50,000 |
| Exterior siding · Weathered and possibly rotting | Major | $15,000–50,000 |
| Total estimated repair cost · 3 items | $45,000–150,000 |
Value-add ROI direction
- Resale New kitchen flooring — Improves safety and appearance ↑
- Resale New bathroom flooring — Improves safety and appearance ↑
- Resale New exterior siding — Enhances curb appeal and durability ↑
ⓘ Cost ranges are severity-bucket heuristics (US national rule-of-thumb). Get contractor quotes + a written scope before underwriting a rehab budget.
Schools (NCES district)
- District
- Mt. Vernon R-V
- NCES district ID
- 2921600
- Math proficiency
- 35% ▼ -4.00%
- Reading proficiency
- 48% ▼ -1.00%
- Median HH income
- $43,114
- Composite
- 35.03/100
- National rank
- #5040
- State rank
- #129 of 324 in MO
Livability — Mount Vernon
- Score
- 72/100
- State rank
- #98
- US rank
- #6475
Category grades
Schools grade is shown separately in the Schools card above.
Census & demographics
- Census place
- Mount Vernon, MO
- Population (ZIP)
- 8,910
Population outlook (Lawrence County) Hauer SSP2
- Today (2025)
- 37,142 people
- By 2030
- 36,212 · -2.5%
- By 2040
- 34,080 · -8.2%
- By 2050
- 31,621 · -14.9%
- By 2075
- 25,987 · -30.0%
- By 2100
- 20,151 · -45.7%
Race, ethnicity, and origin ACS 2023
- Neighborhood character
- Predominantly White (94%)
- Race & ethnicity
- White 94% Two or more races 4% Hispanic / Latino 2%
- Common ancestry
- Lithuanian 3% Slovak 2% Iranian 2%
- Foreign-born
- 2% · Canada
- Languages at home
- 95% English-only · Other Indo-European 2% Spanish 2% German/W. Germanic 1%
Political lean MEDSL · Lawrence
- 2024 margin
- Solid R (+63.8) · D 17.6% · R 81.5%
- 2008→2024 swing
- -26.8pp toward R · 2008: -37.1pp · 2024: -63.8pp
- All cycles
- 2024: R+63.8 2020: R+62.6 2016: R+61.1 2012: R+47.0 2008: R+37.1
Not yet ingested
- Civics
- —
Market trends
- HPI YoY
- ▼ -51.55%
- Current HPI
- 243.6185
- Rent YoY
- —
- Metro
- —
- State GDP YoY
- ▲ 1.84%
- F500 in state
- 20
Industry mix (Fortune 500 HQ in MO)
| Industry | F500 HQs | Revenue |
|---|---|---|
| Healthcare | 1 | $163B |
|
||
| Insurance | 1 | $21B |
|
||
| Industrial Technology | 1 | $17B |
|
||
| Retail | 1 | $16B |
|
||
| Industrial Distribution | 1 | $10B |
|
||
| Utilities | 1 | $9B |
|
||
Price history
1 event — show timeline
- 2026-04-20 Listed $69,900 SOMO
Cash-flow waterfall
monthlySold comps — $/sqft
last 12 mo · ≤1 miLoading sold comps…