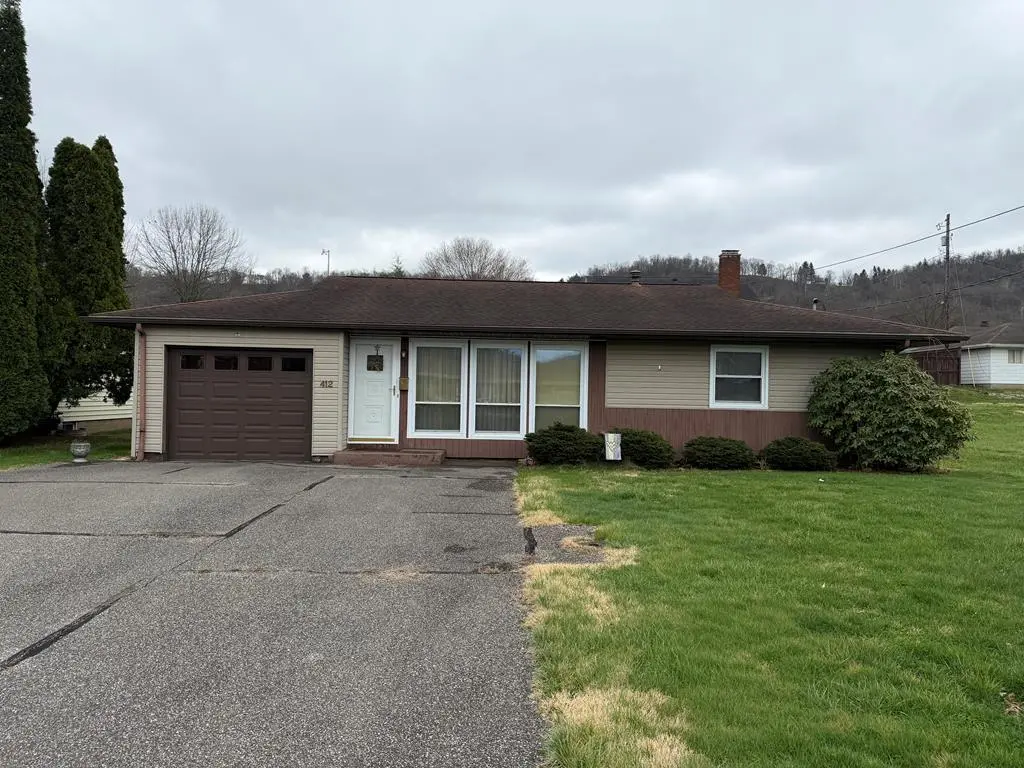
412 N 2nd Ave · Paden City, WV
Flood risk 7/10 · Major
- FEMA flood zone
- X (unshaded)
- Chance of flooding over 30 yrs
- 0.76%
- Est. flood insurance / yr
- $473 – $860
Fire risk 1/10 · Minimal
- Est. fire insurance / yr
- $787 – $1,461
Heat risk 4/10 · Minor
- Hot days now (above 99°F)
- 8 days/yr
- Hot days in 30 yrs
- 20 days/yr
Wind risk 1/10 · Minimal
- Chance of severe wind over 30 yrs
- 0.0%
Air-quality risk 2/10 · Minimal
- Unhealthy air days now
- 0 days/yr
- Unhealthy air days in 30 yrs
- 1 days/yr
Risk factors via First Street. Map © Google.
Why this score? — see what drove the B grade
The composite is a weighted blend of 9 inputs, each scored 0–100. Each bar is that input's sub-score; the figure is the points it added to the 100-point composite (weight × sub-score).
- Cash flow +24.7/30.0
- ARV discount +15.0/15.0
- Appreciation +9.7/10.0
- DSCR +8.0/10.0
- 1% rule +5.8/10.0
- Livability +3.2/5.0
- Rent growth +2.5/5.0
- Condition / age +2.5/5.0
- Schools +2.4/10.0
$89,900
🖨 Deal sheet 📄 Offer letter ✓ Due diligence
Listing remarks
If you are looking for 1st floor living and or 1st time home buyer then you need to check out this property. This home is centrally located close to the elementary school with a flat backyard and out building. The home offers 3 bedrooms, 1.5 baths and a full unfinished basement with a 1 car attached garage. The home has been vacant and without utilities for awhile. All measurements are approximate. Call today for your private showing.
Key facts
- 1st floor living
- Out building
- Centrally located
Tags
Property features AI
Exterior
- Parking: Attached garage (1 car); Concrete driveway/parking
- Utilities: Public water; Public sewer
- Home design: Single-family ranch residence; 1 story
- Construction: Aluminum siding; Shingle roof
- Exterior features: Porch; Outbuilding; Workshop; Level lot
Interior
- Kitchen: Range; Refrigerator
- Bedrooms: Total of 6 rooms (includes bedrooms and living spaces)
- Bathrooms: 1 full bathroom; 1 half bathroom
- Heating & cooling: Forced-air heating (natural gas); Central air conditioning
- Interior features: Range; Refrigerator; Gas water heater; Full basement
- Laundry & utility: Gas water heater
Neighborhood map
What this means for you Summary
Snapshot
- This is a 3-bed/1.5-bath single-family listed at $90k.
Deal economics
- At list price, monthly cash flow is $133 ($2k/yr) — positive.
- The deal already cash-flows at list — no discount required.
- Meets the 1% rule at list price ($968 rent vs $90k).
Location & tenants
- Location reads 64/100 on livability (#133 in WV) — a middle-class / working-renter tenant base. Strengths: crime A+, cost of living A+, housing A; Watch: schools D, employment D, amenities F.
- Wetzel County Schools (town): math 25% / reading 33% proficiency, ranked #36 of 55 in WV (top 66%) — low school quality limits family demand, transient renter base, plan for 1-2y turnover.
- Market conditions: 12 active listings in the ZIP.
Forward outlook
- In year one you build about $9k of equity ($622 loan paydown + $8k appreciation (9.4% local appreciation)).
- Wetzel County population projected at -28% by 2050 — secular population decline; favor cash flow + early exit over multi-decade hold.
- At projected returns (9.4% appreciation + 3.0% rent growth), your $25k cash investment doubles in ~3 years — after that, you're playing with house money.
- By year 4, paydown + projected appreciation supports a ~$32k cash-out refi (75% LTV) — recoverable capital for the next deal without selling this one.
Negotiation context
- Only 4 days on market — expect competitive offers; lowballing is unlikely to land.
Risks & watch-outs
- Watch-outs: flood insurance adds $56/mo; built in 1957 — expect roof / HVAC / electrical / plumbing capex.
- Climate carrying-cost: major flood risk — expect insurance premiums to compound above CPI over the hold.
Questions for the listing agent
- Built in 1957 — when were the roof, HVAC, electrical panel, plumbing, and water heater last replaced?
- What's the actual annual flood-insurance premium (NFIP or private), and is the property in a SFHA with mandatory coverage?
- Is there a deadline driving the sale (1031 exchange, divorce, estate, relocation)? That informs how much negotiation room exists.
- Schools are D-rated, which usually means shorter tenancies and higher turnover. Who's the typical renter profile here, and what's been the actual vacancy rate?
- What's the average days-on-market for RENTAL listings here right now (not sales)? A rising rental-DOM trend means longer vacancies and softer asking-rent achievability than the comps imply.
- What's the recent tenant-quality profile in this submarket — average credit score on applications, eviction rate, late-payment / NSF rate, and stable-employment percentage? A property-management company in the area should have these aggregated.
- How much new for-sale + rental construction is in the pipeline within 1–3 miles? Heavy new supply typically softens prices + rents 12–24 months out; constrained supply supports both.
Investment metrics
- 1% rule
- 1.08% ✓
- Cap rate
- 8.81%
- Cash-on-cash
- 8.98%
- DSCR
- 1.40
- GRM
- 7.7
CMA / ARV
- ARV (on-the-fly)
- $136,532
- Comps found
- 12
Show comp detail 12 sales within ~0.75 mi
| Address | Dist | Beds/Ba | Sqft | Sold | Price | $/sf | Match |
|---|---|---|---|---|---|---|---|
| 412 N 2nd Ave | 0.00mi | 3/1.5 | 1,276 (0%) | 1mo | $91,000 | $71 | 99 |
| 312 N 1st Ave | 0.17mi | 3/1.5 | 1,264 (-1%) | 10mo | $160,000 | $127 | 82 |
| 726 N 4th Ave | 0.20mi | 3/1.0 | 1,294 (+1%) | 5mo | $38,500 | $30 | 82 |
| 135 North 3rd Ave | 0.35mi | 3/1.0 | 1,264 (-1%) | 5mo | $158,000 | $125 | 76 |
| 617 N 7th Ave | 0.22mi | 3/1.0 | 1,228 (-4%) | 8mo | $68,000 | $55 | 75 |
| 705 North 7th Ave | 0.25mi | 3/2.5 | 1,270 (-0%) | 11mo | $175,000 | $138 | 74 |
| 216 North 2nd Ave | 0.25mi | 3/1.0 | 1,318 (+3%) | 12mo | $141,500 | $107 | 71 |
| 713 N 8th Ave | 0.31mi | 2/1.0 (-1) | 1,392 (+9%) | 6mo | $35,000 | $25 | 58 |
| 914 Meadow Hts | 0.45mi | 3/2.0 | 1,400 (+10%) | 7mo | $90,000 | $64 | 55 |
| 112 Helen St | 0.70mi | 4/1.5 (+1) | 1,313 (+3%) | 4mo | $125,000 | $95 | 54 |
| 203 S 2nd Ave | 0.63mi | 3/2.0 | 1,144 (-10%) | 3mo | $159,000 | $139 | 49 |
| 126 North 7th Ave | 0.48mi | 2/1.0 (-1) | 1,134 (-11%) | 6mo | $130,000 | $115 | 47 |
Match score weights: distance 35% · size 25% · config 20% · recency 20%. Top-matched comps best support the ARV.
Projected returns pro-forma
9.37% appreciation · 3.0% rent growth · sell at horizon
- IRR
- 27.6%
- Equity multiple
- 3.13×
- Total profit
- $53,578
- Equity at exit
- $76,874
- IRR
- 24.3%
- Equity multiple
- 6.97×
- Total profit
- $150,274
- Equity at exit
- $161,590
Cash invested: $25,172 (down + closing). Projections, not guarantees.
Landlord ↔ Tenant lean methodology
- Overall (STATE)
- 83 Strongly Landlord-Friendly
- State West Virginia
- 83 Strongly Landlord-Friendly · R+22
- County
- — inherits STATE
- City
- — inherits STATE
ZIP-level market 26159
- Home prices YoY
- 5.5%
- Active inventory
- 12
- Price-to-rent
- 7.7×
Monthly cashflow live
- Estimated rent
- $968 medium interval (Pro) →
- Mortgage (P&I)
- −$471
- Tax from tax record
- −$67 /mo · $808/yr
- Insurance
- −$37
- Flood insurance flood zone
- −$56 /mo · $666/yr
- HOA
- −$0
- Vacancy / Maint / Mgmt
- −$203
- Net cashflow
- $133
Break-even live
UW: 25.0% down · 7.5% · 30yr · 1.5% tax · 5.0% vac · 8.0% maint · 8.0% mgmt
Financing live
Cash to close
- Down payment
- $22,475
- Closing costs
- $2,697
- Reserves months
- —
- Total cash needed
- —
Loan-product check · same deal, 3 products live
Conventional
25% down · 7.5% · 30yr
- Down + closing
- —
- Monthly P&I
- —
- Monthly cashflow
- —
- DSCR
- —
- Eligible?
- —
Personal DTI + credit; lowest rate.
DSCR
20% down · 8.5% · 30yr
- Down + closing
- —
- Monthly P&I
- —
- Monthly cashflow
- —
- DSCR
- —
- Eligible?
- —
No personal income docs; deal must DSCR.
Hard money
10% down · 12.0% · 12mo
- Down + closing
- —
- Monthly P&I
- —
- Monthly cashflow
- —
- DSCR
- —
- Eligible?
- —
Short-term bridge; refi at stabilization.
Listing history 2 events
-
2026-04-14status Pending
-
2026-04-09$89,900 Active
ⓘ Source: listings_history table (triggers on properties + properties_extension) + one-shot
backfill from property_details.listing_events for pre-trigger history.
Tax reassessment forecast WV · Resets to sale price
- Current annual tax
- $808 · $67/mo
- Projected year-2 tax
- $808 · $67/mo
- Expected delta
- $0/yr ($0/mo · 0.0%)
ⓘ Screening estimate from a state-policy table — verify with the county assessor before closing.
Climate risk First Street
- Flood 7/10 Severe FEMA zone X (unshaded) · 76% chance over 30 yrs
- Wildfire 1/10 Low
- Heat 4/10 Moderate 8 d/yr ≥99°F today · 20 d/yr by 30 yrs out
- Wind 1/10 Low 0% chance of damaging wind over 30 yrs
- Air quality 2/10 Low 0 unhealthy d/yr today · 1 by 30 yrs out
Nearby sold comps map
Loading sold comps map…
Walkable amenities ~0.75 mi
Loading nearby amenities…
Taxation est. · year 1
- Rental income
- $11,615
- − Mortgage interest
- −$5,036
- − Property taxes
- −$808
- − Insurance
- −$1,116
- − Repairs & maintenance
- −$929
- − Management
- −$929
- − Depreciation
- −$2,615
- Taxable income
- $182
- Est. tax owed @ 24.0%
- −$44
- After-tax cash flow
- $1,551/yr
For passive investors: Depreciation is non-cash, so a rental often shows a tax loss while cash-flowing — sheltering income. Rental losses are passive: they offset passive income freely, and up to $25,000/yr can offset ordinary (W-2) income if you actively participate and your MAGI is under $100k (phasing out to $0 by $150k); unused losses carry forward. On sale, claimed depreciation is recaptured at up to 25%, and gains may owe capital-gains tax (a 1031 exchange can defer both). Figures are a year-1 estimate at your 24.0% rate — not tax advice; consult a CPA.
Schools (NCES district)
- District
- Wetzel County Schools
- NCES district ID
- 5401560
- Math proficiency
- 25% ▼ -11.00%
- Reading proficiency
- 33% ▼ -8.00%
- Median HH income
- $38,296
- Composite
- 24.22/100
- National rank
- #7726
- State rank
- #36 of 55 in WV
Livability — Paden City
- Score
- 64/100
- State rank
- #133
- US rank
- #13654
Category grades
Schools grade is shown separately in the Schools card above.
Census & demographics
- Census place
- Paden City, WV
- City population
- 2,523
- Population (ZIP)
- 2,523
Population outlook (Wetzel County) Hauer SSP2
- Today (2025)
- 14,127 people
- By 2030
- 13,248 · -6.2%
- By 2040
- 11,611 · -17.8%
- By 2050
- 10,193 · -27.8%
- By 2075
- 7,753 · -45.1%
- By 2100
- 5,922 · -58.1%
Race, ethnicity, and origin ACS 2023
- Neighborhood character
- Predominantly White (98%)
- Race & ethnicity
- White 98% Two or more races 2%
- Common ancestry
- Slovak 1% Serbian 1% Italian 1%
- Foreign-born
- 0%
- Languages at home
- 99% English-only · German/W. Germanic 1%
Political lean MEDSL · Wetzel
- 2024 margin
- Solid R (+55.5) · D 21.0% · R 76.5% · Other 2.5%
- 2008→2024 swing
- -49.3pp toward R · 2008: -6.2pp · 2024: -55.5pp
- All cycles
- 2024: R+55.5 2020: R+51.8 2016: R+50.3 2012: R+21.6 2008: R+6.2
Not yet ingested
- Civics
- —
Market trends
- HPI YoY
- ▲ 9.37%
- Current HPI
- 179.1787
- Rent YoY
- —
- Metro
- —
- State GDP YoY
- —
- F500 in state
- 0
Price history
2 events — show timeline
- 2026-04-14 Pending — WBOR
- 2026-04-09 Listed $89,900 WBOR
Property tax history
+13.0%/yrLatest (2025): $808 · +11.1% YoY. Source: county tax records.
Cash-flow waterfall
monthlySold comps — $/sqft
last 12 mo · ≤1 miLoading sold comps…