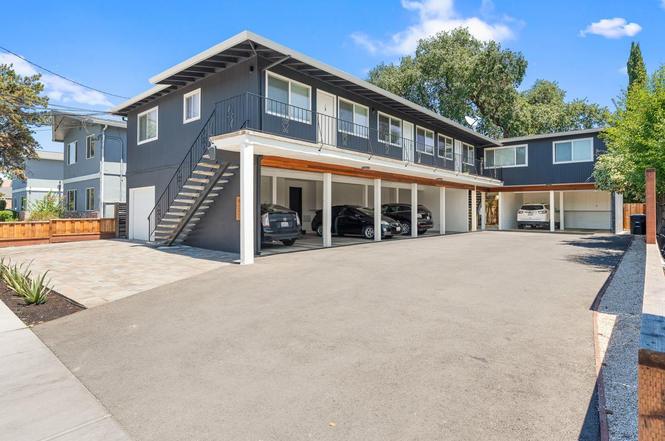
 7-Plex
1151 Davis St · Redwood City, CA
Flood risk 1/10 · Minimal
- FEMA flood zone
- X (shaded)
- Chance of flooding over 30 yrs
- 0.0%
- Est. flood insurance / yr
- $507 – $1,088
Fire risk 1/10 · Minimal
- Est. fire insurance / yr
- $659 – $1,223
Heat risk 3/10 · Minor
- Hot days now (above 94°F)
- 7 days/yr
- Hot days in 30 yrs
- 14 days/yr
Wind risk 1/10 · Minimal
- Chance of severe wind over 30 yrs
- —
Air-quality risk 8/10 · Major
- Unhealthy air days now
- 16 days/yr
- Unhealthy air days in 30 yrs
- 16 days/yr
Risk factors via First Street. Map © Google.
Why this score? — see what drove the C grade
The composite is a weighted blend of 9 inputs, each scored 0–100. Each bar is that input's sub-score; the figure is the points it added to the 100-point composite (weight × sub-score).
- Cash flow +24.4/30.0
- DSCR +7.9/10.0
- Schools +5.8/10.0
- 1% rule +5.7/10.0
- Rent growth +4.2/5.0
- Livability +2.5/5.0
- Condition / age +2.5/5.0
- ARV discount +2.4/15.0
- Appreciation +0.0/10.0
$3,100,000
🖨 Deal sheet 📄 Offer letter ✓ Due diligence
Multi-family units
County records classify this as Multi-Family (5+ Unit). Listing-text estimate: 7 units. confirmed
5+ unit building — per-unit beds/baths from public records are typically unavailable; the breakdown below (if shown) is an estimate from the listing text.
Listing remarks MLS
Introducing 1151 Davis St. in Redwood City. This 7 unit gem is located in a fantastic west of El Camino neighborhood and feature one 2 bedroom, five 1 bedroom and one studio units. Two units benefit from balconies and two others from private yards. All units are uniformly and completely renovated: new kitchens, new bathrooms, flooring, doors, molding, Schlage Smart Locks, etc. All electrical main panels have been upgraded. All but one of the sub-panels has been upgraded. A bike shed featuring top of the line wall mount bike racks was recently constructed onsite. Come see this beautiful turnkey investment opportunity.
Key facts
- New kitchens
- New bathrooms
- 7,059 sq ft lot
Tags
Property features AI
Finance
- Other: Tenant-paid utilities: electric and gas
- Financial info: Gross scheduled income approximately $222,840; Annual rental income approximately $202,740; Annual gross income approximately $216,155; Other income approximately $20,100; Total expenses approximately $73,879; Utility expenses approximately $17,051; Trash expense approximately $4,673; Landscape expense approximately $400; Vacancy factor 3%; Gross rent multiplier 13.91; Unit rents observed: one 2-bed at $3,300; five 1-beds at $2,150 each; one other unit at $1,275
Exterior
- Parking: Covered parking; Attached garage (1 garage space); Six carport spaces (minimum); Total listed parking spaces: 1
- Utilities: Public water; Public sewer; Public utilities service
- Home design: Multifamily property; Single building (one structure)
- Construction: Concrete perimeter foundation
- Exterior features: Composition roof
Interior
- Bedrooms: One 2-bedroom unit; Five 1-bedroom units; One studio/other unit (bedrooms not specified)
- Bathrooms: Each unit includes one full bathroom
- Heating & cooling: Wall furnace heating
- Interior features: Wall furnace heating
- Laundry & utility: Tenants responsible for electric and gas utilities; Separate electric and separate gas meters
Neighborhood map
What this means for you Summary
Snapshot
- This is a 7 × 7-bed/7.0-bath units multifamily listed at $3.10M.
Deal economics
- At list price, monthly cash flow is $6k ($76k/yr) — positive. Per door: $901/mo.
- The deal already cash-flows at list — no discount required.
- Meets the 1% rule at list price ($33k rent vs $3.10M).
- Recommended offer: $2.73M (12.0% below list) — sets the bar for market timing.
- Cap rate 8.7% vs local median 1.3% in Redwood City — top-decile yield for the area; either an underpriced asset or a hidden risk that comps aren't pricing in. Stress-test before assuming the spread holds.
Location & tenants
- Location reads: area grade C — affects rentability + tenant quality, not the cash-flow math above.
- Sequoia Union High (suburban): math 52% / reading 69% proficiency, ranked #159 of 1,400 in CA (top 11%) — acceptable for families but not a draw, mixed tenant base, ~2y average lease.
- Market conditions: Rents rising fast (+6.7%/yr); 62 active listings in the ZIP; high-income renter base; 1,019 units permitted in San Mateo County in 2024 (484 in 5+ unit buildings).
- At $33,140/mo this rent would consume 272% of the median local household income ($146k/yr) (locally 1550% of renters already pay >50% of income on rent) — very limited rent-growth headroom before tenants either downsize or default.
Forward outlook
- Local home prices are declining (-3.0%/yr); year-one equity from $21k of loan paydown is wiped out by about $93k of value loss. Plan a longer hold.
- San Mateo County population projected at +24% by 2050 — long-run rental-demand tailwind backs the buy-and-hold thesis.
- At projected returns (-3.0% appreciation + 6.7% rent growth), your $868k cash investment doubles in ~9 years — after that, you're playing with house money.
Negotiation context
- It's been on market 128 days — a 12% lower offer ($2.73M) is reasonable based on typical stale-listing flexibility.
- 5 sale attempts since 22y ago with the ask held roughly flat each time — persistent listings suggest the price (not the market) is what's stuck; bring a comps-based counter.
- Current owner paid $2.27M; 36% above their basis — modest negotiation headroom, anchor on the comps not their cost.
Questions for the listing agent
- It's been on market 128 days. Have you received any prior offers? Is the seller open to a 12% concession, seller financing, or rate buy-down credit?
- Can we see the unit-by-unit rent roll, current vacancy, and any below-market leases? What's the average tenancy length?
- What capital expenditures (roof, boiler, parking lot, exteriors) have been made in the last 5 years, and what's planned in the next 2?
- Built in 1961 — when were the roof, HVAC, electrical panel, plumbing, and water heater last replaced?
- Why hasn't it sold? Are there any deal-killer items the seller is aware of (foundation, flood, title, zoning, code violations)?
- Is there a deadline driving the sale (1031 exchange, divorce, estate, relocation)? That informs how much negotiation room exists.
- What's the average days-on-market for RENTAL listings here right now (not sales)? A rising rental-DOM trend means longer vacancies and softer asking-rent achievability than the comps imply.
- What's the recent tenant-quality profile in this submarket — average credit score on applications, eviction rate, late-payment / NSF rate, and stable-employment percentage? A property-management company in the area should have these aggregated.
- How much new apartment / multifamily construction is in the pipeline within 1–3 miles? Heavy new supply (>2% of stock underway) typically softens rents 12–24 months out; light construction supports rent growth.
Investment metrics
- 1% rule
- 1.07% ✓
- Cap rate
- 8.73%
- Cash-on-cash
- 8.72%
- DSCR
- 1.39
- GRM
- 7.8
CMA / ARV
- ARV (on-the-fly)
- $2,782,550
- Comps found
- 4
Show comp detail 4 sales within ~0.75 mi
| Address | Dist | Beds/Ba | Sqft | Sold | Price | $/sf | Match |
|---|---|---|---|---|---|---|---|
| 1011-1013 Hudson St | 0.21mi | 9/7.0 (+1) | 5,084 (-8%) | 17mo | $3,400,000 | $669 | 58 |
| 146 Madison Ave | 0.42mi | 9/7.0 (+1) | 5,944 (+8%) | 7mo | $3,000,000 | $505 | 56 |
| 517 Vera Ave | 0.20mi | 9/6.0 (+1) | 6,249 (+13%) | 9mo | $2,890,000 | $462 | 52 |
| 134 Bonita Ave | 0.69mi | 8/4.0 | 4,838 (-12%) | 0mo | $2,060,000 | $426 | 35 |
Match score weights: distance 35% · size 25% · config 20% · recency 20%. Top-matched comps best support the ARV.
Projected returns pro-forma
-3.0% appreciation · 6.7% rent growth · sell at horizon
- IRR
- 0.8%
- Equity multiple
- 1.03×
- Total profit
- $26,701
- Equity at exit
- $462,220
- IRR
- 13.7%
- Equity multiple
- 2.27×
- Total profit
- $1,105,114
- Equity at exit
- $268,031
Cash invested: $868,000 (down + closing). Projections, not guarantees.
Landlord ↔ Tenant lean methodology
- Overall (STATE)
- 18 Strongly Tenant-Friendly
- State California
- 18 Strongly Tenant-Friendly · D+13
- County
- — inherits STATE
- City
- — inherits STATE
ZIP-level market 94061
- Rents YoY
- 6.7%
- Active inventory
- 62
- Price-to-rent
- 54.6×
Monthly cashflow live
- Estimated rent
- $33,140 medium interval (Pro) →
- Mortgage (P&I)
- −$16,257
- Tax from tax record
- −$2,328 /mo · $27,933/yr
- Insurance
- −$1,292
- HOA
- −$0
- Vacancy / Maint / Mgmt
- −$6,959
- Net cashflow
- $6,304
Break-even live
7-unit breakdown (identical units grouped — click to expand)
| Units | Beds | Baths | Est. rent |
|---|---|---|---|
| 7× units | 7 | 7 | $33,138 |
| #1 | 7 | 7 | $4,734 |
| #2 | 7 | 7 | $4,734 |
| #3 | 7 | 7 | $4,734 |
| #4 | 7 | 7 | $4,734 |
| #5 | 7 | 7 | $4,734 |
| #6 | 7 | 7 | $4,734 |
| #7 | 7 | 7 | $4,734 |
| Total (7 units) | $33,140 | ||
UW: 25.0% down · 7.5% · 30yr · 1.5% tax · 5.0% vac · 8.0% maint · 8.0% mgmt
Financing live
Cash to close
- Down payment
- $775,000
- Closing costs
- $93,000
- Reserves months
- —
- Total cash needed
- —
Loan-product check · same deal, 3 products live
Conventional
25% down · 7.5% · 30yr
- Down + closing
- —
- Monthly P&I
- —
- Monthly cashflow
- —
- DSCR
- —
- Eligible?
- —
Personal DTI + credit; lowest rate.
DSCR
20% down · 8.5% · 30yr
- Down + closing
- —
- Monthly P&I
- —
- Monthly cashflow
- —
- DSCR
- —
- Eligible?
- —
No personal income docs; deal must DSCR.
Hard money
10% down · 12.0% · 12mo
- Down + closing
- —
- Monthly P&I
- —
- Monthly cashflow
- —
- DSCR
- —
- Eligible?
- —
Short-term bridge; refi at stabilization.
Listing history 27 events
-
2026-06-18days on market $3,100,000 Active 128 DOM
-
2026-06-17days on market $3,100,000 Active 127 DOM
-
2026-06-16days on market $3,100,000 Active 126 DOM
-
2026-06-15days on market $3,100,000 Active 125 DOM
-
2026-06-13days on market $3,100,000 Active 123 DOM
-
2026-06-13days on market $3,100,000 Active 122 DOM
-
2026-06-09days on market $3,100,000 Active 119 DOM
-
2026-06-08days on market $3,100,000 Active 118 DOM
-
2026-06-07days on market $3,100,000 Active 117 DOM
-
2026-06-04days on market $3,100,000 Active 114 DOM
-
2026-06-03days on market $3,100,000 Active 113 DOM
-
2026-06-02days on market $3,100,000 Active 112 DOM
-
2026-06-01days on market $3,100,000 Active 111 DOM
-
2026-05-31days on market $3,100,000 Active 110 DOM
-
2026-02-10$3,100,000 Active 624-char remark
Show marketing remark (624 chars)
Introducing 1151 Davis St. in Redwood City. This 7 unit gem is located in a fantastic west of El Camino neighborhood and feature one 2 bedroom, five 1 bedroom and one studio units. Two units benefit from balconies and two others from private yards. All units are uniformly and completely renovated: new kitchens, new bathrooms, flooring, doors, molding, Schlage Smart Locks, etc. All electrical main panels have been upgraded. All but one of the sub-panels has been upgraded. A bike shed featuring top of the line wall mount bike racks was recently constructed onsite. Come see this beautiful turnkey investment opportunity.
-
2026-01-03historical
-
2025-11-03Active
-
2019-06-07soldstatus $2,275,000
-
2004-08-27soldstatus $950,000
-
2004-08-27soldstatus $950,000
-
2004-08-27soldstatus $950,000
-
2004-05-19historical
-
2004-05-08$995,000
-
2004-05-08$995,000
-
2000-08-31soldstatus $900,000
-
1972-06-22soldstatus $84,000
ⓘ Source: listings_history table (triggers on properties + properties_extension) + one-shot
backfill from property_details.listing_events for pre-trigger history.
Tax reassessment forecast CA · Resets to sale price
- Current annual tax
- $27,933 · $2,328/mo
- Projected year-2 tax
- $27,933 · $2,328/mo
- Expected delta
- $0/yr ($0/mo · 0.0%)
ⓘ Screening estimate from a state-policy table — verify with the county assessor before closing.
Climate risk First Street
- Flood 1/10 Low FEMA zone X (shaded) · 0% chance over 30 yrs
- Wildfire 1/10 Low
- Heat 3/10 Moderate 7 d/yr ≥94°F today · 14 d/yr by 30 yrs out
- Wind 1/10 Low
- Air quality 8/10 Severe 16 unhealthy d/yr today · 16 by 30 yrs out
Nearby sold comps map
Loading sold comps map…
Walkable amenities ~0.75 mi
Loading nearby amenities…
Taxation est. · year 1
- Rental income
- $397,680
- − Mortgage interest
- −$173,648
- − Property taxes
- −$27,933
- − Insurance
- −$15,500
- − Repairs & maintenance
- −$31,814
- − Management
- −$31,814
- − Depreciation
- −$90,182
- Taxable income
- $26,788
- Est. tax owed @ 24.0%
- −$6,429
- After-tax cash flow
- $69,224/yr
For passive investors: Depreciation is non-cash, so a rental often shows a tax loss while cash-flowing — sheltering income. Rental losses are passive: they offset passive income freely, and up to $25,000/yr can offset ordinary (W-2) income if you actively participate and your MAGI is under $100k (phasing out to $0 by $150k); unused losses carry forward. On sale, claimed depreciation is recaptured at up to 25%, and gains may owe capital-gains tax (a 1031 exchange can defer both). Figures are a year-1 estimate at your 24.0% rate — not tax advice; consult a CPA.
Schools (NCES district)
- District
- Sequoia Union High
- NCES district ID
- 0636390
- Math proficiency
- 52% ▲ 5.00%
- Reading proficiency
- 69% ▲ 7.00%
- Median HH income
- $106,953
- Composite
- 58.48/100
- National rank
- #2055
- State rank
- #159 of 1400 in CA
Livability — Redwood City
No livability data for this city. (Only ~50 U.S. cities are tracked.)
Census & demographics
- Census place
- Redwood City, CA
- County
- San Mateo County · 733,415 people
- City population
- 83,154
- Metro
- San Francisco-Oakland-Berkeley, CA
- Population (ZIP)
- 37,048
- Household income
- $146,265
- Rent vs Own
- Severe rent burden
- 1550.0
Population outlook (San Mateo County) Hauer SSP2
- Today (2025)
- 864,008 people
- By 2030
- 910,523 · +5.4%
- By 2040
- 997,285 · +15.4%
- By 2050
- 1,071,189 · +24.0%
- By 2075
- 1,197,206 · +38.6%
- By 2100
- 1,192,523 · +38.0%
Race, ethnicity, and origin ACS 2023
- Neighborhood character
- Diverse neighborhood (Simpson 0.68)
- Race & ethnicity
- White 40% Hispanic / Latino 38% Two or more races 15% Asian 14% Native American 3% Black 3%
- Hispanic origin (detail)
- Mexican 25%
- Common ancestry
- Lithuanian 2% Italian 2% Slovak 2%
- Foreign-born
- 29% · Canada, China, South Korea
- Languages at home
- 55% English-only · Spanish 30% Chinese 4% Other Asian/Pacific 2%
Political lean MEDSL · San Mateo
- 2024 margin
- Solid D (+50.3) · D 73.5% · R 23.2% · Other 3.3%
- 2008→2024 swing
- +1.6pp toward D · 2008: 48.7pp · 2024: 50.3pp
- All cycles
- 2024: D+50.3 2020: D+57.7 2016: D+57.7 2012: D+44.8 2008: D+48.7
Not yet ingested
- Civics
- —
Market trends
- HPI YoY
- ▼ -1088.78%
- Current HPI
- 364.9509
- Rent YoY
- ▲ 6.70%
- Metro
- San Francisco-Oakland-Berkeley, CA
- State GDP YoY
- ▲ 3.21%
- F500 in state
- 116
Industry mix (Fortune 500 HQ in CA)
| Industry | F500 HQs | Revenue |
|---|---|---|
| Technology | 27 | $1,492B |
|
||
| Financial Services | 3 | $174B |
|
||
| Retail | 3 | $44B |
|
||
| Insurance | 3 | $26B |
|
||
| Media / Entertainment | 2 | $115B |
|
||
| Pharmaceuticals / Biotech | 2 | $62B |
|
||
Price history
+3590.5% since first listed13 events — show timeline
- 2026-02-10 Listed $3,100,000 MLSListings
- 2026-02-10 Listed $3,100,000 bridgeMLS, Bay East AOR, or Contra Costa AOR
- 2026-01-03 Listing Removed — bridgeMLS, Bay East AOR, or Contra Costa AOR
- 2025-11-03 Listed — bridgeMLS, Bay East AOR, or Contra Costa AOR
- 2019-06-07 Sold (Public Records) $2,275,000 Public Records
- 2004-08-27 Sold (Public Records) $950,000 Public Records
- 2004-08-27 Sold (MLS) $950,000 MLSListings
- 2004-08-27 Sold (MLS) $950,000 bridgeMLS, Bay East AOR, or Contra Costa AOR
- 2004-05-19 Listing Removed — MLSListings
- 2004-05-08 Listed $995,000 MLSListings
- 2004-05-08 Listed $995,000 bridgeMLS, Bay East AOR, or Contra Costa AOR
- 2000-08-31 Sold (Public Records) $900,000 Public Records
- 1972-06-22 Sold (Public Records) $84,000 Public Records
Property tax history
+5.8%/yrLatest (2025): $27,933 · +1.1% YoY. Source: county tax records.
Cash-flow waterfall
monthlySold comps — $/sqft
last 12 mo · ≤1 miLoading sold comps…