 Triplex
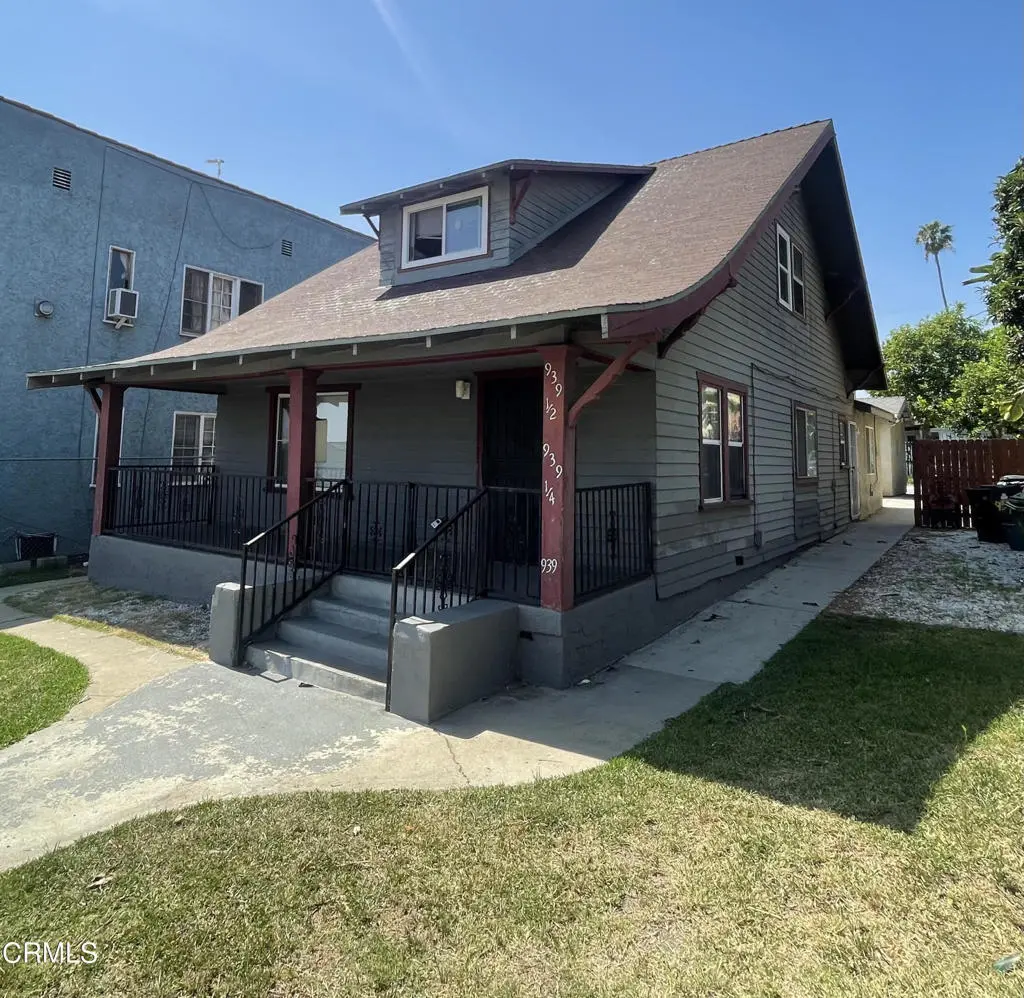
939 S Lorena St · Los Angeles, CA
Flood risk 1/10 · Minimal
- FEMA flood zone
- X (unshaded)
- Chance of flooding over 30 yrs
- 0.0%
- Est. flood insurance / yr
- $507 – $1,088
Fire risk 1/10 · Minimal
- Est. fire insurance / yr
- $659 – $1,223
Heat risk 6/10 · Moderate
- Hot days now (above 94°F)
- 7 days/yr
- Hot days in 30 yrs
- 21 days/yr
Wind risk 1/10 · Minimal
- Chance of severe wind over 30 yrs
- —
Air-quality risk 5/10 · Moderate
- Unhealthy air days now
- 9 days/yr
- Unhealthy air days in 30 yrs
- 9 days/yr
Risk factors via First Street. Map © Google.
Why this score? — see what drove the F grade
The composite is a weighted blend of 9 inputs, each scored 0–100. Each bar is that input's sub-score; the figure is the points it added to the 100-point composite (weight × sub-score).
- Cash flow +11.0/30.0
- Schools +3.6/10.0
- Livability +3.4/5.0
- DSCR +3.2/10.0
- Rent growth +2.6/5.0
- 1% rule +2.5/10.0
- Condition / age +2.5/5.0
- ARV discount +0.0/15.0
- Appreciation +0.0/10.0
$865,000
🖨 Deal sheet 📄 Offer letter ✓ Due diligence
Multi-family units
County records classify this as Multi-Family (2-4 Unit). Listing-text estimate: 3 units. confirmed
Listing remarks
Incredible investment opportunity or ideal owner-user property! This multi-unit property features three units, including a recently renovated front unit that will be delivered vacant at close of escrow. The property consists of two 2-bedroom, 1-bath units and one 1-bedroom, 1-bath unit. Each unit is separately metered for water, gas, and electricity, offering added convenience and cost transparency. The layout is well-suited for extended family living or generating rental income. Current rents are below market, presenting strong upside potential for investors. The property will be delivered with tenants in place in two units; the front unit will be vacant. Please do not disturb tenants. Sho
Key facts
- 5,510 sq ft lot
- 5 parking spots
- Built 1907
Tags
Property features AI
Finance
- Financial info: Multi-unit income details: Gross scheduled income $43,500; Gross income $43,500; Net operating income $22,608; Operating expenses total $20,808 (examples: insurance $3,252; gardener $2,400; maintenance $840; trash $960); Tenant pays gas, water, and electricity; Unit-level rents: Unit 1 listing rent $1,525 (3 bed / 2 bath); Unit 2 listing rent $2,100 (2 bed / 1 bath)
- HOA & community: Community features: curbs, biking routes, street lighting, sidewalks; Rent control
Exterior
- Parking: Concrete driveway; Gated access; RV access/parking; Shared driveway; Side-by-side parking; Street parking; Total of 5 parking spaces
- Security: Smoke detector
- Utilities: District/public water; Public sewer / sewer connected; Electricity available / standard electric; Natural gas available; Three separate water meters; Three separate gas meters; Three separate electric meters
- Home design: Attached property; Two stories; Multi-unit (2 buildings); Additions/alterations and updated/remodeled; Has a view; Entry level: 1
- Construction: Wood and stucco construction; Shingle roof; Raised foundation and concrete slab
- Exterior features: Yard; Chain link fencing; No pool
Interior
- Kitchen: Gas oven; Granite and laminate counters
- Bedrooms: Multi-level bedroom
- Bathrooms: Total baths reported per unit: 2 baths (Unit 1), 1 bath (Unit 2)
- Heating & cooling: Ductless heating and cooling; Wall heater; Wall/window AC units (wall/window)
- Interior features: Beamed ceilings; Granite counters; Laminate counters; Built-in features; Panel doors; Blinds on windows; Smoke detector; Unfurnished; Multi-level / split layout
- Laundry & utility: No laundry features listed
Neighborhood map
What this means for you Summary
Snapshot
- This is a 2×2bd/1ba + 1×1bd/1ba units multifamily listed at $865k.
Deal economics
- At list price, monthly cash flow is $-363 ($-4k/yr) — negative. Per door: $-121/mo.
- To cash-flow at today's rent, offer at most $801k (7.4% below list).
- To meet the 1% rule (rent ≥ 1% of price), the offer needs to be $649k (25.0% below list).
- Recommended offer: $649k (25.0% below list) — sets the bar for 1% rule.
- Cap rate 5.8% vs local median 2.1% in Los Angeles — top-decile yield for the area; either an underpriced asset or a hidden risk that comps aren't pricing in. Stress-test before assuming the spread holds.
Location & tenants
- Location reads 68/100 on livability (#273 in CA) — a middle-class / working-renter tenant base. Strengths: amenities A+, commute A+, employment B; Watch: health & safety C-, schools D+, crime F.
- Los Angeles Unified (urban): math 29% / reading 54% proficiency, ranked #223 of 517 in CA (top 43%) — families likely to look elsewhere, expect single-tenant / working-renter base with shorter leases; 67% free/reduced lunch — lower-income household profile, screen leases tightly.
- Market conditions: Rents flat; 57 active listings in the ZIP; 32 comparable units currently listed for rent nearby; rentals at typical pace (median 24d on market — plan ~3-4 weeks tenant-placement turnaround); 19,697 units permitted in Los Angeles County in 2024 (9,426 in 5+ unit buildings).
- At $6,490/mo this rent would consume 132% of the median local household income ($59k/yr) (locally 2670% of renters already pay >50% of income on rent) — very limited rent-growth headroom before tenants either downsize or default.
Forward outlook
- Local home prices are declining (-3.0%/yr); year-one equity from $6k of loan paydown is wiped out by about $26k of value loss. Plan a longer hold.
- Los Angeles County population projected at +9% by 2050 — modest demand growth; plan on rents tracking national, not racing it.
Negotiation context
- It's been on market 52 days — a 3% lower offer ($839k) is reasonable based on typical stale-listing flexibility.
- 3 sale attempts since 22y ago with the ask held roughly flat each time — persistent listings suggest the price (not the market) is what's stuck; bring a comps-based counter.
- Current owner paid $245k; list at $865k implies a 253% gain — meaningful room to come down on a strong offer.
Risks & watch-outs
- Watch-outs: built in 1907 — expect roof / HVAC / electrical / plumbing capex.
- Climate carrying-cost: extreme-heat days projected 7→21/yr by 2055 (HVAC capex compounding) — expect insurance premiums to compound above CPI over the hold.
Questions for the listing agent
- What do current leases actually rent for vs. the listed asking? Can we see a recent rent roll and the last 12 months of T-12 income?
- It's been on market 52 days. Have you received any prior offers? Is the seller open to a 25% concession, seller financing, or rate buy-down credit?
- Can we see the unit-by-unit rent roll, current vacancy, and any below-market leases? What's the average tenancy length?
- What capital expenditures (roof, boiler, parking lot, exteriors) have been made in the last 5 years, and what's planned in the next 2?
- Built in 1907 — when were the roof, HVAC, electrical panel, plumbing, and water heater last replaced?
- Is there a deadline driving the sale (1031 exchange, divorce, estate, relocation)? That informs how much negotiation room exists.
- Schools are D-rated, which usually means shorter tenancies and higher turnover. Who's the typical renter profile here, and what's been the actual vacancy rate?
- Crime grade is F in this area — have there been break-ins, vandalism, or insurance claims at this property in the last 3 years? What carrier currently insures it and at what premium?
- The area grade is low — what's the realistic commute time and amenity access for the typical tenant pool here? Any planned neighborhood developments (good or bad) we should know about?
- What's the average days-on-market for RENTAL listings here right now (not sales)? A rising rental-DOM trend means longer vacancies and softer asking-rent achievability than the comps imply.
- What's the recent tenant-quality profile in this submarket — average credit score on applications, eviction rate, late-payment / NSF rate, and stable-employment percentage? A property-management company in the area should have these aggregated.
- How much new apartment / multifamily construction is in the pipeline within 1–3 miles? Heavy new supply (>2% of stock underway) typically softens rents 12–24 months out; light construction supports rent growth.
Investment metrics
- 1% rule
- 0.75% ✗
- Cap rate
- 5.79%
- Cash-on-cash
- -1.80%
- DSCR
- 0.92
- GRM
- 11.1
CMA / ARV
- ARV (median comp)
- $723,063
- List price
- $865,000
- Delta
- 19.63%
- Verdict
- OVERPRICED
- Comps
- 20 within 1.0 mi
Show comp detail 3 sales within ~0.75 mi
| Address | Dist | Beds/Ba | Sqft | Sold | Price | $/sf | Match |
|---|---|---|---|---|---|---|---|
| 3453 Estrada | 0.46mi | 2/2.0 | 1,248 (-6%) | 5mo | $800,000 | $641 | 64 |
| 222-224 S Dacotah St | 0.72mi | 2/2.0 | 1,332 (+0%) | 11mo | $775,000 | $582 | 57 |
| 415 Euclid Ave | 0.68mi | 3/2.0 (+1) | 1,447 (+9%) | 1mo | $565,000 | $390 | 47 |
Match score weights: distance 35% · size 25% · config 20% · recency 20%. Top-matched comps best support the ARV.
Projected returns pro-forma
-3.0% appreciation · 0.21% rent growth · sell at horizon
- IRR
- -22.2%
- Equity multiple
- 0.25×
- Total profit
- $-181,201
- Equity at exit
- $128,974
- IRR
- -24.2%
- Equity multiple
- -0.06×
- Total profit
- $-257,145
- Equity at exit
- $74,789
Cash invested: $242,200 (down + closing). Projections, not guarantees.
Landlord ↔ Tenant lean methodology
- Overall (CITY)
- 0 Strongly Tenant-Friendly
- State California
- 18 Strongly Tenant-Friendly · D+13
- County
- — inherits STATE
- City Los Angeles
- 0 Strongly Tenant-Friendly · D+22
ZIP-level market 90023
- Rents YoY
- 0.2%
- Active inventory
- 57
- Price-to-rent
- 31.3×
Monthly cashflow live
- Estimated rent
- $6,490 high interval (Pro) →
- Mortgage (P&I)
- −$4,536
- Tax from tax record
- −$593 /mo · $7,120/yr
- Insurance
- −$360
- HOA
- −$0
- Vacancy / Maint / Mgmt
- −$1,363
- Net cashflow
- $-363
Break-even live
3-unit breakdown (identical units grouped — click to expand)
| Units | Beds | Baths | Est. rent |
|---|---|---|---|
| 2× units | 2 | 1 | $4,608 |
| #1 | 2 | 1 | $2,304 |
| #2 | 2 | 1 | $2,304 |
| 1× unit | 1 | 1 | $1,881 |
| Total (3 units) | $6,490 | ||
UW: 25.0% down · 7.5% · 30yr · 1.5% tax · 5.0% vac · 8.0% maint · 8.0% mgmt
Financing live
Cash to close
- Down payment
- $216,250
- Closing costs
- $25,950
- Reserves months
- —
- Total cash needed
- —
Loan-product check · same deal, 3 products live
Conventional
25% down · 7.5% · 30yr
- Down + closing
- —
- Monthly P&I
- —
- Monthly cashflow
- —
- DSCR
- —
- Eligible?
- —
Personal DTI + credit; lowest rate.
DSCR
20% down · 8.5% · 30yr
- Down + closing
- —
- Monthly P&I
- —
- Monthly cashflow
- —
- DSCR
- —
- Eligible?
- —
No personal income docs; deal must DSCR.
Hard money
10% down · 12.0% · 12mo
- Down + closing
- —
- Monthly P&I
- —
- Monthly cashflow
- —
- DSCR
- —
- Eligible?
- —
Short-term bridge; refi at stabilization.
Rent comps 32 comps
| Address | Beds | Baths | Sqft | Rent | $/sqft | DOM | Units | Dist |
|---|---|---|---|---|---|---|---|---|
| 929 S Lorena St Los Angeles, CA | 3.0 | 2.5 | 1312 | $3,200 | $2.44 | 17d | 1 | 0.02mi |
| 929 S Lorena St Unit LORENA(929F) Los Angeles, CA | 3.0 | 3.0 | 1200 | $3,200 | $2.67 | 16d | 1 | 0.02mi |
| 969 S Lorena St Unit 1/2 Commerce, CA | 2.0 | 2.5 | 1100 | $2,600 | $2.36 | 7d | 1 | 0.07mi |
| 969 S Lorena St Unit 1/2 Commerce, CA | 2.0 | 2.5 | 1100 | $2,600 | $2.36 | 5d | 1 | 0.07mi |
| 3466 E 8th St Los Angeles, CA | 3.0 | 1.0 | 1104 | $3,150 | $2.85 | 7d | 1 | 0.45mi |
| 3436 Hunter St Unit 1/2 Los Angeles, CA | 3.0 | 3.0 | 1300 | $3,208 | $2.47 | 14d | 1 | 0.53mi |
| 2853 E 6th St Unit 2 Los Angeles, CA | 2.0 | 1.0 | 1000 | $2,800 | $2.80 | 43d | 1 | 0.57mi |
| 2855 1/2 E 6th St Los Angeles, CA | 3.0 | 1.0 | 1000 | $3,500 | $3.50 | 43d | 1 | 0.58mi |
| 2752 Guirado St Los Angeles, CA | 3.0 | 2.0 | 1100 | $3,300 | $3.00 | 13d | 1 | 0.64mi |
| 609 Camulos St Los Angeles, CA | 3.0 | 1.0 | 1434 | $2,800 | $1.95 | 43d | 1 | 0.66mi |
| 3751 E 6th St Los Angeles, CA | 3.0 | 2.0 | 1211 | $3,700 | $3.06 | 24d | 1 | 0.66mi |
| 3824 Princeton St Los Angeles, CA | 2.0 | 1.0 | 980 | $2,380 | $2.43 | 13d | 1 | 0.78mi |
| 2901 E Olympic Blvd Los Angeles, CA | 3.0 | 1.0 | 711 | $2,400 | $3.38 | 2d | 11 | 0.82mi |
| 702 S Soto St Unit 704 Los Angeles, CA | 3.0 | 2.5 | 1288 | $3,500 | $2.72 | 43d | 1 | 0.93mi |
| 455 Nassau Ave Los Angeles, CA | 2.0 | 2.0 | 1500 | $3,000 | $2.00 | 18d | 1 | 0.96mi |
| 477 Nassau Ave Unit 0479 Los Angeles, CA | 3.0 | 2.0 | 1450 | $3,895 | $2.69 | 43d | 1 | 0.99mi |
| 321 S Fickett St Unit 503 Los Angeles, CA | 2.0 | 1.0 | 900 | $2,495 | $2.77 | 7d | 1 | 0.99mi |
| 132 N Ditman Ave Los Angeles, CA | 3.0 | 2.0 | 1000 | $2,875 | $2.88 | 24d | 1 | 1.02mi |
| 319 N Rowan Ave Los Angeles, CA | 3.0 | 2.0 | 1184 | $3,650 | $3.08 | 16d | 1 | 1.22mi |
| 319 N Rowan Ave Los Angeles, CA | 3.0 | 2.0 | 1184 | $3,650 | $3.08 | 24d | 1 | 1.22mi |
| 446 S St Louis St Los Angeles, CA | 3.0 | 2.0 | 1200 | $3,500 | $2.92 | 43d | 1 | 1.25mi |
| 414 S Saint Louis St Unit 414 Los Angeles, CA | 3.0 | 1.0 | 1100 | $3,200 | $2.91 | 43d | 1 | 1.28mi |
| 2720 Cincinnati St Unit 2720 Los Angeles, CA | 3.0 | 3.0 | 1300 | $2,979 | $2.29 | 43d | 1 | 1.28mi |
| 1050 1/2 S Bonnie Beach Pl Los Angeles, CA | 2.0 | 1.5 | 985 | $2,562 | $2.60 | 24d | 1 | 1.29mi |
| 924 S Sunol Dr Unit 1/2 Los Angeles, CA | 3.0 | 2.0 | 1040 | $3,000 | $2.88 | 24d | 1 | 1.35mi |
| 2018 E 3rd St Los Angeles, CA | 3.0 | 1.0 | 950 | $2,495 | $2.63 | 24d | 1 | 1.36mi |
| 2509 1/2 Cincinnati St Los Angeles, CA | 3.0 | 2.5 | 1540 | $3,295 | $2.14 | 43d | 1 | 1.38mi |
| 2208 Michigan Ave Los Angeles, CA | 2.0 | 1.0 | 900 | $2,395 | $2.66 | 24d | 2 | 1.40mi |
| 2800 Winter St Los Angeles, CA | 3.0 | 1.0 | 1300 | $3,150 | $2.42 | 21d | 1 | 1.44mi |
| 2800 Winter St Los Angeles, CA | 2.0 | 1.0 | 1100 | $2,995 | $2.72 | 43d | 1 | 1.44mi |
| 108 S Cummings St Unit 1 Los Angeles, CA | 2.0 | 1.0 | 1000 | $2,295 | $2.29 | 43d | 1 | 1.45mi |
| 3173 Fairmount St Los Angeles, CA | 3.0 | 2.0 | 1100 | $3,300 | $3.00 | 43d | 1 | 1.50mi |
Listing history 19 events
-
2026-06-18days on market $865,000 Active 52 DOM
-
2026-06-17days on market $865,000 Active 51 DOM
-
2026-06-16days on market $865,000 Active 50 DOM
-
2026-06-15days on market $865,000 Active 49 DOM
-
2026-06-13days on market $865,000 Active 47 DOM
-
2026-06-09days on market $865,000 Active 43 DOM
-
2026-06-08days on market $865,000 Active 42 DOM
-
2026-06-07days on market $865,000 Active 41 DOM
-
2026-06-04days on market $865,000 Active 38 DOM
-
2026-06-03days on market $865,000 Active 37 DOM
-
2026-06-02days on market $865,000 Active 36 DOM
-
2026-06-01days on market $865,000 Active 35 DOM
-
2026-05-31days on market $865,000 Active 34 DOM
-
2026-04-27$865,000 Active 1516-char remark
-
2004-08-25historical
-
2004-05-26$499,000
-
2004-05-25$499,000
-
2003-03-06soldstatus $245,000
-
2003-03-06soldstatus $250,000
ⓘ Source: listings_history table (triggers on properties + properties_extension) + one-shot
backfill from property_details.listing_events for pre-trigger history.
Tax reassessment forecast CA · Resets to sale price
- Current annual tax
- $7,120 · $593/mo
- Projected year-2 tax
- $7,120 · $593/mo
- Expected delta
- $0/yr ($0/mo · 0.0%)
ⓘ Screening estimate from a state-policy table — verify with the county assessor before closing.
Climate risk First Street
- Flood 1/10 Low FEMA zone X (unshaded) · 0% chance over 30 yrs
- Wildfire 1/10 Low
- Heat 6/10 Major 7 d/yr ≥94°F today · 21 d/yr by 30 yrs out
- Wind 1/10 Low
- Air quality 5/10 Major 9 unhealthy d/yr today · 9 by 30 yrs out
Nearby sold comps map
Loading sold comps map…
Walkable amenities ~0.75 mi
Loading nearby amenities…
Taxation est. · year 1
- Rental income
- $77,880
- − Mortgage interest
- −$48,453
- − Property taxes
- −$7,120
- − Insurance
- −$4,325
- − Repairs & maintenance
- −$6,230
- − Management
- −$6,230
- − Depreciation
- −$25,164
- Taxable loss
- −$19,643
- Est. tax savings @ 24.0%
- +$4,714
- After-tax cash flow
- $361/yr
For passive investors: Depreciation is non-cash, so a rental often shows a tax loss while cash-flowing — sheltering income. Rental losses are passive: they offset passive income freely, and up to $25,000/yr can offset ordinary (W-2) income if you actively participate and your MAGI is under $100k (phasing out to $0 by $150k); unused losses carry forward. On sale, claimed depreciation is recaptured at up to 25%, and gains may owe capital-gains tax (a 1031 exchange can defer both). Figures are a year-1 estimate at your 24.0% rate — not tax advice; consult a CPA.
Schools (NCES district)
- District
- Los Angeles Unified
- NCES district ID
- 0622710
- Math proficiency
- 29% ▼ -4.00%
- Reading proficiency
- 54% ▲ 10.00%
- Median HH income
- $50,403
- Composite
- 35.67/100
- National rank
- #4875
- State rank
- #223 of 517 in CA
Livability — Los Angeles
- Score
- 68/100
- State rank
- #273
- US rank
- #9237
Category grades
Schools grade is shown separately in the Schools card above.
Census & demographics
- Census place
- Los Angeles, CA
- County
- Los Angeles County · 9,444,647 people
- City population
- 3,838,149
- Metro
- Los Angeles-Long Beach-Anaheim, CA
- Population (ZIP)
- 43,857
- Household income
- $59,057
- Rent vs Own
- Severe rent burden
- 2670.0
Population outlook (Los Angeles County) Hauer SSP2
- Today (2025)
- 10,940,515 people
- By 2030
- 11,256,481 · +2.9%
- By 2040
- 11,729,929 · +7.2%
- By 2050
- 11,948,407 · +9.2%
- By 2075
- 11,818,114 · +8.0%
- By 2100
- 10,842,928 · -0.9%
Race, ethnicity, and origin ACS 2023
- Neighborhood character
- Predominantly Hispanic (96%)
- Race & ethnicity
- Hispanic / Latino 96% Two or more races 17% Native American 2% White 2%
- Hispanic origin (detail)
- Mexican 80%
- Common ancestry
- Italian 1%
- Foreign-born
- 41% · Canada, Jamaica
- Languages at home
- 16% English-only · Spanish 83%
Political lean MEDSL · Los Angeles
- 2024 margin
- Solid D (+32.9) · D 64.8% · R 31.9% · Other 3.3%
- 2008→2024 swing
- -7.4pp toward R · 2008: 40.4pp · 2024: 32.9pp
- All cycles
- 2024: D+32.9 2020: D+44.2 2016: D+48.0 2012: D+40.0 2008: D+40.4
Not yet ingested
- Civics
- —
Market trends
- HPI YoY
- ▼ -702.74%
- Current HPI
- 430.9762
- Rent YoY
- ▲ 0.21%
- Metro
- Los Angeles-Long Beach-Anaheim, CA
- State GDP YoY
- ▲ 3.21%
- F500 in state
- 116
Industry mix (Fortune 500 HQ in CA)
| Industry | F500 HQs | Revenue |
|---|---|---|
| Technology | 27 | $1,492B |
|
||
| Financial Services | 3 | $174B |
|
||
| Retail | 3 | $44B |
|
||
| Insurance | 3 | $26B |
|
||
| Media / Entertainment | 2 | $115B |
|
||
| Pharmaceuticals / Biotech | 2 | $62B |
|
||
Price history
+253.1% since first listed6 events — show timeline
- 2026-04-27 Listed $865,000 CRMLS
- 2004-08-25 Listing Removed — SDMLS
- 2004-05-26 Listed $499,000 SDMLS
- 2004-05-25 Listed $499,000 CRMLS
- 2003-03-06 Sold (Public Records) $250,000 Public Records
- 2003-03-06 Sold (Public Records) $245,000 Public Records
Property tax history
+1.7%/yrLatest (2025): $7,120 · +1.0% YoY. Source: county tax records.
Cash-flow waterfall
monthlySold comps — $/sqft
last 12 mo · ≤1 miLoading sold comps…