 🔨 Auction
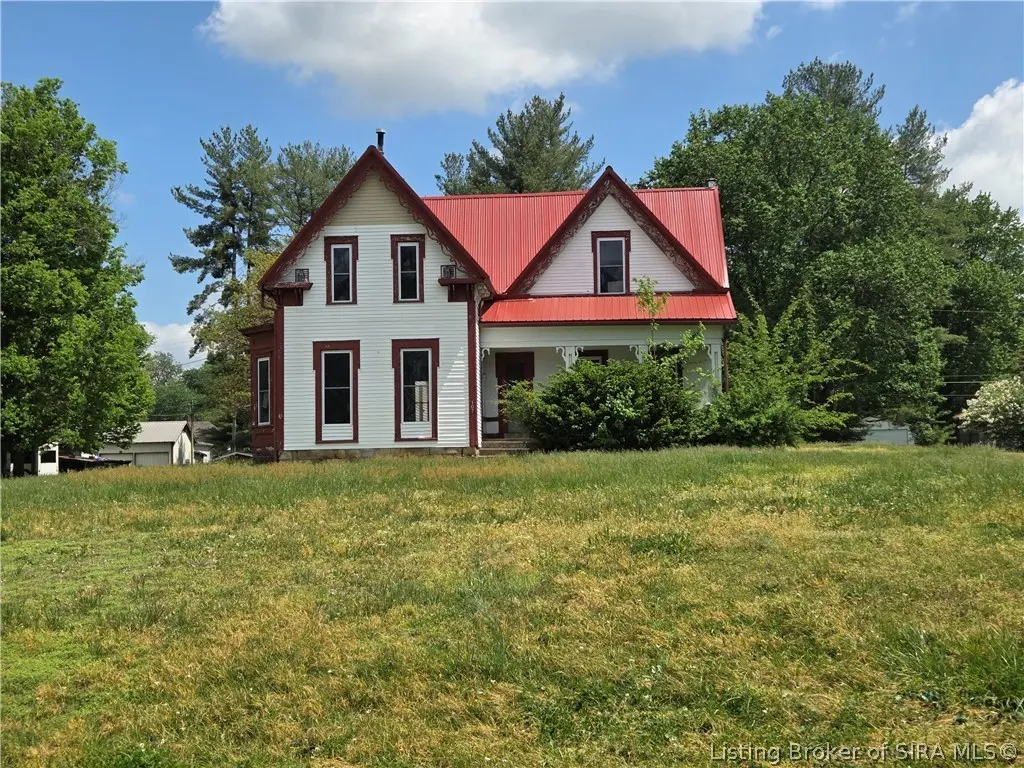
107 Christian St · Worthington, IN
Flood risk 1/10 · Minimal
- FEMA flood zone
- X (unshaded)
- Chance of flooding over 30 yrs
- 0.0%
- Est. flood insurance / yr
- $473 – $860
Fire risk 1/10 · Minimal
- Est. fire insurance / yr
- $717 – $1,331
Heat risk 4/10 · Minor
- Hot days now (above 105°F)
- 7 days/yr
- Hot days in 30 yrs
- 18 days/yr
Wind risk 2/10 · Minimal
- Chance of severe wind over 30 yrs
- 1.0%
Air-quality risk 2/10 · Minimal
- Unhealthy air days now
- 1 days/yr
- Unhealthy air days in 30 yrs
- 2 days/yr
Risk factors via First Street. Map © Google.
Why this score? — see what drove the F grade
The composite is a weighted blend of 9 inputs, each scored 0–100. Each bar is that input's sub-score; the figure is the points it added to the 100-point composite (weight × sub-score).
- ARV discount +7.5/15.0
- Appreciation +5.8/10.0
- Cash flow +4.6/30.0
- Livability +3.5/5.0
- Schools +3.1/10.0
- Rent growth +2.5/5.0
- Condition / age +2.5/5.0
- 1% rule +0.0/10.0
- DSCR +0.0/10.0
$49,900
🖨 Deal sheet 📄 Offer letter ✓ Due diligence
Listing remarks MLS
Old World home ready for your vision!! Over 2800 sq ft home w/ 2 stories. 5 bedrooms and 2 full baths. Living rm, Kitchen, Formal dining rm PLUS a bonus rm. Covered front porch. Cellar. 1 car detached garage w/ storage. All sitting on 1 acre+. HUD Case #151-839616/IE. Sold AS IS. HUD Owned. For more information on lead-based paint, radon gas, mold notices, as well as electronic bidding and earnest money procedures go to www. Hudhomestore. gov. It is illegal to discriminate against any person because of race, color, religion, sex, handicap, familial status or national origin. Equal Housing Opportunity. Check out AUCTION DATES at www. servicelinkauction. com--for all offers, see agent remarks.
Key facts
- 1.03 acre lot
- Garage
- Built 1910
Property features AI
Exterior
- Parking: Has garage; 1 garage space; Has carport; Detached parking
- Utilities: Public water connected; Public sewer
- Home design: 2-story home; Frame construction; Shingle roof; Residential zoning; Paved road access; Below-grade unfinished area (cellar/block foundation)
- Construction: Frame construction; Block foundation; Cellar foundation; Shingle roof; Built with 2 stories
- Exterior features: Covered porch; Porch; Shed(s)
Interior
- Kitchen: Kitchen on the first floor
- Bedrooms: Multiple bedrooms on the second floor; At least one bedroom on the first floor (main level primary)
- Flooring: Carpet flooring throughout noted rooms
- Bathrooms: 2 full bathrooms
- Heating & cooling: Forced air heating; Central air conditioning
- Interior features: Separate formal dining room; Main level primary bedroom; Split bedroom layout; Utility room; Bonus room; Has basement; Decorative fireplaces (2 total)
- Laundry & utility: Laundry on main level
Neighborhood map
What this means for you Summary
Snapshot
- This is a 5-bed/2.0-bath single-family listed at $50k.
Deal economics
- At list price, monthly cash flow is $-594 ($-7k/yr) — negative.
- The deal already cash-flows at list — no discount required.
- Meets the 1% rule at list price ($1k rent vs $50k).
- Recommended offer: $48k (3.0% below list) — sets the bar for market timing.
Location & tenants
- Location reads 70/100 on livability (#174 in IN) — a middle-class / working-renter tenant base. Strengths: crime A+, cost of living A+, housing A+; Watch: schools C-, employment D, amenities F.
- White River Valley School District (rural): math 33% / reading 39% proficiency, ranked #187 of 301 in IN (top 62%) — families likely to look elsewhere, expect single-tenant / working-renter base with shorter leases.
- Market conditions: 17 active listings in the ZIP.
Forward outlook
- In year one you build about $5k of equity ($2k loan paydown + $4k appreciation (1.5% local appreciation)).
- Greene County population projected at -22% by 2050 — secular population decline; favor cash flow + early exit over multi-decade hold.
- By year 7, paydown + projected appreciation supports a ~$34k cash-out refi (75% LTV) — recoverable capital for the next deal without selling this one.
Negotiation context
- It's been on market 53 days — a 3% lower offer ($48k) is reasonable based on typical stale-listing flexibility.
- 17 sale attempts since 5y ago; this cycle's ask has dropped $10k (17%) from the opening price — seller is motivated, your offer sets the floor, not the list.
- Current owner paid $32k; list at $50k implies a 55% gain — meaningful room to come down on a strong offer.
Risks & watch-outs
- Watch-outs: property tax is 4.3% of price; built in 1910 — expect roof / HVAC / electrical / plumbing capex.
Questions for the listing agent
- What do current leases actually rent for vs. the listed asking? Can we see a recent rent roll and the last 12 months of T-12 income?
- It's been on market 53 days. Have you received any prior offers? Is the seller open to a 3% concession, seller financing, or rate buy-down credit?
- Built in 1910 — when were the roof, HVAC, electrical panel, plumbing, and water heater last replaced?
- Property tax is high relative to price — has the assessment been appealed recently, and will the sale trigger a re-assessment?
- Is there a deadline driving the sale (1031 exchange, divorce, estate, relocation)? That informs how much negotiation room exists.
- The area grade is low — what's the realistic commute time and amenity access for the typical tenant pool here? Any planned neighborhood developments (good or bad) we should know about?
- What's the average days-on-market for RENTAL listings here right now (not sales)? A rising rental-DOM trend means longer vacancies and softer asking-rent achievability than the comps imply.
- What's the recent tenant-quality profile in this submarket — average credit score on applications, eviction rate, late-payment / NSF rate, and stable-employment percentage? A property-management company in the area should have these aggregated.
- How much new for-sale + rental construction is in the pipeline within 1–3 miles? Heavy new supply typically softens prices + rents 12–24 months out; constrained supply supports both.
Investment metrics
- 1% rule
- 0.49% ✗
- Cap rate
- 3.24%
- Cash-on-cash
- -10.89%
- DSCR
- 0.52
- GRM
- 17.0
CMA / ARV
- ARV (median comp)
- $233,787
- List price
- $49,900
- Delta
- -78.66%
- Verdict
- UNDERPRICED
- Comps
- 9 within 1.0 mi
Show comp detail 3 sales within ~0.75 mi
| Address | Dist | Beds/Ba | Sqft | Sold | Price | $/sf | Match |
|---|---|---|---|---|---|---|---|
| 326 Harrah St | 0.55mi | 4/2.0 (-1) | 2,778 (-3%) | 0mo | $280,000 | $101 | 64 |
| 527 Smith Ferry Rd | 0.28mi | 4/3.0 (-1) | 2,642 (-8%) | 8mo | $344,900 | $131 | 58 |
| 14 S Edwards St | 0.38mi | 4/2.0 (-1) | 3,052 (+6%) | 11mo | $289,000 | $95 | 58 |
Match score weights: distance 35% · size 25% · config 20% · recency 20%. Top-matched comps best support the ARV.
Projected returns pro-forma
1.51% appreciation · 3.0% rent growth · sell at horizon
- IRR
- -8.1%
- Equity multiple
- 0.58×
- Total profit
- $-27,615
- Equity at exit
- $86,074
- IRR
- -2.5%
- Equity multiple
- 0.67×
- Total profit
- $-21,656
- Equity at exit
- $119,395
Cash invested: $65,460 (down + closing). Projections, not guarantees.
Landlord ↔ Tenant lean methodology
- Overall (STATE)
- 90 Strongly Landlord-Friendly
- State Indiana
- 90 Strongly Landlord-Friendly · R+11
- County
- — inherits STATE
- City
- — inherits STATE
ZIP-level market 47471
- Home prices YoY
- 0.8%
- Active inventory
- 17
- Price-to-rent
- 3.6×
Monthly cashflow live
- Estimated rent
- $1,148 medium interval (Pro) →
- Mortgage (P&I)
- −$1,226
- Tax from tax record
- −$177 /mo · $2,125/yr
- Insurance
- −$97
- HOA
- −$0
- Vacancy / Maint / Mgmt
- −$241
- Net cashflow
- $-594
Break-even live
UW: 25.0% down · 7.5% · 30yr · 1.5% tax · 5.0% vac · 8.0% maint · 8.0% mgmt
Financing live
Cash to close
- Down payment
- $58,447
- Closing costs
- $7,014
- Reserves months
- —
- Total cash needed
- —
Loan-product check · same deal, 3 products live
Conventional
25% down · 7.5% · 30yr
- Down + closing
- —
- Monthly P&I
- —
- Monthly cashflow
- —
- DSCR
- —
- Eligible?
- —
Personal DTI + credit; lowest rate.
DSCR
20% down · 8.5% · 30yr
- Down + closing
- —
- Monthly P&I
- —
- Monthly cashflow
- —
- DSCR
- —
- Eligible?
- —
No personal income docs; deal must DSCR.
Hard money
10% down · 12.0% · 12mo
- Down + closing
- —
- Monthly P&I
- —
- Monthly cashflow
- —
- DSCR
- —
- Eligible?
- —
Short-term bridge; refi at stabilization.
Listing history 50 events
-
2026-06-19days on market $49,900 Active 53 DOM
-
2026-06-18days on market $49,900 Active 52 DOM
-
2026-06-17days on market $49,900 Active 51 DOM
-
2026-06-16days on market $49,900 Active 50 DOM
-
2026-06-15days on market $49,900 Active 49 DOM
-
2026-06-14days on market $49,900 Active 47 DOM
-
2026-06-12days on market $49,900 Active 46 DOM
-
2026-06-09days on market $49,900 Active 43 DOM
-
2026-06-08days on market $49,900 Active 42 DOM
-
2026-06-07days on market $49,900 Active 41 DOM
-
2026-06-05days on market $49,900 Active 38 DOM
-
2026-06-03days on market $49,900 Active 37 DOM
-
2026-06-03price $49,900 Active 36 DOM
-
2026-06-02days on market $59,900 Active 36 DOM
-
2026-06-01days on market $59,900 Active 35 DOM
-
2026-05-31days on market $59,900 Active 34 DOM
-
2026-05-30days on market $59,900 Active 33 DOM
-
2026-04-27$59,900 Active 279-char remark
-
2026-04-14soldstatus $32,100
-
2026-04-09soldstatus $32,100 Closed 700-char remark
Show marketing remark (700 chars)
Old World home ready for your vision!! Over 2800 sq ft home w/ 2 stories. 5 bedrooms and 2 full baths. Living rm, Kitchen, Formal dining rm PLUS a bonus rm. Covered front porch. Cellar. 1 car detached garage w/ storage. All sitting on 1 acre+. HUD Case #151-839616/IE. Sold AS IS. HUD Owned. For more information on lead-based paint, radon gas, mold notices, as well as electronic bidding and earnest money procedures go to www. Hudhomestore. gov. It is illegal to discriminate against any person because of race, color, religion, sex, handicap, familial status or national origin. Equal Housing Opportunity. Check out AUCTION DATES at www. servicelinkauction. com--for all offers, see agent remarks.
-
2026-03-03historical 700-char remark
Show marketing remark (700 chars)
Old World home ready for your vision!! Over 2800 sq ft home w/ 2 stories. 5 bedrooms and 2 full baths. Living rm, Kitchen, Formal dining rm PLUS a bonus rm. Covered front porch. Cellar. 1 car detached garage w/ storage. All sitting on 1 acre+. HUD Case #151-839616/IE. Sold AS IS. HUD Owned. For more information on lead-based paint, radon gas, mold notices, as well as electronic bidding and earnest money procedures go to www. Hudhomestore. gov. It is illegal to discriminate against any person because of race, color, religion, sex, handicap, familial status or national origin. Equal Housing Opportunity. Check out AUCTION DATES at www. servicelinkauction. com--for all offers, see agent remarks.
-
2026-03-02$78,433 Active 700-char remark
Show marketing remark (700 chars)
Old World home ready for your vision!! Over 2800 sq ft home w/ 2 stories. 5 bedrooms and 2 full baths. Living rm, Kitchen, Formal dining rm PLUS a bonus rm. Covered front porch. Cellar. 1 car detached garage w/ storage. All sitting on 1 acre+. HUD Case #151-839616/IE. Sold AS IS. HUD Owned. For more information on lead-based paint, radon gas, mold notices, as well as electronic bidding and earnest money procedures go to www. Hudhomestore. gov. It is illegal to discriminate against any person because of race, color, religion, sex, handicap, familial status or national origin. Equal Housing Opportunity. Check out AUCTION DATES at www. servicelinkauction. com--for all offers, see agent remarks.
-
2025-06-16price $78,433
-
2025-01-17historical
-
2024-12-18status Active
-
2024-12-18status Active
-
2024-11-22status Pending
-
2024-11-22status Pending
-
2024-10-17price $98,042
-
2024-10-17price $98,042
-
2024-09-30$115,344 Active
-
2024-08-07price $115,344
-
2024-08-07price $115,344
-
2024-06-10price $128,160
-
2024-06-10price $128,160
-
2024-05-10price $160,200
-
2024-05-10price $160,200
-
2024-03-27price $178,000
-
2024-03-27price $178,000
-
2024-03-21$190,000 Active
-
2024-03-20$190,000 Active
-
2024-03-20$98,042 Active
-
2023-05-25price $139,800
-
2023-05-15$144,800 Active
-
2023-01-20historical
-
2023-01-12price $150,000
-
2023-01-12price $150,000
-
2022-12-02price $165,000
-
2022-12-02price $165,000
-
2022-10-21$168,500 Active
ⓘ Source: listings_history table (triggers on properties + properties_extension) + one-shot
backfill from property_details.listing_events for pre-trigger history.
Tax reassessment forecast IN · Partial reset (capped growth)
- Current annual tax
- $2,125 · $177/mo
- Projected year-2 tax
- $2,125 · $177/mo
- Expected delta
- $0/yr ($0/mo · 0.0%)
ⓘ Screening estimate from a state-policy table — verify with the county assessor before closing.
Climate risk First Street
- Flood 1/10 Low FEMA zone X (unshaded) · 0% chance over 30 yrs
- Wildfire 1/10 Low
- Heat 4/10 Moderate 7 d/yr ≥105°F today · 18 d/yr by 30 yrs out
- Wind 2/10 Low 100% chance of damaging wind over 30 yrs
- Air quality 2/10 Low 1 unhealthy d/yr today · 2 by 30 yrs out
Nearby sold comps map
Loading sold comps map…
Walkable amenities ~0.75 mi
Loading nearby amenities…
Taxation est. · year 1
- Rental income
- $13,772
- − Mortgage interest
- −$13,096
- − Property taxes
- −$2,125
- − Insurance
- −$1,169
- − Repairs & maintenance
- −$1,102
- − Management
- −$1,102
- − Depreciation
- −$6,801
- Taxable loss
- −$11,622
- Est. tax savings @ 24.0%
- +$2,789
- After-tax cash flow
- $-4,337/yr
For passive investors: Depreciation is non-cash, so a rental often shows a tax loss while cash-flowing — sheltering income. Rental losses are passive: they offset passive income freely, and up to $25,000/yr can offset ordinary (W-2) income if you actively participate and your MAGI is under $100k (phasing out to $0 by $150k); unused losses carry forward. On sale, claimed depreciation is recaptured at up to 25%, and gains may owe capital-gains tax (a 1031 exchange can defer both). Figures are a year-1 estimate at your 24.0% rate — not tax advice; consult a CPA.
Schools (NCES district)
- District
- White River Valley School District
- NCES district ID
- 1800008
- Math proficiency
- 33% ▼ -19.00%
- Reading proficiency
- 39% ▼ -15.00%
- Median HH income
- $44,074
- Composite
- 30.59/100
- National rank
- #6199
- State rank
- #187 of 301 in IN
Livability — Worthington
- Score
- 70/100
- State rank
- #174
- US rank
- #8138
Category grades
Schools grade is shown separately in the Schools card above.
Census & demographics
- Census place
- Worthington, IN
- Population (ZIP)
- 3,116
Population outlook (Greene County) Hauer SSP2
- Today (2025)
- 30,724 people
- By 2030
- 29,506 · -4.0%
- By 2040
- 26,744 · -13.0%
- By 2050
- 23,879 · -22.3%
- By 2075
- 18,341 · -40.3%
- By 2100
- 13,976 · -54.5%
Race, ethnicity, and origin ACS 2023
- Neighborhood character
- Predominantly White (90%)
- Race & ethnicity
- White 90% Hispanic / Latino 9% Two or more races 7%
- Hispanic origin (detail)
- Mexican 7% Puerto Rican 1%
- Common ancestry
- Polish 7% Lithuanian 4% Slovak 3%
- Foreign-born
- 1% · Canada
- Languages at home
- 82% English-only · German/W. Germanic 12% Spanish 6%
Political lean MEDSL · Greene
- 2024 margin
- Solid R (+53.7) · D 22.4% · R 76.1% · Other 1.6%
- 2008→2024 swing
- -39.2pp toward R · 2008: -14.5pp · 2024: -53.7pp
- All cycles
- 2024: R+53.7 2020: R+52.2 2016: R+53.4 2012: R+31.4 2008: R+14.5
Not yet ingested
- Civics
- —
Market trends
- HPI YoY
- ▲ 1.51%
- Current HPI
- 200.6511
- Rent YoY
- —
- Metro
- —
- State GDP YoY
- ▲ 2.90%
- F500 in state
- 18
Industry mix (Fortune 500 HQ in IN)
| Industry | F500 HQs | Revenue |
|---|---|---|
| Industrial Machinery | 2 | $37B |
|
||
| Healthcare | 1 | $177B |
|
||
| Pharmaceuticals | 1 | $45B |
|
||
| Metals / Steel | 1 | $18B |
|
||
| Agriculture | 1 | $17B |
|
||
| Packaging | 1 | $12B |
|
||
Price history
-68.8% since first listed42 events — show timeline
- 2026-06-02 Price Changed $49,900 SIRA
- 2026-04-27 Listed $59,900 SIRA
- 2026-04-14 Sold (Public Records) $32,100 Public Records
- 2026-04-09 Sold (MLS) $32,100 SIRA
- 2026-03-03 Delisted — SIRA
- 2026-03-02 Listed $78,433 SIRA
- 2025-06-16 Price Changed $78,433 SIRA
- 2025-01-17 Listing Removed — MIBOR as Distributed by MLS Grid
- 2024-12-18 Relisted — THAAR
- 2024-12-18 Relisted — MIBOR as Distributed by MLS Grid
- 2024-11-22 Pending — THAAR
- 2024-11-22 Pending — MIBOR as Distributed by MLS Grid
- 2024-10-17 Price Changed $98,042 THAAR
- 2024-10-17 Price Changed $98,042 MIBOR as Distributed by MLS Grid
- 2024-09-30 Listed $115,344 THAAR
- 2024-08-07 Price Changed $115,344 THAAR
- 2024-08-07 Price Changed $115,344 MIBOR as Distributed by MLS Grid
- 2024-06-10 Price Changed $128,160 MIBOR as Distributed by MLS Grid
- 2024-06-10 Price Changed $128,160 THAAR
- 2024-05-10 Price Changed $160,200 MIBOR as Distributed by MLS Grid
- 2024-05-10 Price Changed $160,200 THAAR
- 2024-03-27 Price Changed $178,000 THAAR
- 2024-03-27 Price Changed $178,000 MIBOR as Distributed by MLS Grid
- 2024-03-21 Listed $190,000 THAAR
- 2024-03-20 Listed $98,042 THAAR
- 2024-03-20 Listed $190,000 MIBOR as Distributed by MLS Grid
- 2023-05-25 Price Changed $139,800 IRMLS
- 2023-05-15 Listed $144,800 IRMLS
- 2023-01-20 Listing Removed — MIBOR as Distributed by MLS Grid
- 2023-01-12 Price Changed $150,000 IRMLS
- 2023-01-12 Price Changed $150,000 MIBOR as Distributed by MLS Grid
- 2022-12-02 Price Changed $165,000 IRMLS
- 2022-12-02 Price Changed $165,000 MIBOR as Distributed by MLS Grid
- 2022-10-21 Listed $168,500 IRMLS
- 2022-10-21 Listed $168,500 MIBOR as Distributed by MLS Grid
- 2022-06-21 Relisted — IRMLS
- 2022-06-21 Relisted — THAAR
- 2022-06-15 Listed — IRMLS
- 2022-05-23 Delisted — THAAR
- 2022-05-17 Listed $159,900 THAAR
- 2022-05-17 Listed $159,900 IRMLS
- 2021-12-18 Listed $159,900 IRMLS
Property tax history
+12.7%/yrLatest (2025): $2,125 · +195.6% YoY. Source: county tax records.
Cash-flow waterfall
monthlySold comps — $/sqft
last 12 mo · ≤1 miLoading sold comps…